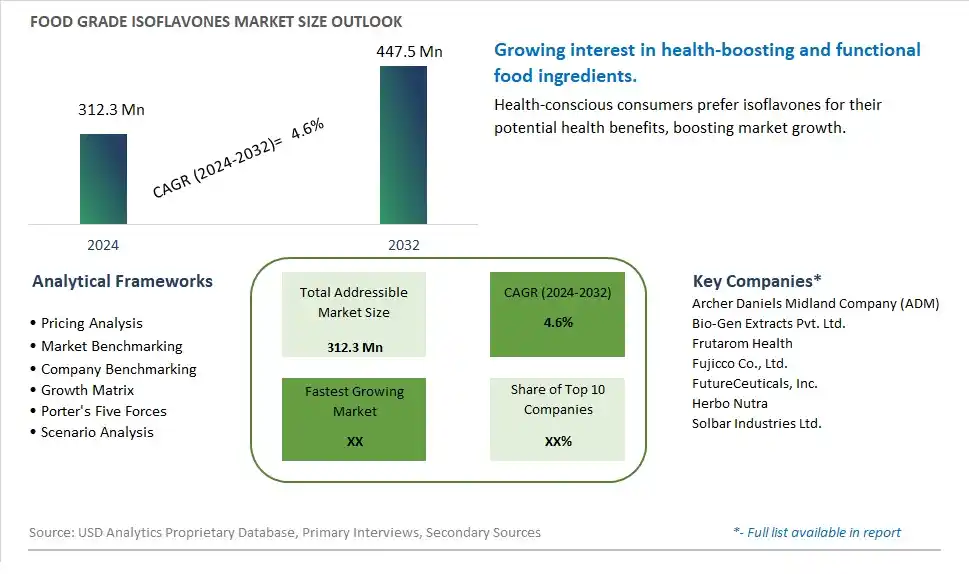
Global Food Grade Isoflavones Market Size is valued at $312.3 Million in 2024 and is forecast to register a growth rate (CAGR) of 4.6% to reach $447.5 Million by 2032.
The global Food Grade Isoflavones Market Comprehensive Study analyzes and forecasts the market size across 6 regions and 24 countries for diverse segments -By Type (Purity 40%, Purity 60%, Purity≥80%), By Application (Food Industry, Dietary Supplements, Others)
An Introduction to Food Grade Isoflavones Market
The Food Grade Isoflavones market in 2024 is experiencing significant growth, driven by the increasing demand for phytoestrogen-rich ingredients in functional foods and dietary supplements. Food-grade isoflavones, derived from soybeans and red clover, are known for their health benefits, including hormone balance and cardiovascular support. The market benefits from advancements in extraction and formulation technologies, the growing trend of health and wellness, and the expansion of the functional food sector. Additionally, the rising awareness of the benefits of isoflavones for women's health is contributing to market growth.
Food Grade Isoflavones Competitive Landscape
The market report analyses the leading companies in the industry including Archer Daniels Midland Company (ADM), Bio-Gen Extracts Pvt. Ltd., Frutarom Health, Fujicco Co., Ltd., FutureCeuticals, Inc., Herbo Nutra, Solbar Industries Ltd., and Others.
Food Grade Isoflavones Market Dynamics
Food Grade Isoflavones Market Trend: Increasing Demand for Functional Ingredients in Food and Beverage Products
One prominent trend in the food grade isoflavones market is the increasing demand for functional ingredients in food and beverage products. Consumers are seeking foods that offer additional health benefits beyond basic nutrition, leading to the popularity of functional ingredients such as isoflavones. Isoflavones, naturally occurring compounds found in soybeans and other legumes, are known for their potential health-promoting properties, including antioxidant and anti-inflammatory effects. This trend is driven by consumer interest in wellness-oriented foods, dietary supplements, and natural remedies that support overall health and well-being, leading to the incorporation of food grade isoflavones into a variety of functional food and beverage formulations.
Food Grade Isoflavones Market Driver: Consumer Awareness of Hormonal Health and Menopause Support
A key driver propelling the food grade isoflavones market is consumer awareness of hormonal health and menopause support. Isoflavones, particularly genistein and daidzein, are phytoestrogens that have been studied for their potential role in managing menopausal symptoms, such as hot flashes and night sweats, and supporting women's hormonal balance. As more women seek natural alternatives to hormone replacement therapy, the demand for isoflavone-rich foods and supplements has increased. The driver behind this trend is the growing interest in natural remedies, herbal supplements, and plant-based therapies for women's health issues, driving the adoption of food grade isoflavones as a dietary component for menopause support and hormonal well-being.
Food Grade Isoflavones Market Opportunity: Development of Isoflavone-Enriched Functional Foods and Supplements
A significant opportunity in the food grade isoflavones market lies in the development of isoflavone-enriched functional foods and dietary supplements targeting women's health and wellness. Companies can capitalize on this opportunity by formulating products such as soy-based beverages, fortified snacks, nutritional bars, and menopause support supplements that contain standardized levels of isoflavones. Additionally, there's potential for creating personalized nutrition solutions and product lines tailored to different life stages, health goals, and consumer preferences, offering a range of isoflavone-rich options for menopausal women, health-conscious individuals, and those seeking natural hormone support. By focusing on product innovation, marketing strategies that highlight the health benefits of isoflavones, and collaboration with healthcare professionals, companies can tap into the growing market for women's health products and contribute to improved wellness outcomes.
Food Grade Isoflavones Market Share Analysis: Purity ≥80% segment generated the highest revenue share in the industry
Among the types listed, Purity ≥80% stands out as the largest segment in the Food Grade Isoflavones market. Isoflavones are phytoestrogens found predominantly in soybeans and other legumes, known for their potential health benefits, including cardiovascular health and hormonal balance support. Products with higher purity levels of isoflavones, specifically ≥80%, are sought after for their concentrated bioactive compounds, making them preferred for dietary supplements and functional food formulations aimed at promoting overall wellness. The demand for high-purity isoflavones is driven by increasing consumer interest in natural and plant-based ingredients that offer health benefits without synthetic additives. Additionally, research highlighting the potential role of isoflavones in reducing the risk of chronic diseases like osteoporosis and certain cancers further boosts their popularity in dietary supplement markets. Manufacturers focus on stringent quality control measures to ensure purity and efficacy in their isoflavone products, meeting regulatory standards and consumer expectations for safe and effective nutritional supplements. As consumer awareness grows and the trend towards preventive healthcare strengthens, the Purity ≥80% segment is poised for continued growth in the Food Grade Isoflavones market, driven by its significant health-promoting properties and versatile applications in dietary and nutritional products.
Food Grade Isoflavones Market Share Analysis: Dietary Supplements is the fastest growing segment over the forecast period to 2032
The Dietary Supplements segment is projected to be the fastest-growing application segment in the Food Grade Isoflavones market through 2032. This growth is driven by increasing consumer awareness of the health benefits associated with isoflavones, particularly their role in supporting hormonal balance and overall wellness. Isoflavones are phytoestrogens found in soybeans and other plants, known for their potential to alleviate menopausal symptoms, improve bone health, and reduce the risk of certain cancers. As dietary supplement usage continues to rise globally, fueled by aging populations and growing interest in preventive healthcare, there is a growing demand for natural and plant-derived ingredients like isoflavones. Manufacturers are responding by developing innovative isoflavone formulations that cater to specific health concerns and consumer preferences for clean-label products. Regulatory support for health claims related to isoflavones further enhances market growth, encouraging consumers to incorporate isoflavone-rich supplements into their daily routines. The Dietary Supplements segment benefits from these trends, offering significant growth opportunities in the Food Grade Isoflavones market, driven by its pivotal role in promoting health and wellness through natural dietary supplementation.
Food Grade Isoflavones Market Segmentation
By Type
Purity 40%
Purity 60%
Purity≥80%
By Application
Food Industry
Dietary Supplements
Others
Countries Analyzed
North America (US, Canada, Mexico)
Europe (Germany, UK, France, Spain, Italy, Russia, Rest of Europe)
Asia Pacific (China, India, Japan, South Korea, Australia, South East Asia, Rest of Asia)
South America (Brazil, Argentina, Rest of South America)
Middle East and Africa (Saudi Arabia, UAE, Rest of Middle East, South Africa, Egypt, Rest of Africa)
Food Grade Isoflavones Companies Profiled in the Study
Archer Daniels Midland Company (ADM)
Bio-Gen Extracts Pvt. Ltd.
Frutarom Health
Fujicco Co., Ltd.
FutureCeuticals, Inc.
Herbo Nutra
Solbar Industries Ltd.
*- List Not Exhaustive
Chapter 1. TABLE OF CONTENTS
Chapter 2. Introduction to Food Grade Isoflavones Market
2.1. Market Overview
2.2. Key Statistics and Report Highlights
2.3. Scope of the Comprehensive Study
2.3.1. Market Definition
2.3.2 Countries and Regions Covered
2.3.3 Research Objective
2.3.4 Units, Currency, and Conversions
2.3.5 Industry Value Chain
2.4. Key Market Segments
2.5. Key Companies
2.6. Study Period
Chapter 3. Strategic Analysis Review
3.1. Food Grade Isoflavones Pricing Analysis and Forecast
3.2. Porter’s Five Forces
3.3. Market Ecosystem
3.4. SWOT Analysis
3.5. Regulatory Scenario
3.3. Effects of Inflation, Russia-Ukraine War, moderating economic growth, and other macroeconomic factors
Chapter 4. Competitive Landscape
4.1. Market Share Analysis
4.1.1. Global Food Grade Isoflavones Market Share by Company, 2023
4.1.2. Product Offerings of Leading Food Grade Isoflavones Companies
4.2. Market Entropy
4.2.1. New Product Launches in the Industry
4.2.2. Mergers, Acquisitions, Joint ventures, and Partnerships
4.3. Key Strategies and Best Practices
Chapter 5. Global Market Projections: Best, Reference, and Low Case Scenarios
5.1. Growth Analysis- Case Scenario Definitions
5.2. Low Growth Case Scenario Forecasts
5.3. Reference Growth Case Scenario Forecasts
5.4. High Growth Case Scenario Forecasts
Chapter 6. Market Dynamics
6.1. Food Grade Isoflavones Market Drivers
6.2. Food Grade Isoflavones Market Challenges
6.6. Food Grade Isoflavones Market Opportunities
6.4. Food Grade Isoflavones Market Trends
Chapter 7. Global Food Grade Isoflavones Market Outlook Trends
7.1. Global Food Grade Isoflavones Revenue (USD Million) and CAGR (%) by Type (2021-2032)
7.2. Global Food Grade Isoflavones Revenue (USD Million) and CAGR (%) by Application (2021-2032)
7.3. Global Food Grade Isoflavones Revenue (USD Million) and CAGR (%) by Product (2021-2032)
By Type
Purity 40%
Purity 60%
Purity≥80%
By Application
Food Industry
Dietary Supplements
Others
Chapter 8. Global Food Grade Isoflavones Regional Analysis and Outlook
8.1. Global Food Grade Isoflavones Revenue (USD Million) By Regions (2021- 2032)
8.2. North America Food Grade Isoflavones Revenue (USD Million) by Country (2021-2032)
8.2.1. United States Food Grade Isoflavones Regional Analysis and Outlook
8.2.2. Canada Food Grade Isoflavones Regional Analysis and Outlook
8.2.3. Mexico Food Grade Isoflavones Regional Analysis and Outlook
8.3. Europe Food Grade Isoflavones Revenue (USD Million), by Country (2021-2032)
8.3.1. Germany Food Grade Isoflavones Regional Analysis and Outlook
8.3.2. France Food Grade Isoflavones Regional Analysis and Outlook
8.3.3. United Kingdom Food Grade Isoflavones Regional Analysis and Outlook
8.3.4. Spain Food Grade Isoflavones Regional Analysis and Outlook
8.3.5. Italy Food Grade Isoflavones Regional Analysis and Outlook
8.3.6. Russia Food Grade Isoflavones Regional Analysis and Outlook
8.3.7. Rest of Europe Food Grade Isoflavones Regional Analysis and Outlook
8.4. Asia Pacific Food Grade Isoflavones Revenue (USD Million) by Country (2021-2032)
8.4.1. China Food Grade Isoflavones Regional Analysis and Outlook
8.4.2. Japan Food Grade Isoflavones Regional Analysis and Outlook
8.4.3. India Food Grade Isoflavones Regional Analysis and Outlook
8.4.4. South Korea Food Grade Isoflavones Regional Analysis and Outlook
8.4.5. Australia Food Grade Isoflavones Regional Analysis and Outlook
8.4.6. South East Asia Food Grade Isoflavones Regional Analysis and Outlook
8.4.7. Rest of Asia Pacific Food Grade Isoflavones Regional Analysis and Outlook
8.5. South America Food Grade Isoflavones Revenue (USD Million), by Country (2021-2032)
8.5.1. Brazil Food Grade Isoflavones Regional Analysis and Outlook
8.5.2. Argentina Food Grade Isoflavones Regional Analysis and Outlook
8.5.3. Rest of South America Food Grade Isoflavones Regional Analysis and Outlook
8.6. Middle East and Africa Food Grade Isoflavones Revenue (USD Million) by Country (2021-2032)
8.6.1. Middle East Food Grade Isoflavones Regional Analysis and Outlook
8.6.2. Africa Food Grade Isoflavones Regional Analysis and Outlook
Chapter 9. North America Food Grade Isoflavones Analysis and Outlook
9.1. North America Food Grade Isoflavones Revenue (USD Million) by Segments (2021-2032)
9.1.1. North America Food Grade Isoflavones Revenue (USD Million) by Type (2021-2032)
9.1.2. North America Food Grade Isoflavones Revenue (USD Million) by Application (2021-2032)
9.1.3. North America Food Grade Isoflavones Revenue (USD Million) by Product (2021-2032)
By Type
Purity 40%
Purity 60%
Purity≥80%
By Application
Food Industry
Dietary Supplements
Others
Chapter 10. Europe Food Grade Isoflavones Analysis and Outlook
10.1. Europe Food Grade Isoflavones Revenue (USD Million), by Segments (USD Million) (2021-2032)
10.1.1. Europe Food Grade Isoflavones Revenue (USD Million) by Type (2021-2032)
10.1.2. Europe Food Grade Isoflavones Revenue (USD Million) by Application (2021-2032)
10.1.3. Europe Food Grade Isoflavones Revenue (USD Million) by Product (2021-2032)
By Type
Purity 40%
Purity 60%
Purity≥80%
By Application
Food Industry
Dietary Supplements
Others
Chapter 11. Asia Pacific Food Grade Isoflavones Analysis and Outlook
11.1. Asia Pacific Food Grade Isoflavones Revenue (USD Million), and Revenue (USD Million) by Segments (2021-2032)
11.1.1. Asia Pacific Food Grade Isoflavones Revenue (USD Million) by Type (2021-2032)
11.1.2. Asia Pacific Food Grade Isoflavones Revenue (USD Million) by Application (2021-2032)
11.1.3. Asia Pacific Food Grade Isoflavones Revenue (USD Million) by Product (2021-2032)
By Type
Purity 40%
Purity 60%
Purity≥80%
By Application
Food Industry
Dietary Supplements
Others
Chapter 12. South America Food Grade Isoflavones Analysis and Outlook
12.1. South America Food Grade Isoflavones Revenue (USD Million), by Segments (2021-2032)
12.1.1. South America Food Grade Isoflavones Revenue (USD Million) by Type (2021-2032)
12.1.2. South America Food Grade Isoflavones Revenue (USD Million) by Application (2021-2032)
12.1.3. South America Food Grade Isoflavones Revenue (USD Million) by Product (2021-2032)
By Type
Purity 40%
Purity 60%
Purity≥80%
By Application
Food Industry
Dietary Supplements
Others
Chapter 13. Middle East and Africa Food Grade Isoflavones Analysis and Outlook
13.1. Middle East and Africa Food Grade Isoflavones Revenue (USD Million), by Segments (2021-2032)
13.1.1. Middle East and Africa Food Grade Isoflavones Revenue (USD Million) by Type (2021-2032)
13.1.2. Middle East and Africa Food Grade Isoflavones Revenue (USD Million) by Application (2021-2032)
13.1.3. Middle East and Africa Food Grade Isoflavones Revenue (USD Million) by Product (2021-2032)
By Type
Purity 40%
Purity 60%
Purity≥80%
By Application
Food Industry
Dietary Supplements
Others
Chapter 14. Food Grade Isoflavones Company Profiles
14.1 Business Overview
14.2 Product Profiles
14.3 SWOT Profiles
14.5 Recent Developments
14.6 Financial Profile
List of Companies
Archer Daniels Midland Company (ADM)
Bio-Gen Extracts Pvt. Ltd.
Frutarom Health
Fujicco Co., Ltd.
FutureCeuticals, Inc.
Herbo Nutra
Solbar Industries Ltd.
15. Methodology and Data Sources
15.1 Customization Offerings
15.2 Subscription Services
15.3 Related Reports
15.4 Publisher Expertise
LIST OF TABLES
Table 1 Market Segmentation Analysis
Table 2 Global Food Grade Isoflavones Market Share of Leading Companies, 2023
Table 3 Product Offerings of Leading Companies
Table 4 Low Growth Scenario Forecasts
Table 5 Reference Case Growth Scenario
Table 6 High Growth Case Scenario
Table 7 Global Food Grade Isoflavones Revenue (USD Million) And CAGR (%) By Type (2021-2032)
Table 8 Global Food Grade Isoflavones Revenue (USD Million) And CAGR (%) By Application (2021-2032)
Table 9 Global Food Grade Isoflavones Revenue (USD Million) And CAGR (%) By Product (2021-2032)
Table 10 Global Food Grade Isoflavones Market Revenue (USD Million) By Regions (2021-2032)
Table 11 Global Food Grade Isoflavones Market Share (%) By Regions (2021-2032)
Table 12 North America Food Grade Isoflavones Revenue (USD Million) By Country (2021-2032)
Table 13 Europe Food Grade Isoflavones Revenue (USD Million) By Country (2021-2032)
Table 14 Asia Pacific Food Grade Isoflavones Revenue (USD Million) By Country (2021-2032)
Table 15 South America Food Grade Isoflavones Revenue (USD Million) By Country (2021-2032)
Table 16 Middle East and Africa Food Grade Isoflavones Revenue (USD Million) By Region (2021-2032)
Table 17 North America Food Grade Isoflavones Revenue (USD Million) By Type (2021-2032)
Table 18 North America Food Grade Isoflavones Revenue (USD Million) By Application (2021-2032)
Table 19 North America Food Grade Isoflavones Revenue (USD Million) By Product (2021-2032)
Table 20 Europe Food Grade Isoflavones Revenue (USD Million) By Type (2021-2032)
Table 21 Europe Food Grade Isoflavones Revenue (USD Million) By Application (2021-2032)
Table 22 Europe Food Grade Isoflavones Revenue (USD Million) By Product (2021-2032)
Table 23 Asia Pacific Food Grade Isoflavones Revenue (USD Million) By Type (2021-2032)
Table 24 Asia Pacific Food Grade Isoflavones Revenue (USD Million) By Application (2021-2032)
Table 25 Asia Pacific Food Grade Isoflavones Revenue (USD Million) By Product (2021-2032)
Table 26 South America Food Grade Isoflavones Revenue (USD Million) By Type (2021-2032)
Table 27 South America Food Grade Isoflavones Revenue (USD Million) By Application (2021-2032)
Table 28 South America Food Grade Isoflavones Revenue (USD Million) By Product (2021-2032)
Table 29 Middle East and Africa Food Grade Isoflavones Revenue (USD Million) By Type (2021-2032)
Table 30 Middle East and Africa Food Grade Isoflavones Revenue (USD Million) By Application (2021-2032)
Table 31 Middle East and Africa Food Grade Isoflavones Revenue (USD Million) By Product (2021-2032)
LIST OF FIGURES
Figure 1. Market Scope
Figure 2. Pricing Forecasts Per Unit, 2023- 2032
Figure 3. Porter’s Five Forces
Figure 4. Global Food Grade Isoflavones Market Revenue (USD Million) By Regions (2021-2032)
Figure 5. Global Food Grade Isoflavones Market Share (%) By Regions (2023)
Figure 6. North America Food Grade Isoflavones Revenue (USD Million) By Country (2021-2032)
Figure 7. United States Food Grade Isoflavones Revenue (USD Million) By Country (2021-2032)
Figure 8. Canada Food Grade Isoflavones Revenue (USD Million) By Country (2021-2032)
Figure 9. Mexico Food Grade Isoflavones Revenue (USD Million) By Country (2021-2032)
Figure 10. Europe Food Grade Isoflavones Revenue (USD Million) By Country (2021-2032)
Figure 11. Germany Food Grade Isoflavones Revenue (USD Million) By Country (2021-2032)
Figure 12. France Food Grade Isoflavones Revenue (USD Million) By Country (2021-2032)
Figure 13. United Kingdom Food Grade Isoflavones Revenue (USD Million) By Country (2021-2032)
Figure 14. Spain Food Grade Isoflavones Revenue (USD Million) By Country (2021-2032)
Figure 15. Italy Food Grade Isoflavones Revenue (USD Million) By Country (2021-2032)
Figure 16. Russia Food Grade Isoflavones Revenue (USD Million) By Country (2021-2032)
Figure 17. Rest of Europe Food Grade Isoflavones Revenue (USD Million) By Country (2021-2032)
Figure 11. Asia Pacific Food Grade Isoflavones Revenue (USD Million) By Country (2021-2032)
Figure 12. China Food Grade Isoflavones Revenue (USD Million) By Country (2021-2032)
Figure 13. Japan Food Grade Isoflavones Revenue (USD Million) By Country (2021-2032)
Figure 14. India Food Grade Isoflavones Revenue (USD Million) By Country (2021-2032)
Figure 15. South Korea Food Grade Isoflavones Revenue (USD Million) By Country (2021-2032)
Figure 16. Australia Food Grade Isoflavones Revenue (USD Million) By Country (2021-2032)
Figure 17. South East Asia Food Grade Isoflavones Revenue (USD Million) By Country (2021-2032)
Figure 18. South America Food Grade Isoflavones Revenue (USD Million) By Country (2021-2032)
Figure 19. Brazil Food Grade Isoflavones Revenue (USD Million) By Country (2021-2032)
Figure 20. Argentina Food Grade Isoflavones Revenue (USD Million) By Country (2021-2032)
Figure 21. Rest of Asia Pacific Food Grade Isoflavones Revenue (USD Million) By Country (2021-2032)
Figure 22. Middle East and Africa Food Grade Isoflavones Revenue (USD Million) By Region (2021-2032)
Figure 23. Saudi Arabia Food Grade Isoflavones Revenue (USD Million) By Region (2021-2032)
Figure 24. The UAE Food Grade Isoflavones Revenue (USD Million) By Region (2021-2032)
Figure 25. Rest of Middle East Food Grade Isoflavones Revenue (USD Million) By Region (2021-2032)
Figure 26. South Africa Food Grade Isoflavones Revenue (USD Million) By Region (2021-2032)
Figure 27. Africa Food Grade Isoflavones Revenue (USD Million) By Region (2021-2032)
Figure 28. North America Food Grade Isoflavones Revenue (USD Million) By Type (2021-2032)
Figure 29. North America Food Grade Isoflavones Revenue (USD Million) By Application (2021-2032)
Figure 30. North America Food Grade Isoflavones Revenue (USD Million) By Product (2021-2032)
Figure 31. Europe Food Grade Isoflavones Revenue (USD Million) By Type (2021-2032)
Figure 32. Europe Food Grade Isoflavones Revenue (USD Million) By Application (2021-2032)
Figure 33. Europe Food Grade Isoflavones Revenue (USD Million) By Product (2021-2032)
Figure 34. Asia Pacific Food Grade Isoflavones Revenue (USD Million) By Type (2021-2032)
Figure 35. Asia Pacific Food Grade Isoflavones Revenue (USD Million) By Application (2021-2032)
Figure 36. Asia Pacific Food Grade Isoflavones Revenue (USD Million) By Product (2021-2032)
Figure 37. South America Food Grade Isoflavones Revenue (USD Million) By Type (2021-2032)
Figure 38. South America Food Grade Isoflavones Revenue (USD Million) By Application (2021-2032)
Figure 39. South America Food Grade Isoflavones Revenue (USD Million) By Product (2021-2032)
Figure 40. Middle East and Africa Food Grade Isoflavones Revenue (USD Million) By Type (2021-2032)
Figure 41. Middle East and Africa Food Grade Isoflavones Revenue (USD Million) By Application (2021-2032)
Figure 42. Middle East and Africa Food Grade Isoflavones Revenue (USD Million) By Product (2021-2032)
By Type
Purity 40%
Purity 60%
Purity≥80%
By Application
Food Industry
Dietary Supplements
Others
Countries Analyzed
North America (US, Canada, Mexico)
Europe (Germany, UK, France, Spain, Italy, Russia, Rest of Europe)
Asia Pacific (China, India, Japan, South Korea, Australia, South East Asia, Rest of Asia)
South America (Brazil, Argentina, Rest of South America)
Middle East and Africa (Saudi Arabia, UAE, Rest of Middle East, South Africa, Egypt, Rest of Africa)
