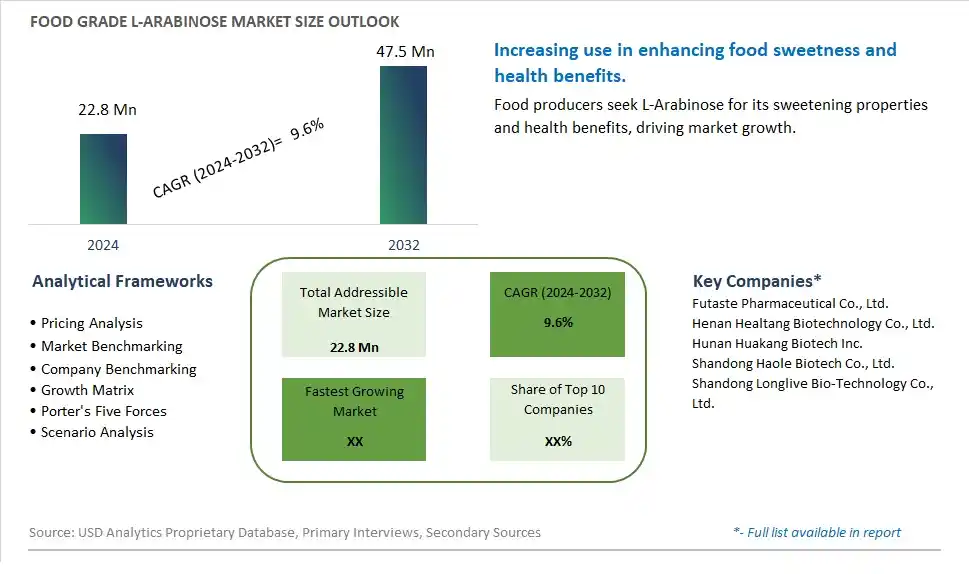
Global Food Grade L-Arabinose Market Size is valued at $22.8 Million in 2024 and is forecast to register a growth rate (CAGR) of 9.6% to reach $47.5 Million by 2032.
The global Food Grade L-Arabinose Market Comprehensive Study analyzes and forecasts the market size across 6 regions and 24 countries for diverse segments -By Type (Above 99.5%, 99 to 99.5%, Others), By Application (Food & Beverage, Healthcare Food, Others)
An Introduction to Food Grade L-Arabinose Market
In 2024, the Food Grade L Arabinose market is witnessing robust growth, driven by the increasing demand for natural sugar substitutes in the food and beverage industry. Food-grade L-arabinose, a naturally occurring sugar, is used to reduce sugar absorption and promote gut health. The market benefits from advancements in extraction and purification technologies, the growing trend of health-conscious and diabetic-friendly products, and the expansion of the functional and specialty food sectors. Additionally, the rising focus on reducing sugar intake and promoting natural sweeteners is contributing to market growth.
Food Grade L Arabinose Competitive Landscape
The market report analyses the leading companies in the industry including Futaste Pharmaceutical Co., Ltd., Henan Healtang Biotechnology Co., Ltd., Hunan Huakang Biotech Inc., Shandong Haole Biotech Co., Ltd., Shandong Longlive Bio-Technology Co., Ltd., and Others.
Food Grade L Arabinose Market Dynamics
Food Grade L Arabinose Market Trend: Demand for Low-Calorie Sweeteners and Sugar Substitutes
One prominent trend in the food grade L-arabinose market is the increasing demand for low-calorie sweeteners and sugar substitutes. As consumers become more health-conscious and seek alternatives to traditional sugars, there is a growing preference for natural sweeteners that offer sweetness without the calories. L-arabinose, a naturally occurring sugar found in fruits and vegetables, is gaining attention as a low-calorie sweetener due to its ability to reduce the absorption of sugar and calories in the body. This trend is driven by consumer preferences for healthier food options, reduced sugar intake, and products that cater to dietary restrictions and health goals, leading to the incorporation of food grade L-arabinose in various food and beverage formulations.
Food Grade L Arabinose Market Driver: Rising Awareness of Diabetes and Weight Management
A key driver propelling the food grade L-arabinose market is the rising awareness of diabetes and weight management among consumers. L-arabinose has been studied for its potential to modulate blood sugar levels, reduce glycemic response, and support weight loss efforts by inhibiting sugar absorption in the digestive tract. With the prevalence of diabetes and obesity-related health concerns, there is a growing demand for sugar alternatives that can help manage blood sugar levels and promote healthier dietary patterns. The driver behind this trend is the focus on preventive healthcare, lifestyle changes, and dietary strategies that prioritize glycemic control and weight management, driving the adoption of food grade L-arabinose as a functional ingredient in diabetic-friendly and low-calorie products.
Food Grade L Arabinose Market Opportunity: Formulation of Sugar-Reduced and Diabetic-Friendly Products
A significant opportunity in the food grade L-arabinose market lies in the formulation of sugar-reduced and diabetic-friendly food and beverage products. Companies can capitalize on this opportunity by incorporating L-arabinose into sugar-free or reduced-sugar formulations for beverages, confectionery items, baked goods, and dietary supplements. Additionally, there's potential for developing specialized products targeted at diabetic consumers, such as L-arabinose sweetened beverages, snacks, and desserts that offer sweetness with lower glycemic impact. By focusing on product innovation, marketing strategies that highlight the health benefits of L-arabinose, and collaborations with healthcare professionals, companies can meet the growing demand for sugar alternatives, cater to specific dietary needs, and contribute to improved health outcomes for consumers concerned about sugar intake and diabetes management.
Food Grade L-Arabinose Market Share Analysis- Largest Segment by Type
The Above 99.5% segment is the largest in the Food Grade L-Arabinose Market by type. This dominance is driven by the high purity and quality required for applications in food and beverage products. L-Arabinose with purity levels above 99.5% is preferred due to its superior performance as a natural sweetener and its ability to regulate blood sugar levels. This high-purity form is essential for ensuring the safety, efficacy, and quality of end products, especially in applications where taste and health benefits are critical. The continuous innovation in refining and purification processes enhances the availability and affordability of high-purity L-Arabinose. Additionally, the growing consumer demand for natural and healthier sugar alternatives supports the significant market share of the above 99.5% segment. The extensive use of high-purity L-Arabinose in various food and beverage formulations further reinforces its dominant position in the market.
Food Grade L-Arabinose Market Share Analysis- Fastest Growing Segment by Application
The Healthcare Food segment is poised to grow the fastest in the Food Grade L-Arabinose Market by application over the next five years. This rapid growth is driven by the increasing awareness of the health benefits of L-Arabinose, such as its ability to inhibit the absorption of sucrose and regulate blood sugar levels. As consumers become more health-conscious, there is a growing demand for functional foods and dietary supplements that offer specific health benefits. L-Arabinose is increasingly incorporated into healthcare food products, including diabetic-friendly foods, weight management products, and functional beverages. The continuous innovation in product formulations and the development of new applications for L-Arabinose in the healthcare food sector support the fast growth of this segment. The expanding market for health and wellness products, coupled with the rising prevalence of lifestyle-related health issues, further drives the demand for L-Arabinose in healthcare food applications.
Food Grade L Arabinose Market Segmentation
By Type
Above 99.5%
99 to 99.5%
Others
By Application
Food & Beverage
Healthcare Food
Others
Countries Analyzed
North America (US, Canada, Mexico)
Europe (Germany, UK, France, Spain, Italy, Russia, Rest of Europe)
Asia Pacific (China, India, Japan, South Korea, Australia, South East Asia, Rest of Asia)
South America (Brazil, Argentina, Rest of South America)
Middle East and Africa (Saudi Arabia, UAE, Rest of Middle East, South Africa, Egypt, Rest of Africa)
Food Grade L Arabinose Companies Profiled in the Study
Futaste Pharmaceutical Co., Ltd.
Henan Healtang Biotechnology Co., Ltd.
Hunan Huakang Biotech Inc.
Shandong Haole Biotech Co., Ltd.
Shandong Longlive Bio-Technology Co., Ltd.
*- List Not Exhaustive
Chapter 1. TABLE OF CONTENTS
Chapter 2. Introduction to Food Grade L Arabinose Market
2.1. Market Overview
2.2. Key Statistics and Report Highlights
2.3. Scope of the Comprehensive Study
2.3.1. Market Definition
2.3.2 Countries and Regions Covered
2.3.3 Research Objective
2.3.4 Units, Currency, and Conversions
2.3.5 Industry Value Chain
2.4. Key Market Segments
2.5. Key Companies
2.6. Study Period
Chapter 3. Strategic Analysis Review
3.1. Food Grade L Arabinose Pricing Analysis and Forecast
3.2. Porter’s Five Forces
3.3. Market Ecosystem
3.4. SWOT Analysis
3.5. Regulatory Scenario
3.3. Effects of Inflation, Russia-Ukraine War, moderating economic growth, and other macroeconomic factors
Chapter 4. Competitive Landscape
4.1. Market Share Analysis
4.1.1. Global Food Grade L Arabinose Market Share by Company, 2023
4.1.2. Product Offerings of Leading Food Grade L Arabinose Companies
4.2. Market Entropy
4.2.1. New Product Launches in the Industry
4.2.2. Mergers, Acquisitions, Joint ventures, and Partnerships
4.3. Key Strategies and Best Practices
Chapter 5. Global Market Projections: Best, Reference, and Low Case Scenarios
5.1. Growth Analysis- Case Scenario Definitions
5.2. Low Growth Case Scenario Forecasts
5.3. Reference Growth Case Scenario Forecasts
5.4. High Growth Case Scenario Forecasts
Chapter 6. Market Dynamics
6.1. Food Grade L Arabinose Market Drivers
6.2. Food Grade L Arabinose Market Challenges
6.6. Food Grade L Arabinose Market Opportunities
6.4. Food Grade L Arabinose Market Trends
Chapter 7. Global Food Grade L Arabinose Market Outlook Trends
7.1. Global Food Grade L Arabinose Revenue (USD Million) and CAGR (%) by Type (2021-2032)
7.2. Global Food Grade L Arabinose Revenue (USD Million) and CAGR (%) by Application (2021-2032)
7.3. Global Food Grade L Arabinose Revenue (USD Million) and CAGR (%) by Product (2021-2032)
By Type
Above 99.5%
99 to 99.5%
Others
By Application
Food & Beverage
Healthcare Food
Others
Chapter 8. Global Food Grade L Arabinose Regional Analysis and Outlook
8.1. Global Food Grade L Arabinose Revenue (USD Million) By Regions (2021- 2032)
8.2. North America Food Grade L Arabinose Revenue (USD Million) by Country (2021-2032)
8.2.1. United States Food Grade L Arabinose Regional Analysis and Outlook
8.2.2. Canada Food Grade L Arabinose Regional Analysis and Outlook
8.2.3. Mexico Food Grade L Arabinose Regional Analysis and Outlook
8.3. Europe Food Grade L Arabinose Revenue (USD Million), by Country (2021-2032)
8.3.1. Germany Food Grade L Arabinose Regional Analysis and Outlook
8.3.2. France Food Grade L Arabinose Regional Analysis and Outlook
8.3.3. United Kingdom Food Grade L Arabinose Regional Analysis and Outlook
8.3.4. Spain Food Grade L Arabinose Regional Analysis and Outlook
8.3.5. Italy Food Grade L Arabinose Regional Analysis and Outlook
8.3.6. Russia Food Grade L Arabinose Regional Analysis and Outlook
8.3.7. Rest of Europe Food Grade L Arabinose Regional Analysis and Outlook
8.4. Asia Pacific Food Grade L Arabinose Revenue (USD Million) by Country (2021-2032)
8.4.1. China Food Grade L Arabinose Regional Analysis and Outlook
8.4.2. Japan Food Grade L Arabinose Regional Analysis and Outlook
8.4.3. India Food Grade L Arabinose Regional Analysis and Outlook
8.4.4. South Korea Food Grade L Arabinose Regional Analysis and Outlook
8.4.5. Australia Food Grade L Arabinose Regional Analysis and Outlook
8.4.6. South East Asia Food Grade L Arabinose Regional Analysis and Outlook
8.4.7. Rest of Asia Pacific Food Grade L Arabinose Regional Analysis and Outlook
8.5. South America Food Grade L Arabinose Revenue (USD Million), by Country (2021-2032)
8.5.1. Brazil Food Grade L Arabinose Regional Analysis and Outlook
8.5.2. Argentina Food Grade L Arabinose Regional Analysis and Outlook
8.5.3. Rest of South America Food Grade L Arabinose Regional Analysis and Outlook
8.6. Middle East and Africa Food Grade L Arabinose Revenue (USD Million) by Country (2021-2032)
8.6.1. Middle East Food Grade L Arabinose Regional Analysis and Outlook
8.6.2. Africa Food Grade L Arabinose Regional Analysis and Outlook
Chapter 9. North America Food Grade L Arabinose Analysis and Outlook
9.1. North America Food Grade L Arabinose Revenue (USD Million) by Segments (2021-2032)
9.1.1. North America Food Grade L Arabinose Revenue (USD Million) by Type (2021-2032)
9.1.2. North America Food Grade L Arabinose Revenue (USD Million) by Application (2021-2032)
9.1.3. North America Food Grade L Arabinose Revenue (USD Million) by Product (2021-2032)
By Type
Above 99.5%
99 to 99.5%
Others
By Application
Food & Beverage
Healthcare Food
Others
Chapter 10. Europe Food Grade L Arabinose Analysis and Outlook
10.1. Europe Food Grade L Arabinose Revenue (USD Million), by Segments (USD Million) (2021-2032)
10.1.1. Europe Food Grade L Arabinose Revenue (USD Million) by Type (2021-2032)
10.1.2. Europe Food Grade L Arabinose Revenue (USD Million) by Application (2021-2032)
10.1.3. Europe Food Grade L Arabinose Revenue (USD Million) by Product (2021-2032)
By Type
Above 99.5%
99 to 99.5%
Others
By Application
Food & Beverage
Healthcare Food
Others
Chapter 11. Asia Pacific Food Grade L Arabinose Analysis and Outlook
11.1. Asia Pacific Food Grade L Arabinose Revenue (USD Million), and Revenue (USD Million) by Segments (2021-2032)
11.1.1. Asia Pacific Food Grade L Arabinose Revenue (USD Million) by Type (2021-2032)
11.1.2. Asia Pacific Food Grade L Arabinose Revenue (USD Million) by Application (2021-2032)
11.1.3. Asia Pacific Food Grade L Arabinose Revenue (USD Million) by Product (2021-2032)
By Type
Above 99.5%
99 to 99.5%
Others
By Application
Food & Beverage
Healthcare Food
Others
Chapter 12. South America Food Grade L Arabinose Analysis and Outlook
12.1. South America Food Grade L Arabinose Revenue (USD Million), by Segments (2021-2032)
12.1.1. South America Food Grade L Arabinose Revenue (USD Million) by Type (2021-2032)
12.1.2. South America Food Grade L Arabinose Revenue (USD Million) by Application (2021-2032)
12.1.3. South America Food Grade L Arabinose Revenue (USD Million) by Product (2021-2032)
By Type
Above 99.5%
99 to 99.5%
Others
By Application
Food & Beverage
Healthcare Food
Others
Chapter 13. Middle East and Africa Food Grade L Arabinose Analysis and Outlook
13.1. Middle East and Africa Food Grade L Arabinose Revenue (USD Million), by Segments (2021-2032)
13.1.1. Middle East and Africa Food Grade L Arabinose Revenue (USD Million) by Type (2021-2032)
13.1.2. Middle East and Africa Food Grade L Arabinose Revenue (USD Million) by Application (2021-2032)
13.1.3. Middle East and Africa Food Grade L Arabinose Revenue (USD Million) by Product (2021-2032)
By Type
Above 99.5%
99 to 99.5%
Others
By Application
Food & Beverage
Healthcare Food
Others
Chapter 14. Food Grade L Arabinose Company Profiles
14.1 Business Overview
14.2 Product Profiles
14.3 SWOT Profiles
14.5 Recent Developments
14.6 Financial Profile
List of Companies
Futaste Pharmaceutical Co., Ltd.
Henan Healtang Biotechnology Co., Ltd.
Hunan Huakang Biotech Inc.
Shandong Haole Biotech Co., Ltd.
Shandong Longlive Bio-Technology Co., Ltd.
15. Methodology and Data Sources
15.1 Customization Offerings
15.2 Subscription Services
15.3 Related Reports
15.4 Publisher Expertise
LIST OF TABLES
Table 1 Market Segmentation Analysis
Table 2 Global Food Grade L Arabinose Market Share of Leading Companies, 2023
Table 3 Product Offerings of Leading Companies
Table 4 Low Growth Scenario Forecasts
Table 5 Reference Case Growth Scenario
Table 6 High Growth Case Scenario
Table 7 Global Food Grade L Arabinose Revenue (USD Million) And CAGR (%) By Type (2021-2032)
Table 8 Global Food Grade L Arabinose Revenue (USD Million) And CAGR (%) By Application (2021-2032)
Table 9 Global Food Grade L Arabinose Revenue (USD Million) And CAGR (%) By Product (2021-2032)
Table 10 Global Food Grade L Arabinose Market Revenue (USD Million) By Regions (2021-2032)
Table 11 Global Food Grade L Arabinose Market Share (%) By Regions (2021-2032)
Table 12 North America Food Grade L Arabinose Revenue (USD Million) By Country (2021-2032)
Table 13 Europe Food Grade L Arabinose Revenue (USD Million) By Country (2021-2032)
Table 14 Asia Pacific Food Grade L Arabinose Revenue (USD Million) By Country (2021-2032)
Table 15 South America Food Grade L Arabinose Revenue (USD Million) By Country (2021-2032)
Table 16 Middle East and Africa Food Grade L Arabinose Revenue (USD Million) By Region (2021-2032)
Table 17 North America Food Grade L Arabinose Revenue (USD Million) By Type (2021-2032)
Table 18 North America Food Grade L Arabinose Revenue (USD Million) By Application (2021-2032)
Table 19 North America Food Grade L Arabinose Revenue (USD Million) By Product (2021-2032)
Table 20 Europe Food Grade L Arabinose Revenue (USD Million) By Type (2021-2032)
Table 21 Europe Food Grade L Arabinose Revenue (USD Million) By Application (2021-2032)
Table 22 Europe Food Grade L Arabinose Revenue (USD Million) By Product (2021-2032)
Table 23 Asia Pacific Food Grade L Arabinose Revenue (USD Million) By Type (2021-2032)
Table 24 Asia Pacific Food Grade L Arabinose Revenue (USD Million) By Application (2021-2032)
Table 25 Asia Pacific Food Grade L Arabinose Revenue (USD Million) By Product (2021-2032)
Table 26 South America Food Grade L Arabinose Revenue (USD Million) By Type (2021-2032)
Table 27 South America Food Grade L Arabinose Revenue (USD Million) By Application (2021-2032)
Table 28 South America Food Grade L Arabinose Revenue (USD Million) By Product (2021-2032)
Table 29 Middle East and Africa Food Grade L Arabinose Revenue (USD Million) By Type (2021-2032)
Table 30 Middle East and Africa Food Grade L Arabinose Revenue (USD Million) By Application (2021-2032)
Table 31 Middle East and Africa Food Grade L Arabinose Revenue (USD Million) By Product (2021-2032)
LIST OF FIGURES
Figure 1. Market Scope
Figure 2. Pricing Forecasts Per Unit, 2023- 2032
Figure 3. Porter’s Five Forces
Figure 4. Global Food Grade L Arabinose Market Revenue (USD Million) By Regions (2021-2032)
Figure 5. Global Food Grade L Arabinose Market Share (%) By Regions (2023)
Figure 6. North America Food Grade L Arabinose Revenue (USD Million) By Country (2021-2032)
Figure 7. United States Food Grade L Arabinose Revenue (USD Million) By Country (2021-2032)
Figure 8. Canada Food Grade L Arabinose Revenue (USD Million) By Country (2021-2032)
Figure 9. Mexico Food Grade L Arabinose Revenue (USD Million) By Country (2021-2032)
Figure 10. Europe Food Grade L Arabinose Revenue (USD Million) By Country (2021-2032)
Figure 11. Germany Food Grade L Arabinose Revenue (USD Million) By Country (2021-2032)
Figure 12. France Food Grade L Arabinose Revenue (USD Million) By Country (2021-2032)
Figure 13. United Kingdom Food Grade L Arabinose Revenue (USD Million) By Country (2021-2032)
Figure 14. Spain Food Grade L Arabinose Revenue (USD Million) By Country (2021-2032)
Figure 15. Italy Food Grade L Arabinose Revenue (USD Million) By Country (2021-2032)
Figure 16. Russia Food Grade L Arabinose Revenue (USD Million) By Country (2021-2032)
Figure 17. Rest of Europe Food Grade L Arabinose Revenue (USD Million) By Country (2021-2032)
Figure 11. Asia Pacific Food Grade L Arabinose Revenue (USD Million) By Country (2021-2032)
Figure 12. China Food Grade L Arabinose Revenue (USD Million) By Country (2021-2032)
Figure 13. Japan Food Grade L Arabinose Revenue (USD Million) By Country (2021-2032)
Figure 14. India Food Grade L Arabinose Revenue (USD Million) By Country (2021-2032)
Figure 15. South Korea Food Grade L Arabinose Revenue (USD Million) By Country (2021-2032)
Figure 16. Australia Food Grade L Arabinose Revenue (USD Million) By Country (2021-2032)
Figure 17. South East Asia Food Grade L Arabinose Revenue (USD Million) By Country (2021-2032)
Figure 18. South America Food Grade L Arabinose Revenue (USD Million) By Country (2021-2032)
Figure 19. Brazil Food Grade L Arabinose Revenue (USD Million) By Country (2021-2032)
Figure 20. Argentina Food Grade L Arabinose Revenue (USD Million) By Country (2021-2032)
Figure 21. Rest of Asia Pacific Food Grade L Arabinose Revenue (USD Million) By Country (2021-2032)
Figure 22. Middle East and Africa Food Grade L Arabinose Revenue (USD Million) By Region (2021-2032)
Figure 23. Saudi Arabia Food Grade L Arabinose Revenue (USD Million) By Region (2021-2032)
Figure 24. The UAE Food Grade L Arabinose Revenue (USD Million) By Region (2021-2032)
Figure 25. Rest of Middle East Food Grade L Arabinose Revenue (USD Million) By Region (2021-2032)
Figure 26. South Africa Food Grade L Arabinose Revenue (USD Million) By Region (2021-2032)
Figure 27. Africa Food Grade L Arabinose Revenue (USD Million) By Region (2021-2032)
Figure 28. North America Food Grade L Arabinose Revenue (USD Million) By Type (2021-2032)
Figure 29. North America Food Grade L Arabinose Revenue (USD Million) By Application (2021-2032)
Figure 30. North America Food Grade L Arabinose Revenue (USD Million) By Product (2021-2032)
Figure 31. Europe Food Grade L Arabinose Revenue (USD Million) By Type (2021-2032)
Figure 32. Europe Food Grade L Arabinose Revenue (USD Million) By Application (2021-2032)
Figure 33. Europe Food Grade L Arabinose Revenue (USD Million) By Product (2021-2032)
Figure 34. Asia Pacific Food Grade L Arabinose Revenue (USD Million) By Type (2021-2032)
Figure 35. Asia Pacific Food Grade L Arabinose Revenue (USD Million) By Application (2021-2032)
Figure 36. Asia Pacific Food Grade L Arabinose Revenue (USD Million) By Product (2021-2032)
Figure 37. South America Food Grade L Arabinose Revenue (USD Million) By Type (2021-2032)
Figure 38. South America Food Grade L Arabinose Revenue (USD Million) By Application (2021-2032)
Figure 39. South America Food Grade L Arabinose Revenue (USD Million) By Product (2021-2032)
Figure 40. Middle East and Africa Food Grade L Arabinose Revenue (USD Million) By Type (2021-2032)
Figure 41. Middle East and Africa Food Grade L Arabinose Revenue (USD Million) By Application (2021-2032)
Figure 42. Middle East and Africa Food Grade L Arabinose Revenue (USD Million) By Product (2021-2032)
By Type
Above 99.5%
99 to 99.5%
Others
By Application
Food & Beverage
Healthcare Food
Others
Countries Analyzed
North America (US, Canada, Mexico)
Europe (Germany, UK, France, Spain, Italy, Russia, Rest of Europe)
Asia Pacific (China, India, Japan, South Korea, Australia, South East Asia, Rest of Asia)
South America (Brazil, Argentina, Rest of South America)
Middle East and Africa (Saudi Arabia, UAE, Rest of Middle East, South Africa, Egypt, Rest of Africa)
