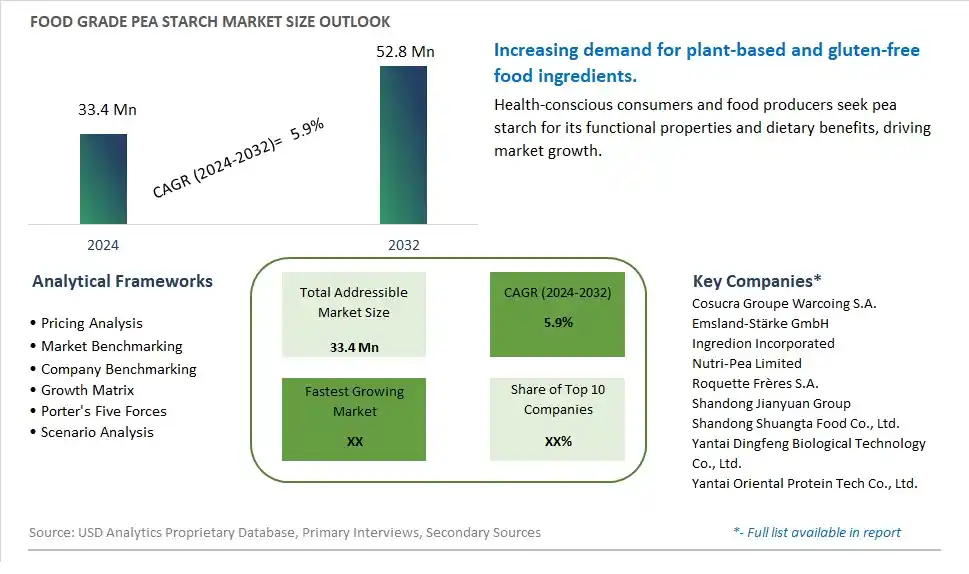
Global Food Grade Pea Starch Market Size is valued at $33.4 Million in 2024 and is forecast to register a growth rate (CAGR) of 5.9% to reach $52.8 Million by 2032.
The global Food Grade Pea Starch Market Comprehensive Study analyzes and forecasts the market size across 6 regions and 24 countries for diverse segments -By Type (Organic, Conventional), By Application (Snacks & savory products, Soups & sauces, Meat & poultry products, Confectionery products, Bakery products, Dairy products, Others)
An Introduction to Food Grade Pea Starch Market
The Food Grade Pea Starch market in 2024 is experiencing significant growth, driven by the increasing demand for clean label and plant-based ingredients in food products. Food grade pea starch, derived from yellow peas, is used as a thickening, gelling, and stabilizing agent in various applications, including soups, sauces, and snacks. The market benefits from advancements in pea starch extraction and processing technologies, the growing trend of plant-based and gluten-free diets, and the expansion of the functional food sector. Additionally, the rising awareness of the nutritional benefits of pea starch is contributing to market growth.
Food Grade Pea Starch Competitive Landscape
The market report analyses the leading companies in the industry including Cosucra Groupe Warcoing S.A., Emsland-Stärke GmbH, Ingredion Incorporated, Nutri-Pea Limited, Roquette Frères S.A., Shandong Jianyuan Group, Shandong Shuangta Food Co., Ltd., Yantai Dingfeng Biological Technology Co., Ltd., Yantai Oriental Protein Tech Co., Ltd., and Others.
Food Grade Pea Starch Market Dynamics
Food Grade Pea Starch Market Trend: Growth in Plant-Based and Clean Label Products
One prominent trend in the food grade pea starch market is the growth in plant-based and clean label products. As consumers increasingly prioritize health and sustainability, there is a rising demand for plant-derived ingredients in food and beverage formulations. Food grade pea starch, sourced from peas, is gaining popularity as a clean label ingredient due to its natural origin, gluten-free nature, and functional properties as a thickener, stabilizer, and binder. This trend is driven by the shift towards plant-based diets, dietary restrictions such as gluten intolerance, and the preference for minimally processed, recognizable ingredients, leading to the incorporation of food grade pea starch in a variety of plant-based and clean label products.
Food Grade Pea Starch Market Driver: Rising Awareness of Gluten-Free and Allergen-Free Alternatives
A key driver propelling the food grade pea starch market is the rising awareness of gluten-free and allergen-free alternatives. Pea starch, being naturally free from gluten, allergens, and genetically modified organisms (GMOs), caters to consumers with celiac disease, gluten sensitivity, and other dietary restrictions. The driver behind this trend is the growing prevalence of gluten-related disorders, increased awareness of food allergens, and the need for ingredient transparency, driving the demand for food grade pea starch as a functional and safe alternative in gluten-free, allergen-free, and clean label food products.
Food Grade Pea Starch Market Opportunity: Expansion into Plant-Based Meat and Dairy Alternatives
A significant opportunity in the food grade pea starch market lies in the expansion into plant-based meat and dairy alternatives. Companies can capitalize on this opportunity by developing pea starch-based formulations for plant-based burgers, sausages, dairy-free cheeses, and other vegan meat and dairy substitutes. Pea starch offers textural properties, binding capabilities, and mouthfeel similar to animal-derived ingredients, making it a versatile component in plant-based formulations. By focusing on product innovation, collaboration with food manufacturers in the plant-based sector, and marketing strategies that emphasize the health, sustainability, and functionality of pea starch, companies can tap into the growing market for plant-based alternatives, cater to evolving consumer preferences, and contribute to the growth of the plant-based food industry.
Food Grade Pea Starch Market Share Analysis: Conventional segment generated the highest revenue share in the industry
Among the types listed, Conventional pea starch is the largest segment in the Food Grade Pea Starch market. Conventional pea starch is derived from non-organic peas through processes that involve washing, milling, and separation techniques to isolate the starch component. It finds extensive application across various industries, including food and beverage, pharmaceuticals, and animal feed, due to its functional properties such as thickening, stabilizing, and gelling. In the food industry, conventional pea starch is commonly used in processed foods, bakery products, snacks, and soups as a clean-label ingredient to enhance texture, improve shelf life, and replace other starches or additives. The demand for conventional pea starch is driven by its cost-effectiveness, availability, and versatility in food formulations, catering to diverse consumer preferences for natural and plant-based ingredients.
Food Grade Pea Starch Market Share Analysis: Snacks & Savory Products is the fastest growing segment over the forecast period to 2032
The Snacks & Savory Products segment is projected to be the fastest-growing application segment in the Food Grade Pea Starch market through 2032. Pea starch is increasingly favored in snacks and savory product formulations due to its functional benefits, including texture enhancement, moisture retention, and crispness improvement. As consumer demand for healthier snack options grows, food manufacturers are incorporating pea starch into extruded snacks, crisps, and savory baked goods to achieve desired sensory attributes without compromising on nutritional value. Further, pea starch's natural origin and gluten-free properties align with clean-label trends and dietary preferences, further driving its adoption in snacks and savory product categories. Thus, the Snacks & Savory Products segment presents significant growth opportunities in the Food Grade Pea Starch market, supported by evolving consumer preferences towards nutritious and functional snack choices.
Food Grade Pea Starch Market Segmentation
By Type
Organic
Conventional
By Application
Snacks & savory products
Soups & sauces
Meat & poultry products
Confectionery products
Bakery products
Dairy products
Others
Countries Analyzed
North America (US, Canada, Mexico)
Europe (Germany, UK, France, Spain, Italy, Russia, Rest of Europe)
Asia Pacific (China, India, Japan, South Korea, Australia, South East Asia, Rest of Asia)
South America (Brazil, Argentina, Rest of South America)
Middle East and Africa (Saudi Arabia, UAE, Rest of Middle East, South Africa, Egypt, Rest of Africa)
Food Grade Pea Starch Companies Profiled in the Study
Cosucra Groupe Warcoing S.A.
Emsland-Stärke GmbH
Ingredion Incorporated
Nutri-Pea Limited
Roquette Frères S.A.
Shandong Jianyuan Group
Shandong Shuangta Food Co., Ltd.
Yantai Dingfeng Biological Technology Co., Ltd.
Yantai Oriental Protein Tech Co., Ltd.
*- List Not Exhaustive
Chapter 1. TABLE OF CONTENTS
Chapter 2. Introduction to Food Grade Pea Starch Market
2.1. Market Overview
2.2. Key Statistics and Report Highlights
2.3. Scope of the Comprehensive Study
2.3.1. Market Definition
2.3.2 Countries and Regions Covered
2.3.3 Research Objective
2.3.4 Units, Currency, and Conversions
2.3.5 Industry Value Chain
2.4. Key Market Segments
2.5. Key Companies
2.6. Study Period
Chapter 3. Strategic Analysis Review
3.1. Food Grade Pea Starch Pricing Analysis and Forecast
3.2. Porter’s Five Forces
3.3. Market Ecosystem
3.4. SWOT Analysis
3.5. Regulatory Scenario
3.3. Effects of Inflation, Russia-Ukraine War, moderating economic growth, and other macroeconomic factors
Chapter 4. Competitive Landscape
4.1. Market Share Analysis
4.1.1. Global Food Grade Pea Starch Market Share by Company, 2023
4.1.2. Product Offerings of Leading Food Grade Pea Starch Companies
4.2. Market Entropy
4.2.1. New Product Launches in the Industry
4.2.2. Mergers, Acquisitions, Joint ventures, and Partnerships
4.3. Key Strategies and Best Practices
Chapter 5. Global Market Projections: Best, Reference, and Low Case Scenarios
5.1. Growth Analysis- Case Scenario Definitions
5.2. Low Growth Case Scenario Forecasts
5.3. Reference Growth Case Scenario Forecasts
5.4. High Growth Case Scenario Forecasts
Chapter 6. Market Dynamics
6.1. Food Grade Pea Starch Market Drivers
6.2. Food Grade Pea Starch Market Challenges
6.6. Food Grade Pea Starch Market Opportunities
6.4. Food Grade Pea Starch Market Trends
Chapter 7. Global Food Grade Pea Starch Market Outlook Trends
7.1. Global Food Grade Pea Starch Revenue (USD Million) and CAGR (%) by Type (2021-2032)
7.2. Global Food Grade Pea Starch Revenue (USD Million) and CAGR (%) by Application (2021-2032)
7.3. Global Food Grade Pea Starch Revenue (USD Million) and CAGR (%) by Product (2021-2032)
By Type
Organic
Conventional
By Application
Snacks & savory products
Soups & sauces
Meat & poultry products
Confectionery products
Bakery products
Dairy products
Others
Chapter 8. Global Food Grade Pea Starch Regional Analysis and Outlook
8.1. Global Food Grade Pea Starch Revenue (USD Million) By Regions (2021- 2032)
8.2. North America Food Grade Pea Starch Revenue (USD Million) by Country (2021-2032)
8.2.1. United States Food Grade Pea Starch Regional Analysis and Outlook
8.2.2. Canada Food Grade Pea Starch Regional Analysis and Outlook
8.2.3. Mexico Food Grade Pea Starch Regional Analysis and Outlook
8.3. Europe Food Grade Pea Starch Revenue (USD Million), by Country (2021-2032)
8.3.1. Germany Food Grade Pea Starch Regional Analysis and Outlook
8.3.2. France Food Grade Pea Starch Regional Analysis and Outlook
8.3.3. United Kingdom Food Grade Pea Starch Regional Analysis and Outlook
8.3.4. Spain Food Grade Pea Starch Regional Analysis and Outlook
8.3.5. Italy Food Grade Pea Starch Regional Analysis and Outlook
8.3.6. Russia Food Grade Pea Starch Regional Analysis and Outlook
8.3.7. Rest of Europe Food Grade Pea Starch Regional Analysis and Outlook
8.4. Asia Pacific Food Grade Pea Starch Revenue (USD Million) by Country (2021-2032)
8.4.1. China Food Grade Pea Starch Regional Analysis and Outlook
8.4.2. Japan Food Grade Pea Starch Regional Analysis and Outlook
8.4.3. India Food Grade Pea Starch Regional Analysis and Outlook
8.4.4. South Korea Food Grade Pea Starch Regional Analysis and Outlook
8.4.5. Australia Food Grade Pea Starch Regional Analysis and Outlook
8.4.6. South East Asia Food Grade Pea Starch Regional Analysis and Outlook
8.4.7. Rest of Asia Pacific Food Grade Pea Starch Regional Analysis and Outlook
8.5. South America Food Grade Pea Starch Revenue (USD Million), by Country (2021-2032)
8.5.1. Brazil Food Grade Pea Starch Regional Analysis and Outlook
8.5.2. Argentina Food Grade Pea Starch Regional Analysis and Outlook
8.5.3. Rest of South America Food Grade Pea Starch Regional Analysis and Outlook
8.6. Middle East and Africa Food Grade Pea Starch Revenue (USD Million) by Country (2021-2032)
8.6.1. Middle East Food Grade Pea Starch Regional Analysis and Outlook
8.6.2. Africa Food Grade Pea Starch Regional Analysis and Outlook
Chapter 9. North America Food Grade Pea Starch Analysis and Outlook
9.1. North America Food Grade Pea Starch Revenue (USD Million) by Segments (2021-2032)
9.1.1. North America Food Grade Pea Starch Revenue (USD Million) by Type (2021-2032)
9.1.2. North America Food Grade Pea Starch Revenue (USD Million) by Application (2021-2032)
9.1.3. North America Food Grade Pea Starch Revenue (USD Million) by Product (2021-2032)
By Type
Organic
Conventional
By Application
Snacks & savory products
Soups & sauces
Meat & poultry products
Confectionery products
Bakery products
Dairy products
Others
Chapter 10. Europe Food Grade Pea Starch Analysis and Outlook
10.1. Europe Food Grade Pea Starch Revenue (USD Million), by Segments (USD Million) (2021-2032)
10.1.1. Europe Food Grade Pea Starch Revenue (USD Million) by Type (2021-2032)
10.1.2. Europe Food Grade Pea Starch Revenue (USD Million) by Application (2021-2032)
10.1.3. Europe Food Grade Pea Starch Revenue (USD Million) by Product (2021-2032)
By Type
Organic
Conventional
By Application
Snacks & savory products
Soups & sauces
Meat & poultry products
Confectionery products
Bakery products
Dairy products
Others
Chapter 11. Asia Pacific Food Grade Pea Starch Analysis and Outlook
11.1. Asia Pacific Food Grade Pea Starch Revenue (USD Million), and Revenue (USD Million) by Segments (2021-2032)
11.1.1. Asia Pacific Food Grade Pea Starch Revenue (USD Million) by Type (2021-2032)
11.1.2. Asia Pacific Food Grade Pea Starch Revenue (USD Million) by Application (2021-2032)
11.1.3. Asia Pacific Food Grade Pea Starch Revenue (USD Million) by Product (2021-2032)
By Type
Organic
Conventional
By Application
Snacks & savory products
Soups & sauces
Meat & poultry products
Confectionery products
Bakery products
Dairy products
Others
Chapter 12. South America Food Grade Pea Starch Analysis and Outlook
12.1. South America Food Grade Pea Starch Revenue (USD Million), by Segments (2021-2032)
12.1.1. South America Food Grade Pea Starch Revenue (USD Million) by Type (2021-2032)
12.1.2. South America Food Grade Pea Starch Revenue (USD Million) by Application (2021-2032)
12.1.3. South America Food Grade Pea Starch Revenue (USD Million) by Product (2021-2032)
By Type
Organic
Conventional
By Application
Snacks & savory products
Soups & sauces
Meat & poultry products
Confectionery products
Bakery products
Dairy products
Others
Chapter 13. Middle East and Africa Food Grade Pea Starch Analysis and Outlook
13.1. Middle East and Africa Food Grade Pea Starch Revenue (USD Million), by Segments (2021-2032)
13.1.1. Middle East and Africa Food Grade Pea Starch Revenue (USD Million) by Type (2021-2032)
13.1.2. Middle East and Africa Food Grade Pea Starch Revenue (USD Million) by Application (2021-2032)
13.1.3. Middle East and Africa Food Grade Pea Starch Revenue (USD Million) by Product (2021-2032)
By Type
Organic
Conventional
By Application
Snacks & savory products
Soups & sauces
Meat & poultry products
Confectionery products
Bakery products
Dairy products
Others
Chapter 14. Food Grade Pea Starch Company Profiles
14.1 Business Overview
14.2 Product Profiles
14.3 SWOT Profiles
14.5 Recent Developments
14.6 Financial Profile
List of Companies
Cosucra Groupe Warcoing S.A.
Emsland-Stärke GmbH
Ingredion Incorporated
Nutri-Pea Limited
Roquette Frères S.A.
Shandong Jianyuan Group
Shandong Shuangta Food Co., Ltd.
Yantai Dingfeng Biological Technology Co., Ltd.
Yantai Oriental Protein Tech Co., Ltd.
15. Methodology and Data Sources
15.1 Customization Offerings
15.2 Subscription Services
15.3 Related Reports
15.4 Publisher Expertise
LIST OF TABLES
Table 1 Market Segmentation Analysis
Table 2 Global Food Grade Pea Starch Market Share of Leading Companies, 2023
Table 3 Product Offerings of Leading Companies
Table 4 Low Growth Scenario Forecasts
Table 5 Reference Case Growth Scenario
Table 6 High Growth Case Scenario
Table 7 Global Food Grade Pea Starch Revenue (USD Million) And CAGR (%) By Type (2021-2032)
Table 8 Global Food Grade Pea Starch Revenue (USD Million) And CAGR (%) By Application (2021-2032)
Table 9 Global Food Grade Pea Starch Revenue (USD Million) And CAGR (%) By Product (2021-2032)
Table 10 Global Food Grade Pea Starch Market Revenue (USD Million) By Regions (2021-2032)
Table 11 Global Food Grade Pea Starch Market Share (%) By Regions (2021-2032)
Table 12 North America Food Grade Pea Starch Revenue (USD Million) By Country (2021-2032)
Table 13 Europe Food Grade Pea Starch Revenue (USD Million) By Country (2021-2032)
Table 14 Asia Pacific Food Grade Pea Starch Revenue (USD Million) By Country (2021-2032)
Table 15 South America Food Grade Pea Starch Revenue (USD Million) By Country (2021-2032)
Table 16 Middle East and Africa Food Grade Pea Starch Revenue (USD Million) By Region (2021-2032)
Table 17 North America Food Grade Pea Starch Revenue (USD Million) By Type (2021-2032)
Table 18 North America Food Grade Pea Starch Revenue (USD Million) By Application (2021-2032)
Table 19 North America Food Grade Pea Starch Revenue (USD Million) By Product (2021-2032)
Table 20 Europe Food Grade Pea Starch Revenue (USD Million) By Type (2021-2032)
Table 21 Europe Food Grade Pea Starch Revenue (USD Million) By Application (2021-2032)
Table 22 Europe Food Grade Pea Starch Revenue (USD Million) By Product (2021-2032)
Table 23 Asia Pacific Food Grade Pea Starch Revenue (USD Million) By Type (2021-2032)
Table 24 Asia Pacific Food Grade Pea Starch Revenue (USD Million) By Application (2021-2032)
Table 25 Asia Pacific Food Grade Pea Starch Revenue (USD Million) By Product (2021-2032)
Table 26 South America Food Grade Pea Starch Revenue (USD Million) By Type (2021-2032)
Table 27 South America Food Grade Pea Starch Revenue (USD Million) By Application (2021-2032)
Table 28 South America Food Grade Pea Starch Revenue (USD Million) By Product (2021-2032)
Table 29 Middle East and Africa Food Grade Pea Starch Revenue (USD Million) By Type (2021-2032)
Table 30 Middle East and Africa Food Grade Pea Starch Revenue (USD Million) By Application (2021-2032)
Table 31 Middle East and Africa Food Grade Pea Starch Revenue (USD Million) By Product (2021-2032)
LIST OF FIGURES
Figure 1. Market Scope
Figure 2. Pricing Forecasts Per Unit, 2023- 2032
Figure 3. Porter’s Five Forces
Figure 4. Global Food Grade Pea Starch Market Revenue (USD Million) By Regions (2021-2032)
Figure 5. Global Food Grade Pea Starch Market Share (%) By Regions (2023)
Figure 6. North America Food Grade Pea Starch Revenue (USD Million) By Country (2021-2032)
Figure 7. United States Food Grade Pea Starch Revenue (USD Million) By Country (2021-2032)
Figure 8. Canada Food Grade Pea Starch Revenue (USD Million) By Country (2021-2032)
Figure 9. Mexico Food Grade Pea Starch Revenue (USD Million) By Country (2021-2032)
Figure 10. Europe Food Grade Pea Starch Revenue (USD Million) By Country (2021-2032)
Figure 11. Germany Food Grade Pea Starch Revenue (USD Million) By Country (2021-2032)
Figure 12. France Food Grade Pea Starch Revenue (USD Million) By Country (2021-2032)
Figure 13. United Kingdom Food Grade Pea Starch Revenue (USD Million) By Country (2021-2032)
Figure 14. Spain Food Grade Pea Starch Revenue (USD Million) By Country (2021-2032)
Figure 15. Italy Food Grade Pea Starch Revenue (USD Million) By Country (2021-2032)
Figure 16. Russia Food Grade Pea Starch Revenue (USD Million) By Country (2021-2032)
Figure 17. Rest of Europe Food Grade Pea Starch Revenue (USD Million) By Country (2021-2032)
Figure 11. Asia Pacific Food Grade Pea Starch Revenue (USD Million) By Country (2021-2032)
Figure 12. China Food Grade Pea Starch Revenue (USD Million) By Country (2021-2032)
Figure 13. Japan Food Grade Pea Starch Revenue (USD Million) By Country (2021-2032)
Figure 14. India Food Grade Pea Starch Revenue (USD Million) By Country (2021-2032)
Figure 15. South Korea Food Grade Pea Starch Revenue (USD Million) By Country (2021-2032)
Figure 16. Australia Food Grade Pea Starch Revenue (USD Million) By Country (2021-2032)
Figure 17. South East Asia Food Grade Pea Starch Revenue (USD Million) By Country (2021-2032)
Figure 18. South America Food Grade Pea Starch Revenue (USD Million) By Country (2021-2032)
Figure 19. Brazil Food Grade Pea Starch Revenue (USD Million) By Country (2021-2032)
Figure 20. Argentina Food Grade Pea Starch Revenue (USD Million) By Country (2021-2032)
Figure 21. Rest of Asia Pacific Food Grade Pea Starch Revenue (USD Million) By Country (2021-2032)
Figure 22. Middle East and Africa Food Grade Pea Starch Revenue (USD Million) By Region (2021-2032)
Figure 23. Saudi Arabia Food Grade Pea Starch Revenue (USD Million) By Region (2021-2032)
Figure 24. The UAE Food Grade Pea Starch Revenue (USD Million) By Region (2021-2032)
Figure 25. Rest of Middle East Food Grade Pea Starch Revenue (USD Million) By Region (2021-2032)
Figure 26. South Africa Food Grade Pea Starch Revenue (USD Million) By Region (2021-2032)
Figure 27. Africa Food Grade Pea Starch Revenue (USD Million) By Region (2021-2032)
Figure 28. North America Food Grade Pea Starch Revenue (USD Million) By Type (2021-2032)
Figure 29. North America Food Grade Pea Starch Revenue (USD Million) By Application (2021-2032)
Figure 30. North America Food Grade Pea Starch Revenue (USD Million) By Product (2021-2032)
Figure 31. Europe Food Grade Pea Starch Revenue (USD Million) By Type (2021-2032)
Figure 32. Europe Food Grade Pea Starch Revenue (USD Million) By Application (2021-2032)
Figure 33. Europe Food Grade Pea Starch Revenue (USD Million) By Product (2021-2032)
Figure 34. Asia Pacific Food Grade Pea Starch Revenue (USD Million) By Type (2021-2032)
Figure 35. Asia Pacific Food Grade Pea Starch Revenue (USD Million) By Application (2021-2032)
Figure 36. Asia Pacific Food Grade Pea Starch Revenue (USD Million) By Product (2021-2032)
Figure 37. South America Food Grade Pea Starch Revenue (USD Million) By Type (2021-2032)
Figure 38. South America Food Grade Pea Starch Revenue (USD Million) By Application (2021-2032)
Figure 39. South America Food Grade Pea Starch Revenue (USD Million) By Product (2021-2032)
Figure 40. Middle East and Africa Food Grade Pea Starch Revenue (USD Million) By Type (2021-2032)
Figure 41. Middle East and Africa Food Grade Pea Starch Revenue (USD Million) By Application (2021-2032)
Figure 42. Middle East and Africa Food Grade Pea Starch Revenue (USD Million) By Product (2021-2032)
By Type
Organic
Conventional
By Application
Snacks & savory products
Soups & sauces
Meat & poultry products
Confectionery products
Bakery products
Dairy products
Others
Countries Analyzed
North America (US, Canada, Mexico)
Europe (Germany, UK, France, Spain, Italy, Russia, Rest of Europe)
Asia Pacific (China, India, Japan, South Korea, Australia, South East Asia, Rest of Asia)
South America (Brazil, Argentina, Rest of South America)
Middle East and Africa (Saudi Arabia, UAE, Rest of Middle East, South Africa, Egypt, Rest of Africa)
