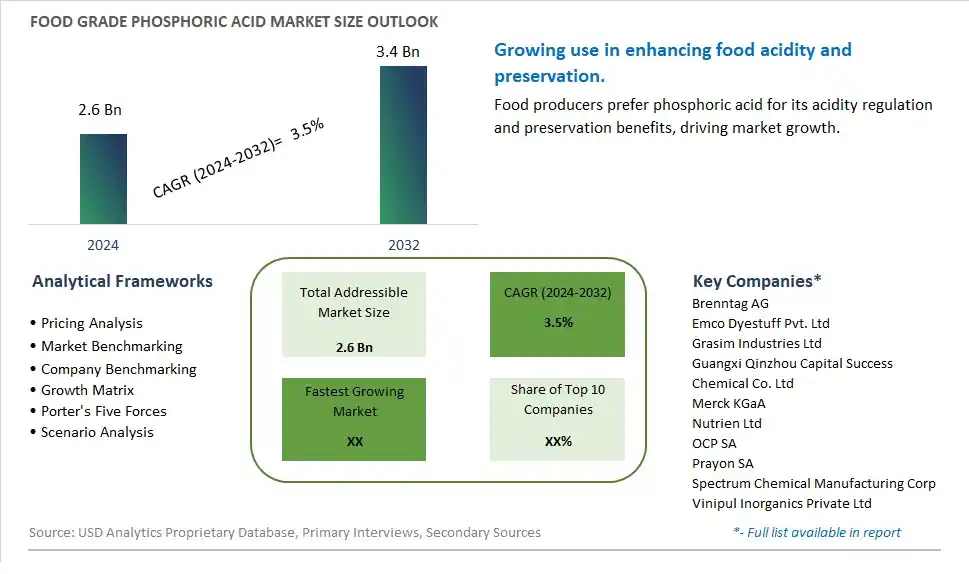
Global Food Grade Phosphoric Acid Market Size is valued at $2.6 Billion in 2024 and is forecast to register a growth rate (CAGR) of 3.5% to reach $3.4 Billion by 2032.
The global Food Grade Phosphoric Acid Market Comprehensive Study analyzes and forecasts the market size across 6 regions and 24 countries for diverse segments -By Product (Food Grade 75%, Food Grade 80%, Food Grade 85%, Others), By Application (Food Preservation, Beverages Production, Metal Treatment, Sugar Refining, Others)
An Introduction to Food Grade Phosphoric Acid Market
In 2024, the Food Grade Phosphoric Acid market is thriving, fueled by the rising demand for acidity regulators and preservatives in the food and beverage industry. Food grade phosphoric acid is used in applications such as carbonated beverages, processed foods, and dairy products to enhance flavor and maintain pH balance. The market benefits from advancements in acid production and purification technologies, the growing trend of convenience and processed foods, and the expansion of the global food and beverage sector. Additionally, the increasing focus on food safety and quality assurance is driving market growth.
Food Grade Phosphoric Acid Competitive Landscape
The market report analyses the leading companies in the industry including Brenntag AG, Emco Dyestuff Pvt. Ltd, Grasim Industries Ltd, Guangxi Qinzhou Capital Success Chemical Co. Ltd, Merck KGaA, Nutrien Ltd, OCP SA, Prayon SA, Spectrum Chemical Manufacturing Corp, Vinipul Inorganics Private Ltd, and Others.
Food Grade Phosphoric Acid Market Dynamics
Food Grade Phosphoric Acid Market Trend: Demand for Acidulants in Food and Beverage Industry
One prominent trend in the food grade phosphoric acid market is the increasing demand for acidulants in the food and beverage industry. Acidulants play a crucial role in food processing by providing acidity, enhancing flavor, extending shelf life, and acting as preservatives. Food grade phosphoric acid, known for its strong acidity, versatility, and compatibility with various food formulations, is witnessing heightened demand as an acidulant in beverages, sauces, condiments, and processed foods. This trend is driven by the need for flavor enhancement, pH adjustment, microbial stability, and product differentiation, leading to the widespread adoption of food grade phosphoric acid in food and beverage applications.
Food Grade Phosphoric Acid Market Driver: Growing Consumption of Carbonated and Non-Alcoholic Beverages
A key driver propelling the food grade phosphoric acid market is the growing consumption of carbonated and non-alcoholic beverages. Phosphoric acid is commonly used as an acidulant and flavoring agent in carbonated drinks such as sodas, colas, and flavored waters. The driver behind this trend is the rising popularity of non-alcoholic beverages as refreshing alternatives, changing consumer preferences towards flavored and functional drinks, and the need for acidity regulators to achieve desired taste profiles. The increasing demand for phosphoric acid in the beverage sector is fueling market growth and driving innovation in beverage formulations.
Food Grade Phosphoric Acid Market Opportunity: Expansion into Functional Food and Nutraceutical Applications
A significant opportunity in the food grade phosphoric acid market lies in the expansion into functional food and nutraceutical applications. Companies can capitalize on this opportunity by developing phosphoric acid-based formulations for functional beverages, sports drinks, vitamin-enhanced waters, and nutraceutical supplements. Phosphoric acid offers acidity for flavor enhancement, along with potential health benefits such as bone health support due to its phosphorus content. By focusing on product development, research into health-promoting properties, and collaboration with manufacturers in the functional food and nutraceutical sectors, companies can tap into the growing market for functional beverages, address consumer wellness trends, and create value-added products that cater to health-conscious consumers.
Food Grade Phosphoric Acid Market Share Analysis: Food Grade 85% segment generated the highest revenue share in the industry
Within the Food Grade Phosphoric Acid market segmentation, Food Grade 85% phosphoric acid emerges as the largest segment. This purity level of phosphoric acid is widely utilized in the food industry for various applications due to its effectiveness and compliance with food safety standards. Food Grade 85% phosphoric acid is commonly used as an acidulant and pH adjuster in food and beverage processing. It plays a crucial role in enhancing flavor profiles, preserving food products, and regulating acidity levels in beverages and processed foods. The demand for Food Grade 85% phosphoric acid is driven by its versatility across different food applications, including dairy products, processed meats, soft drinks, and bakery items, where it contributes to texture improvement and shelf-life extension.
Food Grade Phosphoric Acid Market Share Analysis: Beverages Production is the fastest growing segment over the forecast period to 2032
The Beverages Production segment is expected to be the fastest-growing application segment in the Food Grade Phosphoric Acid market through 2032. Phosphoric acid is a key ingredient in the production of beverages, particularly in carbonated drinks like cola and other soft drinks. It serves as a flavor enhancer and acidity regulator, imparting a tangy taste and providing the characteristic fizziness in carbonated beverages. With the global demand for carbonated and non-carbonated beverages steadily rising, driven by changing consumer preferences and increasing urbanization, the beverages production segment presents significant growth opportunities for Food Grade Phosphoric Acid. Further, phosphoric acid's role in enhancing beverage taste profiles and ensuring product stability aligns with the industry's focus on quality and consistency, further boosting its adoption in beverages production worldwide. Thus, the Beverages Production application segment stands out as a pivotal driver for the growth of Food Grade Phosphoric Acid market in the coming years.
Food Grade Phosphoric Acid Market Segmentation
By Product
Food Grade 75%
Food Grade 80%
Food Grade 85%
Others
By Application
Food Preservation
Beverages Production
Metal Treatment
Sugar Refining
Others
Countries Analyzed
North America (US, Canada, Mexico)
Europe (Germany, UK, France, Spain, Italy, Russia, Rest of Europe)
Asia Pacific (China, India, Japan, South Korea, Australia, South East Asia, Rest of Asia)
South America (Brazil, Argentina, Rest of South America)
Middle East and Africa (Saudi Arabia, UAE, Rest of Middle East, South Africa, Egypt, Rest of Africa)
Food Grade Phosphoric Acid Companies Profiled in the Study
Brenntag AG
Emco Dyestuff Pvt. Ltd
Grasim Industries Ltd
Guangxi Qinzhou Capital Success Chemical Co. Ltd
Merck KGaA
Nutrien Ltd
OCP SA
Prayon SA
Spectrum Chemical Manufacturing Corp
Vinipul Inorganics Private Ltd
*- List Not Exhaustive
Chapter 1. TABLE OF CONTENTS
Chapter 2. Introduction to Food Grade Phosphoric Acid Market
2.1. Market Overview
2.2. Key Statistics and Report Highlights
2.3. Scope of the Comprehensive Study
2.3.1. Market Definition
2.3.2 Countries and Regions Covered
2.3.3 Research Objective
2.3.4 Units, Currency, and Conversions
2.3.5 Industry Value Chain
2.4. Key Market Segments
2.5. Key Companies
2.6. Study Period
Chapter 3. Strategic Analysis Review
3.1. Food Grade Phosphoric Acid Pricing Analysis and Forecast
3.2. Porter’s Five Forces
3.3. Market Ecosystem
3.4. SWOT Analysis
3.5. Regulatory Scenario
3.3. Effects of Inflation, Russia-Ukraine War, moderating economic growth, and other macroeconomic factors
Chapter 4. Competitive Landscape
4.1. Market Share Analysis
4.1.1. Global Food Grade Phosphoric Acid Market Share by Company, 2023
4.1.2. Product Offerings of Leading Food Grade Phosphoric Acid Companies
4.2. Market Entropy
4.2.1. New Product Launches in the Industry
4.2.2. Mergers, Acquisitions, Joint ventures, and Partnerships
4.3. Key Strategies and Best Practices
Chapter 5. Global Market Projections: Best, Reference, and Low Case Scenarios
5.1. Growth Analysis- Case Scenario Definitions
5.2. Low Growth Case Scenario Forecasts
5.3. Reference Growth Case Scenario Forecasts
5.4. High Growth Case Scenario Forecasts
Chapter 6. Market Dynamics
6.1. Food Grade Phosphoric Acid Market Drivers
6.2. Food Grade Phosphoric Acid Market Challenges
6.6. Food Grade Phosphoric Acid Market Opportunities
6.4. Food Grade Phosphoric Acid Market Trends
Chapter 7. Global Food Grade Phosphoric Acid Market Outlook Trends
7.1. Global Food Grade Phosphoric Acid Revenue (USD Million) and CAGR (%) by Type (2021-2032)
7.2. Global Food Grade Phosphoric Acid Revenue (USD Million) and CAGR (%) by Application (2021-2032)
7.3. Global Food Grade Phosphoric Acid Revenue (USD Million) and CAGR (%) by Product (2021-2032)
By Product
Food Grade 75%
Food Grade 80%
Food Grade 85%
Others
By Application
Food Preservation
Beverages Production
Metal Treatment
Sugar Refining
Others
Chapter 8. Global Food Grade Phosphoric Acid Regional Analysis and Outlook
8.1. Global Food Grade Phosphoric Acid Revenue (USD Million) By Regions (2021- 2032)
8.2. North America Food Grade Phosphoric Acid Revenue (USD Million) by Country (2021-2032)
8.2.1. United States Food Grade Phosphoric Acid Regional Analysis and Outlook
8.2.2. Canada Food Grade Phosphoric Acid Regional Analysis and Outlook
8.2.3. Mexico Food Grade Phosphoric Acid Regional Analysis and Outlook
8.3. Europe Food Grade Phosphoric Acid Revenue (USD Million), by Country (2021-2032)
8.3.1. Germany Food Grade Phosphoric Acid Regional Analysis and Outlook
8.3.2. France Food Grade Phosphoric Acid Regional Analysis and Outlook
8.3.3. United Kingdom Food Grade Phosphoric Acid Regional Analysis and Outlook
8.3.4. Spain Food Grade Phosphoric Acid Regional Analysis and Outlook
8.3.5. Italy Food Grade Phosphoric Acid Regional Analysis and Outlook
8.3.6. Russia Food Grade Phosphoric Acid Regional Analysis and Outlook
8.3.7. Rest of Europe Food Grade Phosphoric Acid Regional Analysis and Outlook
8.4. Asia Pacific Food Grade Phosphoric Acid Revenue (USD Million) by Country (2021-2032)
8.4.1. China Food Grade Phosphoric Acid Regional Analysis and Outlook
8.4.2. Japan Food Grade Phosphoric Acid Regional Analysis and Outlook
8.4.3. India Food Grade Phosphoric Acid Regional Analysis and Outlook
8.4.4. South Korea Food Grade Phosphoric Acid Regional Analysis and Outlook
8.4.5. Australia Food Grade Phosphoric Acid Regional Analysis and Outlook
8.4.6. South East Asia Food Grade Phosphoric Acid Regional Analysis and Outlook
8.4.7. Rest of Asia Pacific Food Grade Phosphoric Acid Regional Analysis and Outlook
8.5. South America Food Grade Phosphoric Acid Revenue (USD Million), by Country (2021-2032)
8.5.1. Brazil Food Grade Phosphoric Acid Regional Analysis and Outlook
8.5.2. Argentina Food Grade Phosphoric Acid Regional Analysis and Outlook
8.5.3. Rest of South America Food Grade Phosphoric Acid Regional Analysis and Outlook
8.6. Middle East and Africa Food Grade Phosphoric Acid Revenue (USD Million) by Country (2021-2032)
8.6.1. Middle East Food Grade Phosphoric Acid Regional Analysis and Outlook
8.6.2. Africa Food Grade Phosphoric Acid Regional Analysis and Outlook
Chapter 9. North America Food Grade Phosphoric Acid Analysis and Outlook
9.1. North America Food Grade Phosphoric Acid Revenue (USD Million) by Segments (2021-2032)
9.1.1. North America Food Grade Phosphoric Acid Revenue (USD Million) by Type (2021-2032)
9.1.2. North America Food Grade Phosphoric Acid Revenue (USD Million) by Application (2021-2032)
9.1.3. North America Food Grade Phosphoric Acid Revenue (USD Million) by Product (2021-2032)
By Product
Food Grade 75%
Food Grade 80%
Food Grade 85%
Others
By Application
Food Preservation
Beverages Production
Metal Treatment
Sugar Refining
Others
Chapter 10. Europe Food Grade Phosphoric Acid Analysis and Outlook
10.1. Europe Food Grade Phosphoric Acid Revenue (USD Million), by Segments (USD Million) (2021-2032)
10.1.1. Europe Food Grade Phosphoric Acid Revenue (USD Million) by Type (2021-2032)
10.1.2. Europe Food Grade Phosphoric Acid Revenue (USD Million) by Application (2021-2032)
10.1.3. Europe Food Grade Phosphoric Acid Revenue (USD Million) by Product (2021-2032)
By Product
Food Grade 75%
Food Grade 80%
Food Grade 85%
Others
By Application
Food Preservation
Beverages Production
Metal Treatment
Sugar Refining
Others
Chapter 11. Asia Pacific Food Grade Phosphoric Acid Analysis and Outlook
11.1. Asia Pacific Food Grade Phosphoric Acid Revenue (USD Million), and Revenue (USD Million) by Segments (2021-2032)
11.1.1. Asia Pacific Food Grade Phosphoric Acid Revenue (USD Million) by Type (2021-2032)
11.1.2. Asia Pacific Food Grade Phosphoric Acid Revenue (USD Million) by Application (2021-2032)
11.1.3. Asia Pacific Food Grade Phosphoric Acid Revenue (USD Million) by Product (2021-2032)
By Product
Food Grade 75%
Food Grade 80%
Food Grade 85%
Others
By Application
Food Preservation
Beverages Production
Metal Treatment
Sugar Refining
Others
Chapter 12. South America Food Grade Phosphoric Acid Analysis and Outlook
12.1. South America Food Grade Phosphoric Acid Revenue (USD Million), by Segments (2021-2032)
12.1.1. South America Food Grade Phosphoric Acid Revenue (USD Million) by Type (2021-2032)
12.1.2. South America Food Grade Phosphoric Acid Revenue (USD Million) by Application (2021-2032)
12.1.3. South America Food Grade Phosphoric Acid Revenue (USD Million) by Product (2021-2032)
By Product
Food Grade 75%
Food Grade 80%
Food Grade 85%
Others
By Application
Food Preservation
Beverages Production
Metal Treatment
Sugar Refining
Others
Chapter 13. Middle East and Africa Food Grade Phosphoric Acid Analysis and Outlook
13.1. Middle East and Africa Food Grade Phosphoric Acid Revenue (USD Million), by Segments (2021-2032)
13.1.1. Middle East and Africa Food Grade Phosphoric Acid Revenue (USD Million) by Type (2021-2032)
13.1.2. Middle East and Africa Food Grade Phosphoric Acid Revenue (USD Million) by Application (2021-2032)
13.1.3. Middle East and Africa Food Grade Phosphoric Acid Revenue (USD Million) by Product (2021-2032)
By Product
Food Grade 75%
Food Grade 80%
Food Grade 85%
Others
By Application
Food Preservation
Beverages Production
Metal Treatment
Sugar Refining
Others
Chapter 14. Food Grade Phosphoric Acid Company Profiles
14.1 Business Overview
14.2 Product Profiles
14.3 SWOT Profiles
14.5 Recent Developments
14.6 Financial Profile
List of Companies
Brenntag AG
Emco Dyestuff Pvt. Ltd
Grasim Industries Ltd
Guangxi Qinzhou Capital Success Chemical Co. Ltd
Merck KGaA
Nutrien Ltd
OCP SA
Prayon SA
Spectrum Chemical Manufacturing Corp
Vinipul Inorganics Private Ltd
15. Methodology and Data Sources
15.1 Customization Offerings
15.2 Subscription Services
15.3 Related Reports
15.4 Publisher Expertise
LIST OF TABLES
Table 1 Market Segmentation Analysis
Table 2 Global Food Grade Phosphoric Acid Market Share of Leading Companies, 2023
Table 3 Product Offerings of Leading Companies
Table 4 Low Growth Scenario Forecasts
Table 5 Reference Case Growth Scenario
Table 6 High Growth Case Scenario
Table 7 Global Food Grade Phosphoric Acid Revenue (USD Million) And CAGR (%) By Type (2021-2032)
Table 8 Global Food Grade Phosphoric Acid Revenue (USD Million) And CAGR (%) By Application (2021-2032)
Table 9 Global Food Grade Phosphoric Acid Revenue (USD Million) And CAGR (%) By Product (2021-2032)
Table 10 Global Food Grade Phosphoric Acid Market Revenue (USD Million) By Regions (2021-2032)
Table 11 Global Food Grade Phosphoric Acid Market Share (%) By Regions (2021-2032)
Table 12 North America Food Grade Phosphoric Acid Revenue (USD Million) By Country (2021-2032)
Table 13 Europe Food Grade Phosphoric Acid Revenue (USD Million) By Country (2021-2032)
Table 14 Asia Pacific Food Grade Phosphoric Acid Revenue (USD Million) By Country (2021-2032)
Table 15 South America Food Grade Phosphoric Acid Revenue (USD Million) By Country (2021-2032)
Table 16 Middle East and Africa Food Grade Phosphoric Acid Revenue (USD Million) By Region (2021-2032)
Table 17 North America Food Grade Phosphoric Acid Revenue (USD Million) By Type (2021-2032)
Table 18 North America Food Grade Phosphoric Acid Revenue (USD Million) By Application (2021-2032)
Table 19 North America Food Grade Phosphoric Acid Revenue (USD Million) By Product (2021-2032)
Table 20 Europe Food Grade Phosphoric Acid Revenue (USD Million) By Type (2021-2032)
Table 21 Europe Food Grade Phosphoric Acid Revenue (USD Million) By Application (2021-2032)
Table 22 Europe Food Grade Phosphoric Acid Revenue (USD Million) By Product (2021-2032)
Table 23 Asia Pacific Food Grade Phosphoric Acid Revenue (USD Million) By Type (2021-2032)
Table 24 Asia Pacific Food Grade Phosphoric Acid Revenue (USD Million) By Application (2021-2032)
Table 25 Asia Pacific Food Grade Phosphoric Acid Revenue (USD Million) By Product (2021-2032)
Table 26 South America Food Grade Phosphoric Acid Revenue (USD Million) By Type (2021-2032)
Table 27 South America Food Grade Phosphoric Acid Revenue (USD Million) By Application (2021-2032)
Table 28 South America Food Grade Phosphoric Acid Revenue (USD Million) By Product (2021-2032)
Table 29 Middle East and Africa Food Grade Phosphoric Acid Revenue (USD Million) By Type (2021-2032)
Table 30 Middle East and Africa Food Grade Phosphoric Acid Revenue (USD Million) By Application (2021-2032)
Table 31 Middle East and Africa Food Grade Phosphoric Acid Revenue (USD Million) By Product (2021-2032)
LIST OF FIGURES
Figure 1. Market Scope
Figure 2. Pricing Forecasts Per Unit, 2023- 2032
Figure 3. Porter’s Five Forces
Figure 4. Global Food Grade Phosphoric Acid Market Revenue (USD Million) By Regions (2021-2032)
Figure 5. Global Food Grade Phosphoric Acid Market Share (%) By Regions (2023)
Figure 6. North America Food Grade Phosphoric Acid Revenue (USD Million) By Country (2021-2032)
Figure 7. United States Food Grade Phosphoric Acid Revenue (USD Million) By Country (2021-2032)
Figure 8. Canada Food Grade Phosphoric Acid Revenue (USD Million) By Country (2021-2032)
Figure 9. Mexico Food Grade Phosphoric Acid Revenue (USD Million) By Country (2021-2032)
Figure 10. Europe Food Grade Phosphoric Acid Revenue (USD Million) By Country (2021-2032)
Figure 11. Germany Food Grade Phosphoric Acid Revenue (USD Million) By Country (2021-2032)
Figure 12. France Food Grade Phosphoric Acid Revenue (USD Million) By Country (2021-2032)
Figure 13. United Kingdom Food Grade Phosphoric Acid Revenue (USD Million) By Country (2021-2032)
Figure 14. Spain Food Grade Phosphoric Acid Revenue (USD Million) By Country (2021-2032)
Figure 15. Italy Food Grade Phosphoric Acid Revenue (USD Million) By Country (2021-2032)
Figure 16. Russia Food Grade Phosphoric Acid Revenue (USD Million) By Country (2021-2032)
Figure 17. Rest of Europe Food Grade Phosphoric Acid Revenue (USD Million) By Country (2021-2032)
Figure 11. Asia Pacific Food Grade Phosphoric Acid Revenue (USD Million) By Country (2021-2032)
Figure 12. China Food Grade Phosphoric Acid Revenue (USD Million) By Country (2021-2032)
Figure 13. Japan Food Grade Phosphoric Acid Revenue (USD Million) By Country (2021-2032)
Figure 14. India Food Grade Phosphoric Acid Revenue (USD Million) By Country (2021-2032)
Figure 15. South Korea Food Grade Phosphoric Acid Revenue (USD Million) By Country (2021-2032)
Figure 16. Australia Food Grade Phosphoric Acid Revenue (USD Million) By Country (2021-2032)
Figure 17. South East Asia Food Grade Phosphoric Acid Revenue (USD Million) By Country (2021-2032)
Figure 18. South America Food Grade Phosphoric Acid Revenue (USD Million) By Country (2021-2032)
Figure 19. Brazil Food Grade Phosphoric Acid Revenue (USD Million) By Country (2021-2032)
Figure 20. Argentina Food Grade Phosphoric Acid Revenue (USD Million) By Country (2021-2032)
Figure 21. Rest of Asia Pacific Food Grade Phosphoric Acid Revenue (USD Million) By Country (2021-2032)
Figure 22. Middle East and Africa Food Grade Phosphoric Acid Revenue (USD Million) By Region (2021-2032)
Figure 23. Saudi Arabia Food Grade Phosphoric Acid Revenue (USD Million) By Region (2021-2032)
Figure 24. The UAE Food Grade Phosphoric Acid Revenue (USD Million) By Region (2021-2032)
Figure 25. Rest of Middle East Food Grade Phosphoric Acid Revenue (USD Million) By Region (2021-2032)
Figure 26. South Africa Food Grade Phosphoric Acid Revenue (USD Million) By Region (2021-2032)
Figure 27. Africa Food Grade Phosphoric Acid Revenue (USD Million) By Region (2021-2032)
Figure 28. North America Food Grade Phosphoric Acid Revenue (USD Million) By Type (2021-2032)
Figure 29. North America Food Grade Phosphoric Acid Revenue (USD Million) By Application (2021-2032)
Figure 30. North America Food Grade Phosphoric Acid Revenue (USD Million) By Product (2021-2032)
Figure 31. Europe Food Grade Phosphoric Acid Revenue (USD Million) By Type (2021-2032)
Figure 32. Europe Food Grade Phosphoric Acid Revenue (USD Million) By Application (2021-2032)
Figure 33. Europe Food Grade Phosphoric Acid Revenue (USD Million) By Product (2021-2032)
Figure 34. Asia Pacific Food Grade Phosphoric Acid Revenue (USD Million) By Type (2021-2032)
Figure 35. Asia Pacific Food Grade Phosphoric Acid Revenue (USD Million) By Application (2021-2032)
Figure 36. Asia Pacific Food Grade Phosphoric Acid Revenue (USD Million) By Product (2021-2032)
Figure 37. South America Food Grade Phosphoric Acid Revenue (USD Million) By Type (2021-2032)
Figure 38. South America Food Grade Phosphoric Acid Revenue (USD Million) By Application (2021-2032)
Figure 39. South America Food Grade Phosphoric Acid Revenue (USD Million) By Product (2021-2032)
Figure 40. Middle East and Africa Food Grade Phosphoric Acid Revenue (USD Million) By Type (2021-2032)
Figure 41. Middle East and Africa Food Grade Phosphoric Acid Revenue (USD Million) By Application (2021-2032)
Figure 42. Middle East and Africa Food Grade Phosphoric Acid Revenue (USD Million) By Product (2021-2032)
By Product
Food Grade 75%
Food Grade 80%
Food Grade 85%
Others
By Application
Food Preservation
Beverages Production
Metal Treatment
Sugar Refining
Others
Countries Analyzed
North America (US, Canada, Mexico)
Europe (Germany, UK, France, Spain, Italy, Russia, Rest of Europe)
Asia Pacific (China, India, Japan, South Korea, Australia, South East Asia, Rest of Asia)
South America (Brazil, Argentina, Rest of South America)
Middle East and Africa (Saudi Arabia, UAE, Rest of Middle East, South Africa, Egypt, Rest of Africa)
