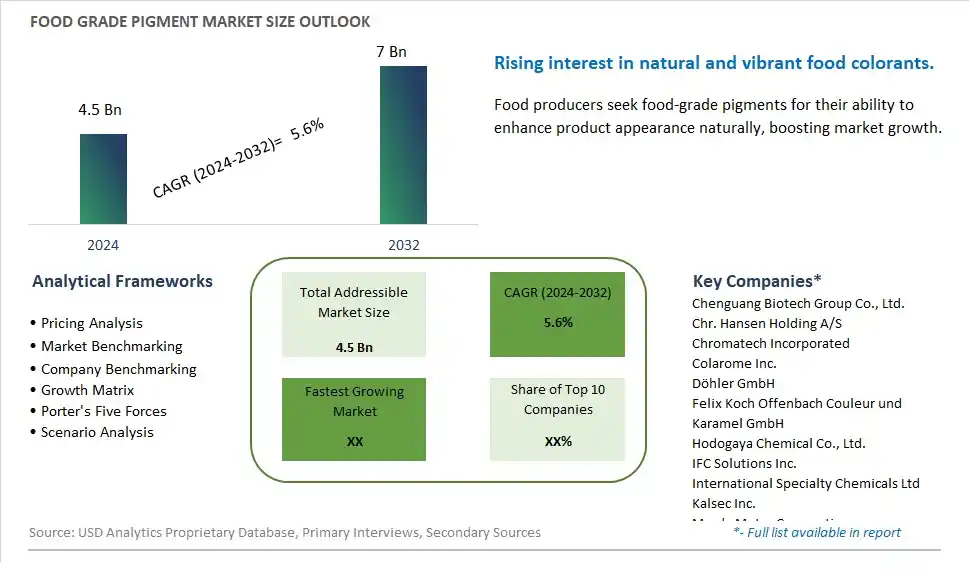
Global Food Grade Pigment Market Size is valued at $4.5 Billion in 2024 and is forecast to register a growth rate (CAGR) of 5.6% to reach $7 Billion by 2032.
The global Food Grade Pigment Market Comprehensive Study analyzes and forecasts the market size across 6 regions and 24 countries for diverse segments -By Type (Powder, Granular, Others), By Application (Food, Medicine, Cosmetics, Others)
An Introduction to Food Grade Pigment Market
The Food Grade Pigment market in 2024 is witnessing robust growth, driven by the increasing demand for natural and vibrant colorants in food and beverage products. Food grade pigments, derived from natural sources such as fruits, vegetables, and minerals, are used to enhance the visual appeal of products while maintaining clean label standards. The market benefits from advancements in pigment extraction and stabilization technologies, the growing trend of natural and organic foods, and the expansion of the functional and specialty food sectors. Additionally, the rising consumer preference for natural over synthetic colorants is contributing to market growth.
Food Grade Pigment Competitive Landscape
The market report analyses the leading companies in the industry including Chenguang Biotech Group Co., Ltd., Chr. Hansen Holding A/S, Chromatech Incorporated, Colarome Inc., Döhler GmbH, Felix Koch Offenbach Couleur und Karamel GmbH, Hodogaya Chemical Co., Ltd., IFC Solutions Inc., International Specialty Chemicals Ltd, Kalsec Inc., Mazda Motor Corporation, Merck KGaA, Naturex SA, Palsgaard A/S, Pantai Chemical USA Inc., Rung International, San-Ei Gen F.F.I., Inc., Sensient Technologies Corporation, Sethness Roquette Frères, Synthite Industries Ltd, Viveri, Yunnan Rainbow Biotech Co., Ltd., Zhongda Hengyuan, and Others.
Food Grade Pigment Market Dynamics
Food Grade Pigment Market Trend: Shift Towards Natural and Clean Label Ingredients
One prominent trend in the food grade pigment market is the shift towards natural and clean label ingredients. As consumers become more conscious about their health and the ingredients in their food, there is a growing preference for natural colorants derived from plant, fruit, and vegetable sources. Food grade pigments, known for their vibrant colors, stability, and safety, are being increasingly utilized as natural alternatives to synthetic food colors. This trend is driven by the demand for clean label products, transparency in ingredient sourcing, and regulatory scrutiny on artificial additives, leading to the adoption of food grade pigments to meet consumer expectations for natural and authentic food experiences.
Food Grade Pigment Market Driver: Regulatory Restrictions on Synthetic Food Colors
A key driver propelling the food grade pigment market is the regulatory restrictions on synthetic food colors. Regulatory agencies and health authorities globally are imposing stricter regulations on the use of synthetic colorants due to potential health concerns and consumer preferences for natural ingredients. Food grade pigments, being naturally sourced and compliant with regulatory standards, offer a viable solution for food manufacturers seeking alternatives to synthetic colors. The driver behind this trend is the regulatory pressure to reduce artificial additives, consumer demand for safer and healthier food options, and the need for ingredient innovation in response to regulatory changes, driving the demand for food grade pigments as natural colorants in food and beverage applications.
Food Grade Pigment Market Opportunity: Development of Customized Color Solutions and Formulations
A significant opportunity in the food grade pigment market lies in the development of customized color solutions and formulations. Companies can capitalize on this opportunity by offering a range of food grade pigments in different shades, hues, and intensities to meet diverse customer needs. Additionally, there's potential for developing pigment blends, encapsulated pigments for controlled release, and stable color formulations for various food and beverage products. By focusing on innovation, collaboration with food manufacturers for product customization, and marketing strategies that highlight the natural and vibrant attributes of food grade pigments, companies can tap into the growing market for natural colorants, address regulatory requirements, and meet consumer preferences for clean label ingredients in food products.
Food Grade Pigment Market Share Analysis: Powder segment generated the highest revenue share in the industry
In the Food Grade Pigment market, the Powder segment stands out as the largest category. Powdered food-grade pigments are extensively used across various food applications due to their versatility, ease of incorporation, and ability to provide vibrant colors to food products without altering their texture or taste significantly. Powder pigments are commonly employed in confectionery, bakery, dairy, and beverage industries to enhance visual appeal and consumer attractiveness. They are preferred for their stable color characteristics and suitability for a wide range of food formulations, from solid to liquid products. The Powder segment's dominance underscores its essential role in meeting consumer demand for visually appealing and attractive food products across global markets.
Food Grade Pigment Market Share Analysis: Cosmetics is the fastest growing segment over the forecast period to 2032
The Cosmetics application segment is poised to experience the fastest growth in the Food Grade Pigment market through 2032. Pigments used in cosmetics play a crucial role in enhancing the aesthetic appeal and functionality of various cosmetic products, including lipsticks, eyeshadows, foundations, and skincare formulations. Consumers increasingly prioritize cosmetic products that offer vibrant and long-lasting color effects, driving the demand for high-quality pigments in the cosmetics industry. Food Grade Pigments, known for their safety and regulatory compliance, are gaining traction as preferred ingredients in cosmetic formulations worldwide. As the cosmetics market expands, fueled by evolving beauty trends and rising disposable incomes, the demand for pigments that meet stringent safety standards and offer superior color performance is expected to surge, positioning the Cosmetics application segment as a key growth driver in the Food Grade Pigment market.
Food Grade Pigment Market Segmentation
By Type
Powder
Granular
Others
By Application
Food
Medicine
Cosmetics
Others
Countries Analyzed
North America (US, Canada, Mexico)
Europe (Germany, UK, France, Spain, Italy, Russia, Rest of Europe)
Asia Pacific (China, India, Japan, South Korea, Australia, South East Asia, Rest of Asia)
South America (Brazil, Argentina, Rest of South America)
Middle East and Africa (Saudi Arabia, UAE, Rest of Middle East, South Africa, Egypt, Rest of Africa)
Food Grade Pigment Companies Profiled in the Study
Chenguang Biotech Group Co., Ltd.
Chr. Hansen Holding A/S
Chromatech Incorporated
Colarome Inc.
Döhler GmbH
Felix Koch Offenbach Couleur und Karamel GmbH
Hodogaya Chemical Co., Ltd.
IFC Solutions Inc.
International Specialty Chemicals Ltd
Kalsec Inc.
Mazda Motor Corporation
Merck KGaA
Naturex SA
Palsgaard A/S
Pantai Chemical USA Inc.
Rung International
San-Ei Gen F.F.I., Inc.
Sensient Technologies Corporation
Sethness Roquette Frères
Synthite Industries Ltd
Viveri
Yunnan Rainbow Biotech Co., Ltd.
Zhongda Hengyuan
*- List Not Exhaustive
Chapter 1. TABLE OF CONTENTS
Chapter 2. Introduction to Food Grade Pigment Market
2.1. Market Overview
2.2. Key Statistics and Report Highlights
2.3. Scope of the Comprehensive Study
2.3.1. Market Definition
2.3.2 Countries and Regions Covered
2.3.3 Research Objective
2.3.4 Units, Currency, and Conversions
2.3.5 Industry Value Chain
2.4. Key Market Segments
2.5. Key Companies
2.6. Study Period
Chapter 3. Strategic Analysis Review
3.1. Food Grade Pigment Pricing Analysis and Forecast
3.2. Porter’s Five Forces
3.3. Market Ecosystem
3.4. SWOT Analysis
3.5. Regulatory Scenario
3.3. Effects of Inflation, Russia-Ukraine War, moderating economic growth, and other macroeconomic factors
Chapter 4. Competitive Landscape
4.1. Market Share Analysis
4.1.1. Global Food Grade Pigment Market Share by Company, 2023
4.1.2. Product Offerings of Leading Food Grade Pigment Companies
4.2. Market Entropy
4.2.1. New Product Launches in the Industry
4.2.2. Mergers, Acquisitions, Joint ventures, and Partnerships
4.3. Key Strategies and Best Practices
Chapter 5. Global Market Projections: Best, Reference, and Low Case Scenarios
5.1. Growth Analysis- Case Scenario Definitions
5.2. Low Growth Case Scenario Forecasts
5.3. Reference Growth Case Scenario Forecasts
5.4. High Growth Case Scenario Forecasts
Chapter 6. Market Dynamics
6.1. Food Grade Pigment Market Drivers
6.2. Food Grade Pigment Market Challenges
6.6. Food Grade Pigment Market Opportunities
6.4. Food Grade Pigment Market Trends
Chapter 7. Global Food Grade Pigment Market Outlook Trends
7.1. Global Food Grade Pigment Revenue (USD Million) and CAGR (%) by Type (2021-2032)
7.2. Global Food Grade Pigment Revenue (USD Million) and CAGR (%) by Application (2021-2032)
7.3. Global Food Grade Pigment Revenue (USD Million) and CAGR (%) by Product (2021-2032)
By Type
Powder
Granular
Others
By Application
Food
Medicine
Cosmetics
Others
Chapter 8. Global Food Grade Pigment Regional Analysis and Outlook
8.1. Global Food Grade Pigment Revenue (USD Million) By Regions (2021- 2032)
8.2. North America Food Grade Pigment Revenue (USD Million) by Country (2021-2032)
8.2.1. United States Food Grade Pigment Regional Analysis and Outlook
8.2.2. Canada Food Grade Pigment Regional Analysis and Outlook
8.2.3. Mexico Food Grade Pigment Regional Analysis and Outlook
8.3. Europe Food Grade Pigment Revenue (USD Million), by Country (2021-2032)
8.3.1. Germany Food Grade Pigment Regional Analysis and Outlook
8.3.2. France Food Grade Pigment Regional Analysis and Outlook
8.3.3. United Kingdom Food Grade Pigment Regional Analysis and Outlook
8.3.4. Spain Food Grade Pigment Regional Analysis and Outlook
8.3.5. Italy Food Grade Pigment Regional Analysis and Outlook
8.3.6. Russia Food Grade Pigment Regional Analysis and Outlook
8.3.7. Rest of Europe Food Grade Pigment Regional Analysis and Outlook
8.4. Asia Pacific Food Grade Pigment Revenue (USD Million) by Country (2021-2032)
8.4.1. China Food Grade Pigment Regional Analysis and Outlook
8.4.2. Japan Food Grade Pigment Regional Analysis and Outlook
8.4.3. India Food Grade Pigment Regional Analysis and Outlook
8.4.4. South Korea Food Grade Pigment Regional Analysis and Outlook
8.4.5. Australia Food Grade Pigment Regional Analysis and Outlook
8.4.6. South East Asia Food Grade Pigment Regional Analysis and Outlook
8.4.7. Rest of Asia Pacific Food Grade Pigment Regional Analysis and Outlook
8.5. South America Food Grade Pigment Revenue (USD Million), by Country (2021-2032)
8.5.1. Brazil Food Grade Pigment Regional Analysis and Outlook
8.5.2. Argentina Food Grade Pigment Regional Analysis and Outlook
8.5.3. Rest of South America Food Grade Pigment Regional Analysis and Outlook
8.6. Middle East and Africa Food Grade Pigment Revenue (USD Million) by Country (2021-2032)
8.6.1. Middle East Food Grade Pigment Regional Analysis and Outlook
8.6.2. Africa Food Grade Pigment Regional Analysis and Outlook
Chapter 9. North America Food Grade Pigment Analysis and Outlook
9.1. North America Food Grade Pigment Revenue (USD Million) by Segments (2021-2032)
9.1.1. North America Food Grade Pigment Revenue (USD Million) by Type (2021-2032)
9.1.2. North America Food Grade Pigment Revenue (USD Million) by Application (2021-2032)
9.1.3. North America Food Grade Pigment Revenue (USD Million) by Product (2021-2032)
By Type
Powder
Granular
Others
By Application
Food
Medicine
Cosmetics
Others
Chapter 10. Europe Food Grade Pigment Analysis and Outlook
10.1. Europe Food Grade Pigment Revenue (USD Million), by Segments (USD Million) (2021-2032)
10.1.1. Europe Food Grade Pigment Revenue (USD Million) by Type (2021-2032)
10.1.2. Europe Food Grade Pigment Revenue (USD Million) by Application (2021-2032)
10.1.3. Europe Food Grade Pigment Revenue (USD Million) by Product (2021-2032)
By Type
Powder
Granular
Others
By Application
Food
Medicine
Cosmetics
Others
Chapter 11. Asia Pacific Food Grade Pigment Analysis and Outlook
11.1. Asia Pacific Food Grade Pigment Revenue (USD Million), and Revenue (USD Million) by Segments (2021-2032)
11.1.1. Asia Pacific Food Grade Pigment Revenue (USD Million) by Type (2021-2032)
11.1.2. Asia Pacific Food Grade Pigment Revenue (USD Million) by Application (2021-2032)
11.1.3. Asia Pacific Food Grade Pigment Revenue (USD Million) by Product (2021-2032)
By Type
Powder
Granular
Others
By Application
Food
Medicine
Cosmetics
Others
Chapter 12. South America Food Grade Pigment Analysis and Outlook
12.1. South America Food Grade Pigment Revenue (USD Million), by Segments (2021-2032)
12.1.1. South America Food Grade Pigment Revenue (USD Million) by Type (2021-2032)
12.1.2. South America Food Grade Pigment Revenue (USD Million) by Application (2021-2032)
12.1.3. South America Food Grade Pigment Revenue (USD Million) by Product (2021-2032)
By Type
Powder
Granular
Others
By Application
Food
Medicine
Cosmetics
Others
Chapter 13. Middle East and Africa Food Grade Pigment Analysis and Outlook
13.1. Middle East and Africa Food Grade Pigment Revenue (USD Million), by Segments (2021-2032)
13.1.1. Middle East and Africa Food Grade Pigment Revenue (USD Million) by Type (2021-2032)
13.1.2. Middle East and Africa Food Grade Pigment Revenue (USD Million) by Application (2021-2032)
13.1.3. Middle East and Africa Food Grade Pigment Revenue (USD Million) by Product (2021-2032)
By Type
Powder
Granular
Others
By Application
Food
Medicine
Cosmetics
Others
Chapter 14. Food Grade Pigment Company Profiles
14.1 Business Overview
14.2 Product Profiles
14.3 SWOT Profiles
14.5 Recent Developments
14.6 Financial Profile
List of Companies
Chenguang Biotech Group Co., Ltd.
Chr. Hansen Holding A/S
Chromatech Incorporated
Colarome Inc.
Döhler GmbH
Felix Koch Offenbach Couleur und Karamel GmbH
Hodogaya Chemical Co., Ltd.
IFC Solutions Inc.
International Specialty Chemicals Ltd
Kalsec Inc.
Mazda Motor Corporation
Merck KGaA
Naturex SA
Palsgaard A/S
Pantai Chemical USA Inc.
Rung International
San-Ei Gen F.F.I., Inc.
Sensient Technologies Corporation
Sethness Roquette Frères
Synthite Industries Ltd
Viveri
Yunnan Rainbow Biotech Co., Ltd.
Zhongda Hengyuan
15. Methodology and Data Sources
15.1 Customization Offerings
15.2 Subscription Services
15.3 Related Reports
15.4 Publisher Expertise
LIST OF TABLES
Table 1 Market Segmentation Analysis
Table 2 Global Food Grade Pigment Market Share of Leading Companies, 2023
Table 3 Product Offerings of Leading Companies
Table 4 Low Growth Scenario Forecasts
Table 5 Reference Case Growth Scenario
Table 6 High Growth Case Scenario
Table 7 Global Food Grade Pigment Revenue (USD Million) And CAGR (%) By Type (2021-2032)
Table 8 Global Food Grade Pigment Revenue (USD Million) And CAGR (%) By Application (2021-2032)
Table 9 Global Food Grade Pigment Revenue (USD Million) And CAGR (%) By Product (2021-2032)
Table 10 Global Food Grade Pigment Market Revenue (USD Million) By Regions (2021-2032)
Table 11 Global Food Grade Pigment Market Share (%) By Regions (2021-2032)
Table 12 North America Food Grade Pigment Revenue (USD Million) By Country (2021-2032)
Table 13 Europe Food Grade Pigment Revenue (USD Million) By Country (2021-2032)
Table 14 Asia Pacific Food Grade Pigment Revenue (USD Million) By Country (2021-2032)
Table 15 South America Food Grade Pigment Revenue (USD Million) By Country (2021-2032)
Table 16 Middle East and Africa Food Grade Pigment Revenue (USD Million) By Region (2021-2032)
Table 17 North America Food Grade Pigment Revenue (USD Million) By Type (2021-2032)
Table 18 North America Food Grade Pigment Revenue (USD Million) By Application (2021-2032)
Table 19 North America Food Grade Pigment Revenue (USD Million) By Product (2021-2032)
Table 20 Europe Food Grade Pigment Revenue (USD Million) By Type (2021-2032)
Table 21 Europe Food Grade Pigment Revenue (USD Million) By Application (2021-2032)
Table 22 Europe Food Grade Pigment Revenue (USD Million) By Product (2021-2032)
Table 23 Asia Pacific Food Grade Pigment Revenue (USD Million) By Type (2021-2032)
Table 24 Asia Pacific Food Grade Pigment Revenue (USD Million) By Application (2021-2032)
Table 25 Asia Pacific Food Grade Pigment Revenue (USD Million) By Product (2021-2032)
Table 26 South America Food Grade Pigment Revenue (USD Million) By Type (2021-2032)
Table 27 South America Food Grade Pigment Revenue (USD Million) By Application (2021-2032)
Table 28 South America Food Grade Pigment Revenue (USD Million) By Product (2021-2032)
Table 29 Middle East and Africa Food Grade Pigment Revenue (USD Million) By Type (2021-2032)
Table 30 Middle East and Africa Food Grade Pigment Revenue (USD Million) By Application (2021-2032)
Table 31 Middle East and Africa Food Grade Pigment Revenue (USD Million) By Product (2021-2032)
LIST OF FIGURES
Figure 1. Market Scope
Figure 2. Pricing Forecasts Per Unit, 2023- 2032
Figure 3. Porter’s Five Forces
Figure 4. Global Food Grade Pigment Market Revenue (USD Million) By Regions (2021-2032)
Figure 5. Global Food Grade Pigment Market Share (%) By Regions (2023)
Figure 6. North America Food Grade Pigment Revenue (USD Million) By Country (2021-2032)
Figure 7. United States Food Grade Pigment Revenue (USD Million) By Country (2021-2032)
Figure 8. Canada Food Grade Pigment Revenue (USD Million) By Country (2021-2032)
Figure 9. Mexico Food Grade Pigment Revenue (USD Million) By Country (2021-2032)
Figure 10. Europe Food Grade Pigment Revenue (USD Million) By Country (2021-2032)
Figure 11. Germany Food Grade Pigment Revenue (USD Million) By Country (2021-2032)
Figure 12. France Food Grade Pigment Revenue (USD Million) By Country (2021-2032)
Figure 13. United Kingdom Food Grade Pigment Revenue (USD Million) By Country (2021-2032)
Figure 14. Spain Food Grade Pigment Revenue (USD Million) By Country (2021-2032)
Figure 15. Italy Food Grade Pigment Revenue (USD Million) By Country (2021-2032)
Figure 16. Russia Food Grade Pigment Revenue (USD Million) By Country (2021-2032)
Figure 17. Rest of Europe Food Grade Pigment Revenue (USD Million) By Country (2021-2032)
Figure 11. Asia Pacific Food Grade Pigment Revenue (USD Million) By Country (2021-2032)
Figure 12. China Food Grade Pigment Revenue (USD Million) By Country (2021-2032)
Figure 13. Japan Food Grade Pigment Revenue (USD Million) By Country (2021-2032)
Figure 14. India Food Grade Pigment Revenue (USD Million) By Country (2021-2032)
Figure 15. South Korea Food Grade Pigment Revenue (USD Million) By Country (2021-2032)
Figure 16. Australia Food Grade Pigment Revenue (USD Million) By Country (2021-2032)
Figure 17. South East Asia Food Grade Pigment Revenue (USD Million) By Country (2021-2032)
Figure 18. South America Food Grade Pigment Revenue (USD Million) By Country (2021-2032)
Figure 19. Brazil Food Grade Pigment Revenue (USD Million) By Country (2021-2032)
Figure 20. Argentina Food Grade Pigment Revenue (USD Million) By Country (2021-2032)
Figure 21. Rest of Asia Pacific Food Grade Pigment Revenue (USD Million) By Country (2021-2032)
Figure 22. Middle East and Africa Food Grade Pigment Revenue (USD Million) By Region (2021-2032)
Figure 23. Saudi Arabia Food Grade Pigment Revenue (USD Million) By Region (2021-2032)
Figure 24. The UAE Food Grade Pigment Revenue (USD Million) By Region (2021-2032)
Figure 25. Rest of Middle East Food Grade Pigment Revenue (USD Million) By Region (2021-2032)
Figure 26. South Africa Food Grade Pigment Revenue (USD Million) By Region (2021-2032)
Figure 27. Africa Food Grade Pigment Revenue (USD Million) By Region (2021-2032)
Figure 28. North America Food Grade Pigment Revenue (USD Million) By Type (2021-2032)
Figure 29. North America Food Grade Pigment Revenue (USD Million) By Application (2021-2032)
Figure 30. North America Food Grade Pigment Revenue (USD Million) By Product (2021-2032)
Figure 31. Europe Food Grade Pigment Revenue (USD Million) By Type (2021-2032)
Figure 32. Europe Food Grade Pigment Revenue (USD Million) By Application (2021-2032)
Figure 33. Europe Food Grade Pigment Revenue (USD Million) By Product (2021-2032)
Figure 34. Asia Pacific Food Grade Pigment Revenue (USD Million) By Type (2021-2032)
Figure 35. Asia Pacific Food Grade Pigment Revenue (USD Million) By Application (2021-2032)
Figure 36. Asia Pacific Food Grade Pigment Revenue (USD Million) By Product (2021-2032)
Figure 37. South America Food Grade Pigment Revenue (USD Million) By Type (2021-2032)
Figure 38. South America Food Grade Pigment Revenue (USD Million) By Application (2021-2032)
Figure 39. South America Food Grade Pigment Revenue (USD Million) By Product (2021-2032)
Figure 40. Middle East and Africa Food Grade Pigment Revenue (USD Million) By Type (2021-2032)
Figure 41. Middle East and Africa Food Grade Pigment Revenue (USD Million) By Application (2021-2032)
Figure 42. Middle East and Africa Food Grade Pigment Revenue (USD Million) By Product (2021-2032)
By Type
Powder
Granular
Others
By Application
Food
Medicine
Cosmetics
Others
Countries Analyzed
North America (US, Canada, Mexico)
Europe (Germany, UK, France, Spain, Italy, Russia, Rest of Europe)
Asia Pacific (China, India, Japan, South Korea, Australia, South East Asia, Rest of Asia)
South America (Brazil, Argentina, Rest of South America)
Middle East and Africa (Saudi Arabia, UAE, Rest of Middle East, South Africa, Egypt, Rest of Africa)
