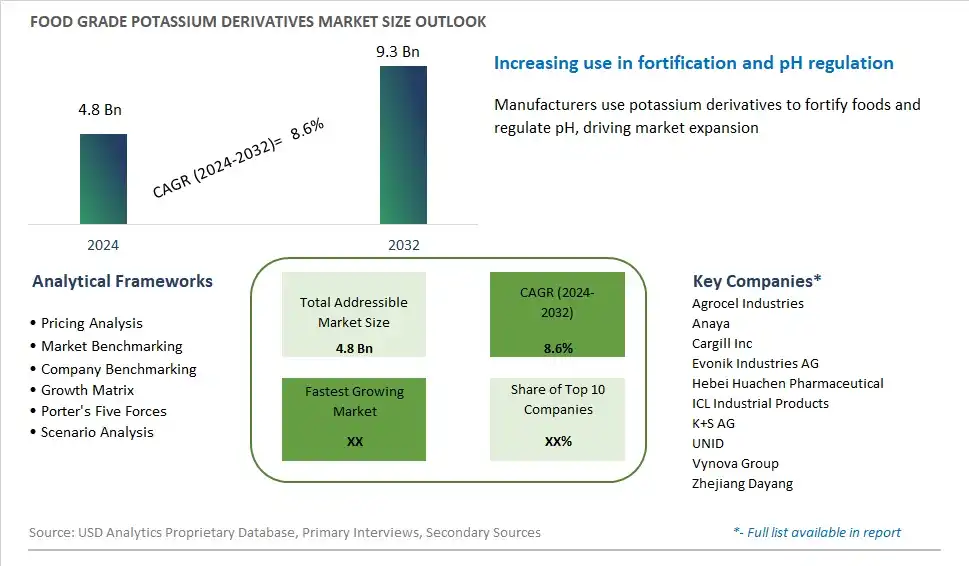
Global Food Grade Potassium Derivatives Market Size is valued at $4.8 Billion in 2024 and is forecast to register a growth rate (CAGR) of 8.6% to reach $9.3 Billion by 2032.
The global Food Grade Potassium Derivatives Market Comprehensive Study analyzes and forecasts the market size across 6 regions and 24 countries for diverse segments -By Type (Potassium Chloride, Potassium Citrate, Potassium Sorbate, Potassium Carbonate), By Application (Bakery and Confectionery, Beverages, Dairy Products, Processed Foods), By End-User (Food and Beverage, Food Service, Retail and Consumer Goods)
An Introduction to Food Grade Potassium Derivatives Market
In 2024, the food grade potassium derivatives market is growing, driven by their essential roles in food preservation, texture enhancement, and nutritional fortification. Potassium derivatives, including potassium chloride, potassium bicarbonate, and potassium sorbate, are widely used in the food industry for their functional and health benefits. Potassium chloride, for instance, is often used as a salt substitute to reduce sodium content in foods, catering to the growing demand for healthier, low-sodium options. Potassium sorbate is a popular preservative that prevents mold and yeast growth, extending the shelf life of various products. The market is supported by the increasing consumer focus on health and wellness, as well as regulatory initiatives promoting reduced sodium intake. The versatility and health benefits of potassium derivatives continue to drive their adoption in the food industry, ensuring steady market growth and development.
Food Grade Potassium Derivatives Competitive Landscape
The market report analyses the leading companies in the industry including Agrocel Industries, Anaya, Cargill Inc, Evonik Industries AG, Hebei Huachen Pharmaceutical, ICL Industrial Products, K+S AG, UNID, Vynova Group, Zhejiang Dayang, and Others.
Food Grade Potassium Derivatives Market Dynamics
Food Grade Potassium Derivatives Market Trend: Shift Towards Healthier Food Formulations and Clean Label Ingredients
A prominent trend in the food grade potassium derivatives market is the shift towards healthier food formulations and clean label ingredients. With increasing consumer awareness about the link between diet and health, there's a growing demand for food additives and ingredients that are perceived as natural, safe, and beneficial for health. Potassium derivatives, such as potassium chloride and potassium citrate, are gaining popularity as alternatives to traditional sodium-based additives for their role in reducing sodium content and enhancing flavor in food products. This trend is driven by regulatory initiatives to reduce sodium intake, consumer preference for clean label products, and the food industry's commitment to meeting evolving dietary guidelines. Manufacturers are reformulating their products with food grade potassium derivatives to offer healthier options that align with consumer preferences for clean label ingredients and support initiatives aimed at reducing sodium consumption. As the demand for healthier food choices continues to grow, the market for food grade potassium derivatives is expected to witness steady expansion.
Market Driver: Health Consciousness and Sodium Reduction Initiatives
An essential driver fueling the food grade potassium derivatives market is the increasing health consciousness among consumers and sodium reduction initiatives by governments and public health organizations. High sodium intake is associated with hypertension, cardiovascular diseases, and other health issues, prompting efforts to lower sodium levels in processed foods and encourage the use of potassium-based additives as alternatives. Potassium derivatives, such as potassium chloride and potassium citrate, offer functional benefits such as salt reduction, flavor enhancement, and potassium fortification, making them attractive options for food manufacturers seeking to meet sodium reduction targets without compromising taste or product quality. The growing emphasis on preventive healthcare, coupled with regulatory pressure to lower sodium content in foods, is driving the adoption of food grade potassium derivatives as key ingredients in sodium reduction strategies across various food and beverage categories.
Market Opportunity: Expansion into Functional Foods and Nutritional Supplements
A significant opportunity within the food grade potassium derivatives market lies in expanding into functional foods and nutritional supplements. Beyond their role in sodium reduction, potassium derivatives have the potential to add value to a range of functional food and supplement products aimed at promoting overall health and wellness. Potassium chloride, for example, can be incorporated into electrolyte replenishment drinks, sports nutrition products, and hydration solutions to support physical performance and post-exercise recovery. Similarly, potassium citrate may be used in dietary supplements targeting consumers with specific health concerns such as bone health, kidney stones, or acid-base balance. By tapping into the growing market for functional foods and nutritional supplements, manufacturers of food grade potassium derivatives can diversify their product portfolios, address unmet consumer needs, and capitalize on emerging trends in the health and wellness industry.
Food Grade Potassium Derivatives Market Share Analysis: Potassium Chloride held the dominant market share in 2024
In the Food Grade Potassium Derivatives Market, the Potassium Chloride segment is the largest, owing to its wide-ranging applications and cost-effectiveness in various food and beverage products. Potassium chloride serves as a versatile salt substitute and electrolyte replenisher, offering a viable alternative to sodium chloride (table salt) in food formulations. Its ability to enhance flavor, regulate osmotic pressure, and preserve food products makes it a preferred choice for manufacturers seeking to reduce sodium content while maintaining taste and functionality. Further, potassium chloride's essential role in addressing health concerns related to excessive sodium intake, such as hypertension and cardiovascular diseases, further drives its widespread adoption in food processing. Additionally, its regulatory approval for use in food products and its established safety profile reinforce its dominance in the market. With the growing consumer demand for healthier and low-sodium food options, the Potassium Chloride segment maintains its position as the largest in the Food Grade Potassium Derivatives Market.
Food Grade Potassium Derivatives Market Share Analysis: Bakery and Confectionery market is poised to register the fastest growth rae over the forecast period to 2032
In the Food Grade Potassium Derivatives Market, the Bakery and Confectionery segment is the fastest-growing, driven by the increasing consumer demand for healthier and cleaner-label bakery products. Potassium derivatives, such as potassium chloride and potassium sorbate, serve as effective substitutes for traditional ingredients like sodium chloride and synthetic preservatives in bakery and confectionery applications. Manufacturers are increasingly incorporating potassium derivatives to reduce sodium content, enhance product shelf life, and meet clean-label requirements without compromising on taste or quality. Further, with consumers becoming more health-conscious and seeking products with natural ingredients, potassium derivatives offer a viable solution for improving the nutritional profile of bakery and confectionery items. Additionally, the versatility of potassium derivatives allows for their application in various bakery products, including bread, cakes, cookies, and pastries, further fueling the segment's growth. As bakery and confectionery manufacturers continue to innovate and reformulate their products to meet evolving consumer preferences, the Bakery and Confectionery segment in the Food Grade Potassium Derivatives Market is poised for rapid expansion in the foreseeable future.
Food Grade Potassium Derivatives Market Share Analysis: Food and Beverage held the dominant market share in 2024
In the Food Grade Potassium Derivatives Market, the Food and Beverage segment stands as the largest, driven by the extensive use of potassium derivatives as additives and ingredients in various food and beverage formulations. Potassium derivatives, such as potassium chloride, potassium citrate, and potassium sorbate, serve multiple functions in the food and beverage industry, including flavor enhancement, preservation, and pH regulation. They are widely employed in a diverse range of products, including processed foods, beverages, dairy products, and snacks, to improve taste, texture, and shelf life. Further, with increasing consumer awareness of health and nutrition, potassium derivatives offer a viable solution for reducing sodium content and enhancing the nutritional profile of food and beverage products. Additionally, the Food and Beverage segment benefits from the continuous innovation and product development efforts by manufacturers to meet consumer demands for healthier and cleaner-label food options. As the demand for functional and value-added food products continues to rise, the Food and Beverage segment maintains its dominance in the Food Grade Potassium Derivatives Market.
Food Grade Potassium Derivatives Market Segmentation
By Type
Potassium Chloride
Potassium Citrate
Potassium Sorbate
Potassium Carbonate
By Application
Bakery and Confectionery
Beverages
Dairy Products
Processed Foods
By End-User
Food and Beverage
Food Service
Retail and Consumer Goods
Countries Analyzed
North America (US, Canada, Mexico)
Europe (Germany, UK, France, Spain, Italy, Russia, Rest of Europe)
Asia Pacific (China, India, Japan, South Korea, Australia, South East Asia, Rest of Asia)
South America (Brazil, Argentina, Rest of South America)
Middle East and Africa (Saudi Arabia, UAE, Rest of Middle East, South Africa, Egypt, Rest of Africa)
Food Grade Potassium Derivatives Companies Profiled in the Study
Agrocel Industries
Anaya
Cargill Inc
Evonik Industries AG
Hebei Huachen Pharmaceutical
ICL Industrial Products
K+S AG
UNID
Vynova Group
Zhejiang Dayang
*- List Not Exhaustive
Chapter 1. TABLE OF CONTENTS
Chapter 2. Introduction to Food Grade Potassium Derivatives Market
2.1. Market Overview
2.2. Key Statistics and Report Highlights
2.3. Scope of the Comprehensive Study
2.3.1. Market Definition
2.3.2 Countries and Regions Covered
2.3.3 Research Objective
2.3.4 Units, Currency, and Conversions
2.3.5 Industry Value Chain
2.4. Key Market Segments
2.5. Key Companies
2.6. Study Period
Chapter 3. Strategic Analysis Review
3.1. Food Grade Potassium Derivatives Pricing Analysis and Forecast
3.2. Porter’s Five Forces
3.3. Market Ecosystem
3.4. SWOT Analysis
3.5. Regulatory Scenario
3.3. Effects of Inflation, Russia-Ukraine War, moderating economic growth, and other macroeconomic factors
Chapter 4. Competitive Landscape
4.1. Market Share Analysis
4.1.1. Global Food Grade Potassium Derivatives Market Share by Company, 2023
4.1.2. Product Offerings of Leading Food Grade Potassium Derivatives Companies
4.2. Market Entropy
4.2.1. New Product Launches in the Industry
4.2.2. Mergers, Acquisitions, Joint ventures, and Partnerships
4.3. Key Strategies and Best Practices
Chapter 5. Global Market Projections: Best, Reference, and Low Case Scenarios
5.1. Growth Analysis- Case Scenario Definitions
5.2. Low Growth Case Scenario Forecasts
5.3. Reference Growth Case Scenario Forecasts
5.4. High Growth Case Scenario Forecasts
Chapter 6. Market Dynamics
6.1. Food Grade Potassium Derivatives Market Drivers
6.2. Food Grade Potassium Derivatives Market Challenges
6.6. Food Grade Potassium Derivatives Market Opportunities
6.4. Food Grade Potassium Derivatives Market Trends
Chapter 7. Global Food Grade Potassium Derivatives Market Outlook Trends
7.1. Global Food Grade Potassium Derivatives Revenue (USD Million) and CAGR (%) by Type (2021-2032)
7.2. Global Food Grade Potassium Derivatives Revenue (USD Million) and CAGR (%) by Application (2021-2032)
7.3. Global Food Grade Potassium Derivatives Revenue (USD Million) and CAGR (%) by Product (2021-2032)
By Type
Potassium Chloride
Potassium Citrate
Potassium Sorbate
Potassium Carbonate
By Application
Bakery and Confectionery
Beverages
Dairy Products
Processed Foods
By End-User
Food and Beverage
Food Service
Retail and Consumer Goods
Chapter 8. Global Food Grade Potassium Derivatives Regional Analysis and Outlook
8.1. Global Food Grade Potassium Derivatives Revenue (USD Million) By Regions (2021- 2032)
8.2. North America Food Grade Potassium Derivatives Revenue (USD Million) by Country (2021-2032)
8.2.1. United States Food Grade Potassium Derivatives Regional Analysis and Outlook
8.2.2. Canada Food Grade Potassium Derivatives Regional Analysis and Outlook
8.2.3. Mexico Food Grade Potassium Derivatives Regional Analysis and Outlook
8.3. Europe Food Grade Potassium Derivatives Revenue (USD Million), by Country (2021-2032)
8.3.1. Germany Food Grade Potassium Derivatives Regional Analysis and Outlook
8.3.2. France Food Grade Potassium Derivatives Regional Analysis and Outlook
8.3.3. United Kingdom Food Grade Potassium Derivatives Regional Analysis and Outlook
8.3.4. Spain Food Grade Potassium Derivatives Regional Analysis and Outlook
8.3.5. Italy Food Grade Potassium Derivatives Regional Analysis and Outlook
8.3.6. Russia Food Grade Potassium Derivatives Regional Analysis and Outlook
8.3.7. Rest of Europe Food Grade Potassium Derivatives Regional Analysis and Outlook
8.4. Asia Pacific Food Grade Potassium Derivatives Revenue (USD Million) by Country (2021-2032)
8.4.1. China Food Grade Potassium Derivatives Regional Analysis and Outlook
8.4.2. Japan Food Grade Potassium Derivatives Regional Analysis and Outlook
8.4.3. India Food Grade Potassium Derivatives Regional Analysis and Outlook
8.4.4. South Korea Food Grade Potassium Derivatives Regional Analysis and Outlook
8.4.5. Australia Food Grade Potassium Derivatives Regional Analysis and Outlook
8.4.6. South East Asia Food Grade Potassium Derivatives Regional Analysis and Outlook
8.4.7. Rest of Asia Pacific Food Grade Potassium Derivatives Regional Analysis and Outlook
8.5. South America Food Grade Potassium Derivatives Revenue (USD Million), by Country (2021-2032)
8.5.1. Brazil Food Grade Potassium Derivatives Regional Analysis and Outlook
8.5.2. Argentina Food Grade Potassium Derivatives Regional Analysis and Outlook
8.5.3. Rest of South America Food Grade Potassium Derivatives Regional Analysis and Outlook
8.6. Middle East and Africa Food Grade Potassium Derivatives Revenue (USD Million) by Country (2021-2032)
8.6.1. Middle East Food Grade Potassium Derivatives Regional Analysis and Outlook
8.6.2. Africa Food Grade Potassium Derivatives Regional Analysis and Outlook
Chapter 9. North America Food Grade Potassium Derivatives Analysis and Outlook
9.1. North America Food Grade Potassium Derivatives Revenue (USD Million) by Segments (2021-2032)
9.1.1. North America Food Grade Potassium Derivatives Revenue (USD Million) by Type (2021-2032)
9.1.2. North America Food Grade Potassium Derivatives Revenue (USD Million) by Application (2021-2032)
9.1.3. North America Food Grade Potassium Derivatives Revenue (USD Million) by Product (2021-2032)
By Type
Potassium Chloride
Potassium Citrate
Potassium Sorbate
Potassium Carbonate
By Application
Bakery and Confectionery
Beverages
Dairy Products
Processed Foods
By End-User
Food and Beverage
Food Service
Retail and Consumer Goods
Chapter 10. Europe Food Grade Potassium Derivatives Analysis and Outlook
10.1. Europe Food Grade Potassium Derivatives Revenue (USD Million), by Segments (USD Million) (2021-2032)
10.1.1. Europe Food Grade Potassium Derivatives Revenue (USD Million) by Type (2021-2032)
10.1.2. Europe Food Grade Potassium Derivatives Revenue (USD Million) by Application (2021-2032)
10.1.3. Europe Food Grade Potassium Derivatives Revenue (USD Million) by Product (2021-2032)
By Type
Potassium Chloride
Potassium Citrate
Potassium Sorbate
Potassium Carbonate
By Application
Bakery and Confectionery
Beverages
Dairy Products
Processed Foods
By End-User
Food and Beverage
Food Service
Retail and Consumer Goods
Chapter 11. Asia Pacific Food Grade Potassium Derivatives Analysis and Outlook
11.1. Asia Pacific Food Grade Potassium Derivatives Revenue (USD Million), and Revenue (USD Million) by Segments (2021-2032)
11.1.1. Asia Pacific Food Grade Potassium Derivatives Revenue (USD Million) by Type (2021-2032)
11.1.2. Asia Pacific Food Grade Potassium Derivatives Revenue (USD Million) by Application (2021-2032)
11.1.3. Asia Pacific Food Grade Potassium Derivatives Revenue (USD Million) by Product (2021-2032)
By Type
Potassium Chloride
Potassium Citrate
Potassium Sorbate
Potassium Carbonate
By Application
Bakery and Confectionery
Beverages
Dairy Products
Processed Foods
By End-User
Food and Beverage
Food Service
Retail and Consumer Goods
Chapter 12. South America Food Grade Potassium Derivatives Analysis and Outlook
12.1. South America Food Grade Potassium Derivatives Revenue (USD Million), by Segments (2021-2032)
12.1.1. South America Food Grade Potassium Derivatives Revenue (USD Million) by Type (2021-2032)
12.1.2. South America Food Grade Potassium Derivatives Revenue (USD Million) by Application (2021-2032)
12.1.3. South America Food Grade Potassium Derivatives Revenue (USD Million) by Product (2021-2032)
By Type
Potassium Chloride
Potassium Citrate
Potassium Sorbate
Potassium Carbonate
By Application
Bakery and Confectionery
Beverages
Dairy Products
Processed Foods
By End-User
Food and Beverage
Food Service
Retail and Consumer Goods
Chapter 13. Middle East and Africa Food Grade Potassium Derivatives Analysis and Outlook
13.1. Middle East and Africa Food Grade Potassium Derivatives Revenue (USD Million), by Segments (2021-2032)
13.1.1. Middle East and Africa Food Grade Potassium Derivatives Revenue (USD Million) by Type (2021-2032)
13.1.2. Middle East and Africa Food Grade Potassium Derivatives Revenue (USD Million) by Application (2021-2032)
13.1.3. Middle East and Africa Food Grade Potassium Derivatives Revenue (USD Million) by Product (2021-2032)
By Type
Potassium Chloride
Potassium Citrate
Potassium Sorbate
Potassium Carbonate
By Application
Bakery and Confectionery
Beverages
Dairy Products
Processed Foods
By End-User
Food and Beverage
Food Service
Retail and Consumer Goods
Chapter 14. Food Grade Potassium Derivatives Company Profiles
14.1 Business Overview
14.2 Product Profiles
14.3 SWOT Profiles
14.5 Recent Developments
14.6 Financial Profile
List of Companies
Agrocel Industries
Anaya
Cargill Inc
Evonik Industries AG
Hebei Huachen Pharmaceutical
ICL Industrial Products
K+S AG
UNID
Vynova Group
Zhejiang Dayang
15. Methodology and Data Sources
15.1 Customization Offerings
15.2 Subscription Services
15.3 Related Reports
15.4 Publisher Expertise
LIST OF TABLES
Table 1 Market Segmentation Analysis
Table 2 Global Food Grade Potassium Derivatives Market Share of Leading Companies, 2023
Table 3 Product Offerings of Leading Companies
Table 4 Low Growth Scenario Forecasts
Table 5 Reference Case Growth Scenario
Table 6 High Growth Case Scenario
Table 7 Global Food Grade Potassium Derivatives Revenue (USD Million) And CAGR (%) By Type (2021-2032)
Table 8 Global Food Grade Potassium Derivatives Revenue (USD Million) And CAGR (%) By Application (2021-2032)
Table 9 Global Food Grade Potassium Derivatives Revenue (USD Million) And CAGR (%) By Product (2021-2032)
Table 10 Global Food Grade Potassium Derivatives Market Revenue (USD Million) By Regions (2021-2032)
Table 11 Global Food Grade Potassium Derivatives Market Share (%) By Regions (2021-2032)
Table 12 North America Food Grade Potassium Derivatives Revenue (USD Million) By Country (2021-2032)
Table 13 Europe Food Grade Potassium Derivatives Revenue (USD Million) By Country (2021-2032)
Table 14 Asia Pacific Food Grade Potassium Derivatives Revenue (USD Million) By Country (2021-2032)
Table 15 South America Food Grade Potassium Derivatives Revenue (USD Million) By Country (2021-2032)
Table 16 Middle East and Africa Food Grade Potassium Derivatives Revenue (USD Million) By Region (2021-2032)
Table 17 North America Food Grade Potassium Derivatives Revenue (USD Million) By Type (2021-2032)
Table 18 North America Food Grade Potassium Derivatives Revenue (USD Million) By Application (2021-2032)
Table 19 North America Food Grade Potassium Derivatives Revenue (USD Million) By Product (2021-2032)
Table 20 Europe Food Grade Potassium Derivatives Revenue (USD Million) By Type (2021-2032)
Table 21 Europe Food Grade Potassium Derivatives Revenue (USD Million) By Application (2021-2032)
Table 22 Europe Food Grade Potassium Derivatives Revenue (USD Million) By Product (2021-2032)
Table 23 Asia Pacific Food Grade Potassium Derivatives Revenue (USD Million) By Type (2021-2032)
Table 24 Asia Pacific Food Grade Potassium Derivatives Revenue (USD Million) By Application (2021-2032)
Table 25 Asia Pacific Food Grade Potassium Derivatives Revenue (USD Million) By Product (2021-2032)
Table 26 South America Food Grade Potassium Derivatives Revenue (USD Million) By Type (2021-2032)
Table 27 South America Food Grade Potassium Derivatives Revenue (USD Million) By Application (2021-2032)
Table 28 South America Food Grade Potassium Derivatives Revenue (USD Million) By Product (2021-2032)
Table 29 Middle East and Africa Food Grade Potassium Derivatives Revenue (USD Million) By Type (2021-2032)
Table 30 Middle East and Africa Food Grade Potassium Derivatives Revenue (USD Million) By Application (2021-2032)
Table 31 Middle East and Africa Food Grade Potassium Derivatives Revenue (USD Million) By Product (2021-2032)
LIST OF FIGURES
Figure 1. Market Scope
Figure 2. Pricing Forecasts Per Unit, 2023- 2032
Figure 3. Porter’s Five Forces
Figure 4. Global Food Grade Potassium Derivatives Market Revenue (USD Million) By Regions (2021-2032)
Figure 5. Global Food Grade Potassium Derivatives Market Share (%) By Regions (2023)
Figure 6. North America Food Grade Potassium Derivatives Revenue (USD Million) By Country (2021-2032)
Figure 7. United States Food Grade Potassium Derivatives Revenue (USD Million) By Country (2021-2032)
Figure 8. Canada Food Grade Potassium Derivatives Revenue (USD Million) By Country (2021-2032)
Figure 9. Mexico Food Grade Potassium Derivatives Revenue (USD Million) By Country (2021-2032)
Figure 10. Europe Food Grade Potassium Derivatives Revenue (USD Million) By Country (2021-2032)
Figure 11. Germany Food Grade Potassium Derivatives Revenue (USD Million) By Country (2021-2032)
Figure 12. France Food Grade Potassium Derivatives Revenue (USD Million) By Country (2021-2032)
Figure 13. United Kingdom Food Grade Potassium Derivatives Revenue (USD Million) By Country (2021-2032)
Figure 14. Spain Food Grade Potassium Derivatives Revenue (USD Million) By Country (2021-2032)
Figure 15. Italy Food Grade Potassium Derivatives Revenue (USD Million) By Country (2021-2032)
Figure 16. Russia Food Grade Potassium Derivatives Revenue (USD Million) By Country (2021-2032)
Figure 17. Rest of Europe Food Grade Potassium Derivatives Revenue (USD Million) By Country (2021-2032)
Figure 11. Asia Pacific Food Grade Potassium Derivatives Revenue (USD Million) By Country (2021-2032)
Figure 12. China Food Grade Potassium Derivatives Revenue (USD Million) By Country (2021-2032)
Figure 13. Japan Food Grade Potassium Derivatives Revenue (USD Million) By Country (2021-2032)
Figure 14. India Food Grade Potassium Derivatives Revenue (USD Million) By Country (2021-2032)
Figure 15. South Korea Food Grade Potassium Derivatives Revenue (USD Million) By Country (2021-2032)
Figure 16. Australia Food Grade Potassium Derivatives Revenue (USD Million) By Country (2021-2032)
Figure 17. South East Asia Food Grade Potassium Derivatives Revenue (USD Million) By Country (2021-2032)
Figure 18. South America Food Grade Potassium Derivatives Revenue (USD Million) By Country (2021-2032)
Figure 19. Brazil Food Grade Potassium Derivatives Revenue (USD Million) By Country (2021-2032)
Figure 20. Argentina Food Grade Potassium Derivatives Revenue (USD Million) By Country (2021-2032)
Figure 21. Rest of Asia Pacific Food Grade Potassium Derivatives Revenue (USD Million) By Country (2021-2032)
Figure 22. Middle East and Africa Food Grade Potassium Derivatives Revenue (USD Million) By Region (2021-2032)
Figure 23. Saudi Arabia Food Grade Potassium Derivatives Revenue (USD Million) By Region (2021-2032)
Figure 24. The UAE Food Grade Potassium Derivatives Revenue (USD Million) By Region (2021-2032)
Figure 25. Rest of Middle East Food Grade Potassium Derivatives Revenue (USD Million) By Region (2021-2032)
Figure 26. South Africa Food Grade Potassium Derivatives Revenue (USD Million) By Region (2021-2032)
Figure 27. Africa Food Grade Potassium Derivatives Revenue (USD Million) By Region (2021-2032)
Figure 28. North America Food Grade Potassium Derivatives Revenue (USD Million) By Type (2021-2032)
Figure 29. North America Food Grade Potassium Derivatives Revenue (USD Million) By Application (2021-2032)
Figure 30. North America Food Grade Potassium Derivatives Revenue (USD Million) By Product (2021-2032)
Figure 31. Europe Food Grade Potassium Derivatives Revenue (USD Million) By Type (2021-2032)
Figure 32. Europe Food Grade Potassium Derivatives Revenue (USD Million) By Application (2021-2032)
Figure 33. Europe Food Grade Potassium Derivatives Revenue (USD Million) By Product (2021-2032)
Figure 34. Asia Pacific Food Grade Potassium Derivatives Revenue (USD Million) By Type (2021-2032)
Figure 35. Asia Pacific Food Grade Potassium Derivatives Revenue (USD Million) By Application (2021-2032)
Figure 36. Asia Pacific Food Grade Potassium Derivatives Revenue (USD Million) By Product (2021-2032)
Figure 37. South America Food Grade Potassium Derivatives Revenue (USD Million) By Type (2021-2032)
Figure 38. South America Food Grade Potassium Derivatives Revenue (USD Million) By Application (2021-2032)
Figure 39. South America Food Grade Potassium Derivatives Revenue (USD Million) By Product (2021-2032)
Figure 40. Middle East and Africa Food Grade Potassium Derivatives Revenue (USD Million) By Type (2021-2032)
Figure 41. Middle East and Africa Food Grade Potassium Derivatives Revenue (USD Million) By Application (2021-2032)
Figure 42. Middle East and Africa Food Grade Potassium Derivatives Revenue (USD Million) By Product (2021-2032)
By Type
Potassium Chloride
Potassium Citrate
Potassium Sorbate
Potassium Carbonate
By Application
Bakery and Confectionery
Beverages
Dairy Products
Processed Foods
By End-User
Food and Beverage
Food Service
Retail and Consumer Goods
Countries Analyzed
North America (US, Canada, Mexico)
Europe (Germany, UK, France, Spain, Italy, Russia, Rest of Europe)
Asia Pacific (China, India, Japan, South Korea, Australia, South East Asia, Rest of Asia)
South America (Brazil, Argentina, Rest of South America)
Middle East and Africa (Saudi Arabia, UAE, Rest of Middle East, South Africa, Egypt, Rest of Africa)
