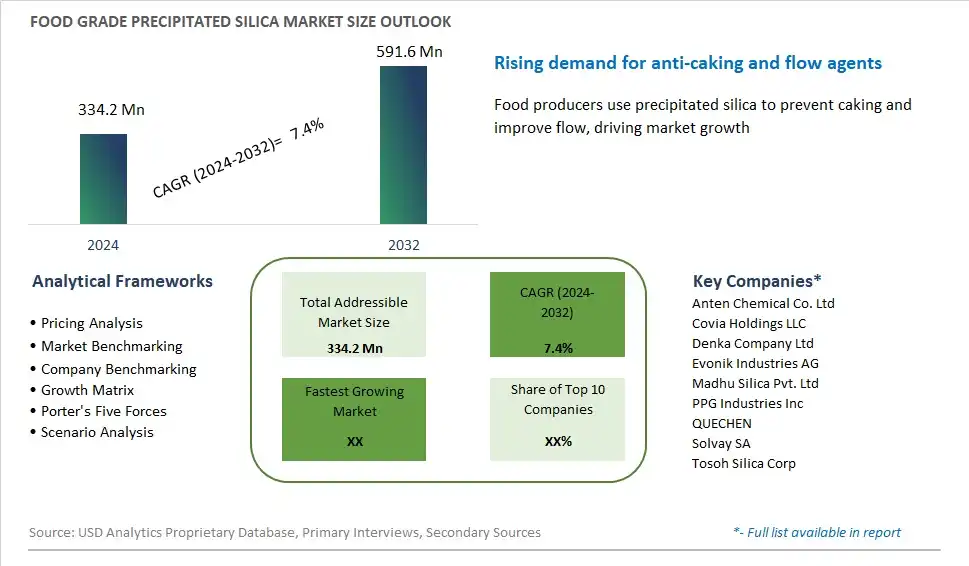
Global Food Grade Precipitated Silica Market Size is valued at $334.2 Million in 2024 and is forecast to register a growth rate (CAGR) of 7.4% to reach $591.6 Million by 2032.
The global Food Grade Precipitated Silica Market Comprehensive Study analyzes and forecasts the market size across 6 regions and 24 countries for diverse segments -By Product (Powdered Form, Granular Form), By Application (Food Additives, Beverages, Bakery Products), By End-User (Food and Beverage, Packaging)
An Introduction to Food Grade Precipitated Silica Market
In 2024, the food grade precipitated silica market is experiencing significant growth due to its versatile applications and rising demand in the food industry. Precipitated silica, an amorphous form of silicon dioxide, is primarily used as an anti-caking agent, ensuring the free flow of powdered ingredients such as spices, seasonings, and drink mixes. Its role extends to acting as a stabilizer, thickener, and carrier for flavors and fragrances. The market benefits from the increasing production of processed foods and the necessity for maintaining product quality and consistency. Additionally, the demand for clean-label ingredients has led to the adoption of precipitated silica, given its natural origin and safety profile. As food manufacturers continue to innovate and enhance product formulations, the reliance on food grade precipitated silica is set to grow, driving market expansion.
Food Grade Precipitated Silica Competitive Landscape
The market report analyses the leading companies in the industry including Anten Chemical Co. Ltd, Covia Holdings LLC, Denka Company Ltd, Evonik Industries AG, Madhu Silica Pvt. Ltd, PPG Industries Inc, QUECHEN, Solvay SA, Tosoh Silica Corp, and Others.
Food Grade Precipitated Silica Market Dynamics
Food Grade Precipitated Silica Market Trend: Increasing Demand for Food Safety and Shelf-Life Extension Solutions
A prominent trend in the food grade precipitated silica market is the increasing demand for food safety and shelf-life extension solutions. With consumers becoming more concerned about the safety and quality of the food they consume, there's a growing emphasis on the use of additives and ingredients that can improve food stability, prevent spoilage, and extend shelf life. Precipitated silica, known for its absorbent and anti-caking properties, is gaining traction as a food additive for its ability to enhance texture, prevent clumping, and maintain product integrity. This trend is driven by regulatory requirements, evolving consumer preferences, and the food industry's focus on ensuring product safety and quality throughout the supply chain. Manufacturers are incorporating food grade precipitated silica into a variety of food products, including powdered mixes, seasoning blends, and condiments, to meet the demand for safer, longer-lasting food options and address concerns about foodborne illness and waste.
Market Driver: Growth in Packaged and Convenience Foods Industry
An essential driver fueling the food grade precipitated silica market is the growth in the packaged and convenience foods industry. With changing lifestyles, urbanization, and increasing disposable incomes, there's a rising demand for convenient, ready-to-eat food products that offer convenience and portability. Precipitated silica plays a crucial role in the production of packaged foods by improving flowability, preventing caking, and enhancing product stability during storage and transportation. As the packaged and convenience foods sector continues to expand globally, driven by factors such as busy lifestyles, on-the-go consumption habits, and the proliferation of online grocery delivery services, the demand for food grade precipitated silica is expected to rise. Manufacturers are leveraging the versatility and functionality of precipitated silica to meet the evolving needs of the packaged foods industry and capitalize on the growing market for convenient, shelf-stable food products.
Market Opportunity: Innovation in Functional Food and Dietary Supplements
A significant opportunity within the food grade precipitated silica market lies in innovation in functional food and dietary supplements. Beyond its traditional applications in packaged foods, precipitated silica has the potential to add value to a range of functional food and supplement products aimed at improving health and wellness. With increasing interest in functional ingredients that offer nutritional benefits and support overall well-being, precipitated silica can be incorporated into formulations to enhance texture, stabilize active ingredients, and improve product performance. For example, precipitated silica may be used in dietary supplements to encapsulate vitamins, minerals, and botanical extracts, ensuring their stability and bioavailability. Similarly, it can be added to functional food products such as meal replacements, protein bars, and fortified beverages to improve texture and sensory attributes. By tapping into the growing market for functional foods and supplements, manufacturers of food grade precipitated silica can diversify their product portfolios, meet consumer demand for healthier options, and capitalize on emerging trends in the health and wellness industry.
Food Grade Precipitated Silica Market Share Analysis: Powdered Form held the dominant market share in 2024
In the Food Grade Precipitated Silica Market, the Powdered Form segment is the largest, primarily due to its versatility, ease of handling, and widespread application across various food and beverage products. Powdered precipitated silica serves as a vital additive and processing aid in the food industry, offering functionalities such as anti-caking, thickening, and flow enhancement. Its fine particulate size ensures uniform dispersion and effective absorption of moisture, preventing clumping and ensuring product consistency. Further, powdered precipitated silica is utilized in a diverse range of food products, including spices, seasonings, powdered beverages, and dry mixes, to improve texture, stability, and shelf life. Additionally, its regulatory approval for use in food products and its status as a Generally Recognized as Safe (GRAS) ingredient further reinforce its dominance in the market. With its essential role in enhancing product quality and performance, the Powdered Form segment maintains its position as the largest in the Food Grade Precipitated Silica Market.
Food Grade Precipitated Silica Market Share Analysis: Food Additives market is poised to register the fastest growth rae over the forecast period to 2032
In the Food Grade Precipitated Silica Market, the Food Additives segment is the fastest-growing, propelled by the increasing demand for silica as a multifunctional additive in food formulations. Precipitated silica offers unique properties such as anti-caking, thickening, and moisture absorption, making it an essential ingredient in food processing. In particular, its ability to prevent clumping and improve flow properties enhances the quality and functionality of powdered food products such as spices, seasonings, and dry mixes. Additionally, precipitated silica is utilized in food additives like anti-foaming agents and carriers, further expanding its application scope in food processing. Further, as manufacturers seek solutions to meet consumer demand for clean-label and natural ingredients, precipitated silica's status as a Generally Recognized as Safe (GRAS) ingredient reinforces its appeal in food additives. With the food industry's continuous innovation and the growing emphasis on product quality and performance, the Food Additives segment in the Food Grade Precipitated Silica Market is poised for rapid growth in the foreseeable future.
Food Grade Precipitated Silica Market Share Analysis: Food and Beverage held the dominant market share in 2024
In the Food Grade Precipitated Silica Market, the Food and Beverage segment stands as the largest, driven by the widespread use of precipitated silica as a vital additive and processing aid in food and beverage products. Precipitated silica plays a crucial role in improving texture, stability, and shelf life across various food and beverage applications. In the food industry, it serves as an anti-caking agent, thickener, and carrier for flavors and nutrients, enhancing the quality and functionality of powdered food products, spices, seasonings, and dry mixes. In beverages, it aids in the stabilization of emulsions, prevention of settling, and enhancement of mouthfeel. Further, precipitated silica's regulatory approval for use in food products and its status as a Generally Recognized as Safe (GRAS) ingredient reinforce its dominance in the Food and Beverage segment. With the food and beverage industry's continuous innovation and emphasis on product quality, safety, and performance, precipitated silica remains indispensable, maintaining its position as the largest segment in the Food Grade Precipitated Silica Market.
Food Grade Precipitated Silica Market Segmentation
By Product
Powdered Form
Granular Form
By Application
Food Additives
Beverages
Bakery Products
By End-User
Food and Beverage
Packaging
Countries Analyzed
North America (US, Canada, Mexico)
Europe (Germany, UK, France, Spain, Italy, Russia, Rest of Europe)
Asia Pacific (China, India, Japan, South Korea, Australia, South East Asia, Rest of Asia)
South America (Brazil, Argentina, Rest of South America)
Middle East and Africa (Saudi Arabia, UAE, Rest of Middle East, South Africa, Egypt, Rest of Africa)
Food Grade Precipitated Silica Companies Profiled in the Study
Anten Chemical Co. Ltd
Covia Holdings LLC
Denka Company Ltd
Evonik Industries AG
Madhu Silica Pvt. Ltd
PPG Industries Inc
QUECHEN
Solvay SA
Tosoh Silica Corp
*- List Not Exhaustive
Chapter 1. TABLE OF CONTENTS
Chapter 2. Introduction to Food Grade Precipitated Silica Market
2.1. Market Overview
2.2. Key Statistics and Report Highlights
2.3. Scope of the Comprehensive Study
2.3.1. Market Definition
2.3.2 Countries and Regions Covered
2.3.3 Research Objective
2.3.4 Units, Currency, and Conversions
2.3.5 Industry Value Chain
2.4. Key Market Segments
2.5. Key Companies
2.6. Study Period
Chapter 3. Strategic Analysis Review
3.1. Food Grade Precipitated Silica Pricing Analysis and Forecast
3.2. Porter’s Five Forces
3.3. Market Ecosystem
3.4. SWOT Analysis
3.5. Regulatory Scenario
3.3. Effects of Inflation, Russia-Ukraine War, moderating economic growth, and other macroeconomic factors
Chapter 4. Competitive Landscape
4.1. Market Share Analysis
4.1.1. Global Food Grade Precipitated Silica Market Share by Company, 2023
4.1.2. Product Offerings of Leading Food Grade Precipitated Silica Companies
4.2. Market Entropy
4.2.1. New Product Launches in the Industry
4.2.2. Mergers, Acquisitions, Joint ventures, and Partnerships
4.3. Key Strategies and Best Practices
Chapter 5. Global Market Projections: Best, Reference, and Low Case Scenarios
5.1. Growth Analysis- Case Scenario Definitions
5.2. Low Growth Case Scenario Forecasts
5.3. Reference Growth Case Scenario Forecasts
5.4. High Growth Case Scenario Forecasts
Chapter 6. Market Dynamics
6.1. Food Grade Precipitated Silica Market Drivers
6.2. Food Grade Precipitated Silica Market Challenges
6.6. Food Grade Precipitated Silica Market Opportunities
6.4. Food Grade Precipitated Silica Market Trends
Chapter 7. Global Food Grade Precipitated Silica Market Outlook Trends
7.1. Global Food Grade Precipitated Silica Revenue (USD Million) and CAGR (%) by Type (2021-2032)
7.2. Global Food Grade Precipitated Silica Revenue (USD Million) and CAGR (%) by Application (2021-2032)
7.3. Global Food Grade Precipitated Silica Revenue (USD Million) and CAGR (%) by Product (2021-2032)
By Product
Powdered Form
Granular Form
By Application
Food Additives
Beverages
Bakery Products
By End-User
Food and Beverage
Packaging
Chapter 8. Global Food Grade Precipitated Silica Regional Analysis and Outlook
8.1. Global Food Grade Precipitated Silica Revenue (USD Million) By Regions (2021- 2032)
8.2. North America Food Grade Precipitated Silica Revenue (USD Million) by Country (2021-2032)
8.2.1. United States Food Grade Precipitated Silica Regional Analysis and Outlook
8.2.2. Canada Food Grade Precipitated Silica Regional Analysis and Outlook
8.2.3. Mexico Food Grade Precipitated Silica Regional Analysis and Outlook
8.3. Europe Food Grade Precipitated Silica Revenue (USD Million), by Country (2021-2032)
8.3.1. Germany Food Grade Precipitated Silica Regional Analysis and Outlook
8.3.2. France Food Grade Precipitated Silica Regional Analysis and Outlook
8.3.3. United Kingdom Food Grade Precipitated Silica Regional Analysis and Outlook
8.3.4. Spain Food Grade Precipitated Silica Regional Analysis and Outlook
8.3.5. Italy Food Grade Precipitated Silica Regional Analysis and Outlook
8.3.6. Russia Food Grade Precipitated Silica Regional Analysis and Outlook
8.3.7. Rest of Europe Food Grade Precipitated Silica Regional Analysis and Outlook
8.4. Asia Pacific Food Grade Precipitated Silica Revenue (USD Million) by Country (2021-2032)
8.4.1. China Food Grade Precipitated Silica Regional Analysis and Outlook
8.4.2. Japan Food Grade Precipitated Silica Regional Analysis and Outlook
8.4.3. India Food Grade Precipitated Silica Regional Analysis and Outlook
8.4.4. South Korea Food Grade Precipitated Silica Regional Analysis and Outlook
8.4.5. Australia Food Grade Precipitated Silica Regional Analysis and Outlook
8.4.6. South East Asia Food Grade Precipitated Silica Regional Analysis and Outlook
8.4.7. Rest of Asia Pacific Food Grade Precipitated Silica Regional Analysis and Outlook
8.5. South America Food Grade Precipitated Silica Revenue (USD Million), by Country (2021-2032)
8.5.1. Brazil Food Grade Precipitated Silica Regional Analysis and Outlook
8.5.2. Argentina Food Grade Precipitated Silica Regional Analysis and Outlook
8.5.3. Rest of South America Food Grade Precipitated Silica Regional Analysis and Outlook
8.6. Middle East and Africa Food Grade Precipitated Silica Revenue (USD Million) by Country (2021-2032)
8.6.1. Middle East Food Grade Precipitated Silica Regional Analysis and Outlook
8.6.2. Africa Food Grade Precipitated Silica Regional Analysis and Outlook
Chapter 9. North America Food Grade Precipitated Silica Analysis and Outlook
9.1. North America Food Grade Precipitated Silica Revenue (USD Million) by Segments (2021-2032)
9.1.1. North America Food Grade Precipitated Silica Revenue (USD Million) by Type (2021-2032)
9.1.2. North America Food Grade Precipitated Silica Revenue (USD Million) by Application (2021-2032)
9.1.3. North America Food Grade Precipitated Silica Revenue (USD Million) by Product (2021-2032)
By Product
Powdered Form
Granular Form
By Application
Food Additives
Beverages
Bakery Products
By End-User
Food and Beverage
Packaging
Chapter 10. Europe Food Grade Precipitated Silica Analysis and Outlook
10.1. Europe Food Grade Precipitated Silica Revenue (USD Million), by Segments (USD Million) (2021-2032)
10.1.1. Europe Food Grade Precipitated Silica Revenue (USD Million) by Type (2021-2032)
10.1.2. Europe Food Grade Precipitated Silica Revenue (USD Million) by Application (2021-2032)
10.1.3. Europe Food Grade Precipitated Silica Revenue (USD Million) by Product (2021-2032)
By Product
Powdered Form
Granular Form
By Application
Food Additives
Beverages
Bakery Products
By End-User
Food and Beverage
Packaging
Chapter 11. Asia Pacific Food Grade Precipitated Silica Analysis and Outlook
11.1. Asia Pacific Food Grade Precipitated Silica Revenue (USD Million), and Revenue (USD Million) by Segments (2021-2032)
11.1.1. Asia Pacific Food Grade Precipitated Silica Revenue (USD Million) by Type (2021-2032)
11.1.2. Asia Pacific Food Grade Precipitated Silica Revenue (USD Million) by Application (2021-2032)
11.1.3. Asia Pacific Food Grade Precipitated Silica Revenue (USD Million) by Product (2021-2032)
By Product
Powdered Form
Granular Form
By Application
Food Additives
Beverages
Bakery Products
By End-User
Food and Beverage
Packaging
Chapter 12. South America Food Grade Precipitated Silica Analysis and Outlook
12.1. South America Food Grade Precipitated Silica Revenue (USD Million), by Segments (2021-2032)
12.1.1. South America Food Grade Precipitated Silica Revenue (USD Million) by Type (2021-2032)
12.1.2. South America Food Grade Precipitated Silica Revenue (USD Million) by Application (2021-2032)
12.1.3. South America Food Grade Precipitated Silica Revenue (USD Million) by Product (2021-2032)
By Product
Powdered Form
Granular Form
By Application
Food Additives
Beverages
Bakery Products
By End-User
Food and Beverage
Packaging
Chapter 13. Middle East and Africa Food Grade Precipitated Silica Analysis and Outlook
13.1. Middle East and Africa Food Grade Precipitated Silica Revenue (USD Million), by Segments (2021-2032)
13.1.1. Middle East and Africa Food Grade Precipitated Silica Revenue (USD Million) by Type (2021-2032)
13.1.2. Middle East and Africa Food Grade Precipitated Silica Revenue (USD Million) by Application (2021-2032)
13.1.3. Middle East and Africa Food Grade Precipitated Silica Revenue (USD Million) by Product (2021-2032)
By Product
Powdered Form
Granular Form
By Application
Food Additives
Beverages
Bakery Products
By End-User
Food and Beverage
Packaging
Chapter 14. Food Grade Precipitated Silica Company Profiles
14.1 Business Overview
14.2 Product Profiles
14.3 SWOT Profiles
14.5 Recent Developments
14.6 Financial Profile
List of Companies
Anten Chemical Co. Ltd
Covia Holdings LLC
Denka Company Ltd
Evonik Industries AG
Madhu Silica Pvt. Ltd
PPG Industries Inc
QUECHEN
Solvay SA
Tosoh Silica Corp
15. Methodology and Data Sources
15.1 Customization Offerings
15.2 Subscription Services
15.3 Related Reports
15.4 Publisher Expertise
LIST OF TABLES
Table 1 Market Segmentation Analysis
Table 2 Global Food Grade Precipitated Silica Market Share of Leading Companies, 2023
Table 3 Product Offerings of Leading Companies
Table 4 Low Growth Scenario Forecasts
Table 5 Reference Case Growth Scenario
Table 6 High Growth Case Scenario
Table 7 Global Food Grade Precipitated Silica Revenue (USD Million) And CAGR (%) By Type (2021-2032)
Table 8 Global Food Grade Precipitated Silica Revenue (USD Million) And CAGR (%) By Application (2021-2032)
Table 9 Global Food Grade Precipitated Silica Revenue (USD Million) And CAGR (%) By Product (2021-2032)
Table 10 Global Food Grade Precipitated Silica Market Revenue (USD Million) By Regions (2021-2032)
Table 11 Global Food Grade Precipitated Silica Market Share (%) By Regions (2021-2032)
Table 12 North America Food Grade Precipitated Silica Revenue (USD Million) By Country (2021-2032)
Table 13 Europe Food Grade Precipitated Silica Revenue (USD Million) By Country (2021-2032)
Table 14 Asia Pacific Food Grade Precipitated Silica Revenue (USD Million) By Country (2021-2032)
Table 15 South America Food Grade Precipitated Silica Revenue (USD Million) By Country (2021-2032)
Table 16 Middle East and Africa Food Grade Precipitated Silica Revenue (USD Million) By Region (2021-2032)
Table 17 North America Food Grade Precipitated Silica Revenue (USD Million) By Type (2021-2032)
Table 18 North America Food Grade Precipitated Silica Revenue (USD Million) By Application (2021-2032)
Table 19 North America Food Grade Precipitated Silica Revenue (USD Million) By Product (2021-2032)
Table 20 Europe Food Grade Precipitated Silica Revenue (USD Million) By Type (2021-2032)
Table 21 Europe Food Grade Precipitated Silica Revenue (USD Million) By Application (2021-2032)
Table 22 Europe Food Grade Precipitated Silica Revenue (USD Million) By Product (2021-2032)
Table 23 Asia Pacific Food Grade Precipitated Silica Revenue (USD Million) By Type (2021-2032)
Table 24 Asia Pacific Food Grade Precipitated Silica Revenue (USD Million) By Application (2021-2032)
Table 25 Asia Pacific Food Grade Precipitated Silica Revenue (USD Million) By Product (2021-2032)
Table 26 South America Food Grade Precipitated Silica Revenue (USD Million) By Type (2021-2032)
Table 27 South America Food Grade Precipitated Silica Revenue (USD Million) By Application (2021-2032)
Table 28 South America Food Grade Precipitated Silica Revenue (USD Million) By Product (2021-2032)
Table 29 Middle East and Africa Food Grade Precipitated Silica Revenue (USD Million) By Type (2021-2032)
Table 30 Middle East and Africa Food Grade Precipitated Silica Revenue (USD Million) By Application (2021-2032)
Table 31 Middle East and Africa Food Grade Precipitated Silica Revenue (USD Million) By Product (2021-2032)
LIST OF FIGURES
Figure 1. Market Scope
Figure 2. Pricing Forecasts Per Unit, 2023- 2032
Figure 3. Porter’s Five Forces
Figure 4. Global Food Grade Precipitated Silica Market Revenue (USD Million) By Regions (2021-2032)
Figure 5. Global Food Grade Precipitated Silica Market Share (%) By Regions (2023)
Figure 6. North America Food Grade Precipitated Silica Revenue (USD Million) By Country (2021-2032)
Figure 7. United States Food Grade Precipitated Silica Revenue (USD Million) By Country (2021-2032)
Figure 8. Canada Food Grade Precipitated Silica Revenue (USD Million) By Country (2021-2032)
Figure 9. Mexico Food Grade Precipitated Silica Revenue (USD Million) By Country (2021-2032)
Figure 10. Europe Food Grade Precipitated Silica Revenue (USD Million) By Country (2021-2032)
Figure 11. Germany Food Grade Precipitated Silica Revenue (USD Million) By Country (2021-2032)
Figure 12. France Food Grade Precipitated Silica Revenue (USD Million) By Country (2021-2032)
Figure 13. United Kingdom Food Grade Precipitated Silica Revenue (USD Million) By Country (2021-2032)
Figure 14. Spain Food Grade Precipitated Silica Revenue (USD Million) By Country (2021-2032)
Figure 15. Italy Food Grade Precipitated Silica Revenue (USD Million) By Country (2021-2032)
Figure 16. Russia Food Grade Precipitated Silica Revenue (USD Million) By Country (2021-2032)
Figure 17. Rest of Europe Food Grade Precipitated Silica Revenue (USD Million) By Country (2021-2032)
Figure 11. Asia Pacific Food Grade Precipitated Silica Revenue (USD Million) By Country (2021-2032)
Figure 12. China Food Grade Precipitated Silica Revenue (USD Million) By Country (2021-2032)
Figure 13. Japan Food Grade Precipitated Silica Revenue (USD Million) By Country (2021-2032)
Figure 14. India Food Grade Precipitated Silica Revenue (USD Million) By Country (2021-2032)
Figure 15. South Korea Food Grade Precipitated Silica Revenue (USD Million) By Country (2021-2032)
Figure 16. Australia Food Grade Precipitated Silica Revenue (USD Million) By Country (2021-2032)
Figure 17. South East Asia Food Grade Precipitated Silica Revenue (USD Million) By Country (2021-2032)
Figure 18. South America Food Grade Precipitated Silica Revenue (USD Million) By Country (2021-2032)
Figure 19. Brazil Food Grade Precipitated Silica Revenue (USD Million) By Country (2021-2032)
Figure 20. Argentina Food Grade Precipitated Silica Revenue (USD Million) By Country (2021-2032)
Figure 21. Rest of Asia Pacific Food Grade Precipitated Silica Revenue (USD Million) By Country (2021-2032)
Figure 22. Middle East and Africa Food Grade Precipitated Silica Revenue (USD Million) By Region (2021-2032)
Figure 23. Saudi Arabia Food Grade Precipitated Silica Revenue (USD Million) By Region (2021-2032)
Figure 24. The UAE Food Grade Precipitated Silica Revenue (USD Million) By Region (2021-2032)
Figure 25. Rest of Middle East Food Grade Precipitated Silica Revenue (USD Million) By Region (2021-2032)
Figure 26. South Africa Food Grade Precipitated Silica Revenue (USD Million) By Region (2021-2032)
Figure 27. Africa Food Grade Precipitated Silica Revenue (USD Million) By Region (2021-2032)
Figure 28. North America Food Grade Precipitated Silica Revenue (USD Million) By Type (2021-2032)
Figure 29. North America Food Grade Precipitated Silica Revenue (USD Million) By Application (2021-2032)
Figure 30. North America Food Grade Precipitated Silica Revenue (USD Million) By Product (2021-2032)
Figure 31. Europe Food Grade Precipitated Silica Revenue (USD Million) By Type (2021-2032)
Figure 32. Europe Food Grade Precipitated Silica Revenue (USD Million) By Application (2021-2032)
Figure 33. Europe Food Grade Precipitated Silica Revenue (USD Million) By Product (2021-2032)
Figure 34. Asia Pacific Food Grade Precipitated Silica Revenue (USD Million) By Type (2021-2032)
Figure 35. Asia Pacific Food Grade Precipitated Silica Revenue (USD Million) By Application (2021-2032)
Figure 36. Asia Pacific Food Grade Precipitated Silica Revenue (USD Million) By Product (2021-2032)
Figure 37. South America Food Grade Precipitated Silica Revenue (USD Million) By Type (2021-2032)
Figure 38. South America Food Grade Precipitated Silica Revenue (USD Million) By Application (2021-2032)
Figure 39. South America Food Grade Precipitated Silica Revenue (USD Million) By Product (2021-2032)
Figure 40. Middle East and Africa Food Grade Precipitated Silica Revenue (USD Million) By Type (2021-2032)
Figure 41. Middle East and Africa Food Grade Precipitated Silica Revenue (USD Million) By Application (2021-2032)
Figure 42. Middle East and Africa Food Grade Precipitated Silica Revenue (USD Million) By Product (2021-2032)
By Product
Powdered Form
Granular Form
By Application
Food Additives
Beverages
Bakery Products
By End-User
Food and Beverage
Packaging
Countries Analyzed
North America (US, Canada, Mexico)
Europe (Germany, UK, France, Spain, Italy, Russia, Rest of Europe)
Asia Pacific (China, India, Japan, South Korea, Australia, South East Asia, Rest of Asia)
South America (Brazil, Argentina, Rest of South America)
Middle East and Africa (Saudi Arabia, UAE, Rest of Middle East, South Africa, Egypt, Rest of Africa)
