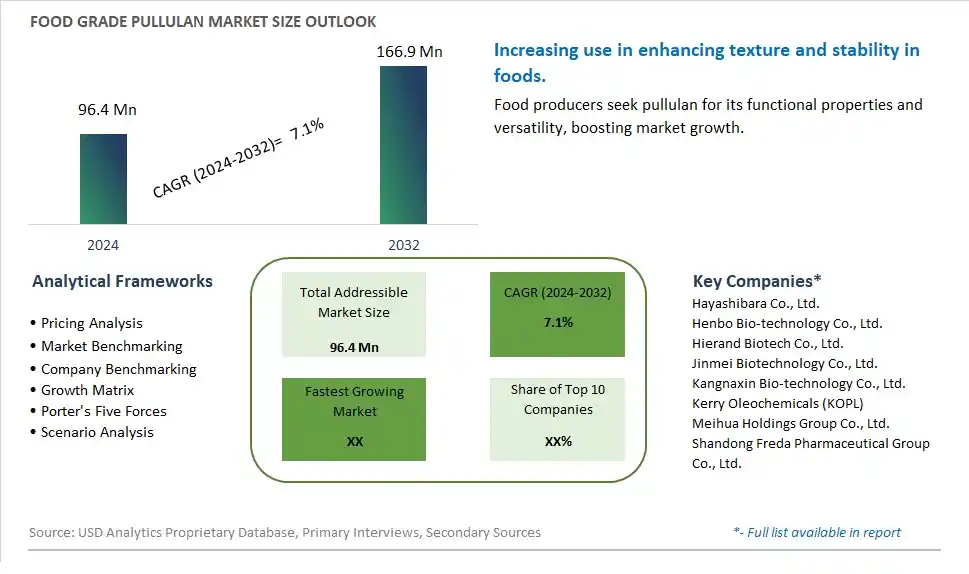
Global Food Grade Pullulan Market Size is valued at $96.4 Million in 2024 and is forecast to register a growth rate (CAGR) of 7.1% to reach $166.9 Million by 2032.
The global Food Grade Pullulan Market Comprehensive Study analyzes and forecasts the market size across 6 regions and 24 countries for diverse segments -By Type (High Purity, Regular), By Application (Preservative, Forming Agent, Quality Improver, Others)
An Introduction to Food Grade Pullulan Market
The Food Grade Pullulan market in 2024 is experiencing significant growth, driven by the increasing demand for natural and biodegradable ingredients in food packaging and edible films. Food grade pullulan, a polysaccharide produced by fermentation, is used as a film-forming agent, coating, and stabilizer in various applications. The market benefits from advancements in fermentation and processing technologies, the growing trend of sustainable and eco-friendly packaging, and the expansion of the functional food and beverage sectors. Additionally, the rising awareness of the environmental benefits of pullulan is contributing to market growth.
Food Grade Pullulan Competitive Landscape
The market report analyses the leading companies in the industry including Hayashibara Co., Ltd., Henbo Bio-technology Co., Ltd., Hierand Biotech Co., Ltd., Jinmei Biotechnology Co., Ltd., Kangnaxin Bio-technology Co., Ltd., Kerry Oleochemicals (KOPL), Meihua Holdings Group Co., Ltd., Shandong Freda Pharmaceutical Group Co., Ltd., and Others.
Food Grade Pullulan Market Dynamics
Food Grade Pullulan Market Trend: Increasing Demand for Edible Films and Coatings
The most prominent trend in the Food Grade Pullulan Market is the increasing demand for edible films and coatings. Pullulan, a natural polysaccharide, is widely used in the food industry for its film-forming properties. This trend is driven by the need for innovative packaging solutions that enhance the shelf life and quality of food products while being environmentally friendly and safe for consumption.
Food Grade Pullulan Market Driver: Rising Popularity of Functional Ingredients
The key driver of the Food Grade Pullulan Market is the rising popularity of functional ingredients. Consumers are seeking food products that offer additional health benefits, such as improved digestion, enhanced nutrition, and better overall wellness. Pullulan's unique properties make it an attractive ingredient for functional foods, dietary supplements, and health-focused products, thereby driving its demand in the market.
Food Grade Pullulan Market Opportunity: Expansion into Health and Wellness Products
A significant opportunity in the Food Grade Pullulan Market lies in the expansion into health and wellness products. As the health and wellness trend continues to grow, there is potential for developing new food products that leverage pullulan's beneficial properties. Companies can create innovative applications, such as probiotics encapsulation, low-calorie sweeteners, and nutrient-dense snacks, to meet the evolving needs of health-conscious consumers and capture a larger market share.
Food Grade Pullulan Market Share Analysis: Regular segment generated the highest revenue share in the industry
In the Food Grade Pullulan market, the Regular type emerges as the largest segment. Regular pullulan is widely utilized in the food industry for its excellent film-forming properties, which contribute to its applications as a coating agent, encapsulant, and stabilizer. This type of pullulan is valued for its versatility in enhancing food appearance, texture, and shelf life without imparting flavor or altering the sensory attributes of products. Regular pullulan is particularly favored in confectionery, pharmaceuticals, and dietary supplements due to its ability to form transparent films that protect against moisture, oxygen, and microbial contamination, thereby extending the shelf stability of food and pharmaceutical products.
Food Grade Pullulan Market Share Analysis: Quality Improver is the fastest growing segment over the forecast period to 2032
The Quality Improver application segment is forecasted to be the fastest growing in the Food Grade Pullulan market through 2032. Pullulan's role as a quality improver revolves around its ability to enhance the texture, appearance, and overall sensory experience of food products. As consumer demand for clean label and natural ingredients continues to rise, pullulan offers a natural alternative to synthetic additives and preservatives. Its applications in improving the quality attributes of food products, such as texture modification, moisture retention, and stability enhancement, drive its adoption across various segments including bakery, beverages, and processed foods. Regulatory approvals for its safe use in food applications further bolster its market growth, positioning pullulan as a pivotal ingredient in enhancing product quality and consumer satisfaction.
Food Grade Pullulan Market Segmentation
By Type
High Purity
Regular
By Application
Preservative
Forming Agent
Quality Improver
Others
Countries Analyzed
North America (US, Canada, Mexico)
Europe (Germany, UK, France, Spain, Italy, Russia, Rest of Europe)
Asia Pacific (China, India, Japan, South Korea, Australia, South East Asia, Rest of Asia)
South America (Brazil, Argentina, Rest of South America)
Middle East and Africa (Saudi Arabia, UAE, Rest of Middle East, South Africa, Egypt, Rest of Africa)
Food Grade Pullulan Companies Profiled in the Study
Hayashibara Co., Ltd.
Henbo Bio-technology Co., Ltd.
Hierand Biotech Co., Ltd.
Jinmei Biotechnology Co., Ltd.
Kangnaxin Bio-technology Co., Ltd.
Kerry Oleochemicals (KOPL)
Meihua Holdings Group Co., Ltd.
Shandong Freda Pharmaceutical Group Co., Ltd.
*- List Not Exhaustive
Chapter 1. TABLE OF CONTENTS
Chapter 2. Introduction to Food Grade Pullulan Market
2.1. Market Overview
2.2. Key Statistics and Report Highlights
2.3. Scope of the Comprehensive Study
2.3.1. Market Definition
2.3.2 Countries and Regions Covered
2.3.3 Research Objective
2.3.4 Units, Currency, and Conversions
2.3.5 Industry Value Chain
2.4. Key Market Segments
2.5. Key Companies
2.6. Study Period
Chapter 3. Strategic Analysis Review
3.1. Food Grade Pullulan Pricing Analysis and Forecast
3.2. Porter’s Five Forces
3.3. Market Ecosystem
3.4. SWOT Analysis
3.5. Regulatory Scenario
3.3. Effects of Inflation, Russia-Ukraine War, moderating economic growth, and other macroeconomic factors
Chapter 4. Competitive Landscape
4.1. Market Share Analysis
4.1.1. Global Food Grade Pullulan Market Share by Company, 2023
4.1.2. Product Offerings of Leading Food Grade Pullulan Companies
4.2. Market Entropy
4.2.1. New Product Launches in the Industry
4.2.2. Mergers, Acquisitions, Joint ventures, and Partnerships
4.3. Key Strategies and Best Practices
Chapter 5. Global Market Projections: Best, Reference, and Low Case Scenarios
5.1. Growth Analysis- Case Scenario Definitions
5.2. Low Growth Case Scenario Forecasts
5.3. Reference Growth Case Scenario Forecasts
5.4. High Growth Case Scenario Forecasts
Chapter 6. Market Dynamics
6.1. Food Grade Pullulan Market Drivers
6.2. Food Grade Pullulan Market Challenges
6.6. Food Grade Pullulan Market Opportunities
6.4. Food Grade Pullulan Market Trends
Chapter 7. Global Food Grade Pullulan Market Outlook Trends
7.1. Global Food Grade Pullulan Revenue (USD Million) and CAGR (%) by Type (2021-2032)
7.2. Global Food Grade Pullulan Revenue (USD Million) and CAGR (%) by Application (2021-2032)
7.3. Global Food Grade Pullulan Revenue (USD Million) and CAGR (%) by Product (2021-2032)
By Type
High Purity
Regular
By Application
Preservative
Forming Agent
Quality Improver
Others
Chapter 8. Global Food Grade Pullulan Regional Analysis and Outlook
8.1. Global Food Grade Pullulan Revenue (USD Million) By Regions (2021- 2032)
8.2. North America Food Grade Pullulan Revenue (USD Million) by Country (2021-2032)
8.2.1. United States Food Grade Pullulan Regional Analysis and Outlook
8.2.2. Canada Food Grade Pullulan Regional Analysis and Outlook
8.2.3. Mexico Food Grade Pullulan Regional Analysis and Outlook
8.3. Europe Food Grade Pullulan Revenue (USD Million), by Country (2021-2032)
8.3.1. Germany Food Grade Pullulan Regional Analysis and Outlook
8.3.2. France Food Grade Pullulan Regional Analysis and Outlook
8.3.3. United Kingdom Food Grade Pullulan Regional Analysis and Outlook
8.3.4. Spain Food Grade Pullulan Regional Analysis and Outlook
8.3.5. Italy Food Grade Pullulan Regional Analysis and Outlook
8.3.6. Russia Food Grade Pullulan Regional Analysis and Outlook
8.3.7. Rest of Europe Food Grade Pullulan Regional Analysis and Outlook
8.4. Asia Pacific Food Grade Pullulan Revenue (USD Million) by Country (2021-2032)
8.4.1. China Food Grade Pullulan Regional Analysis and Outlook
8.4.2. Japan Food Grade Pullulan Regional Analysis and Outlook
8.4.3. India Food Grade Pullulan Regional Analysis and Outlook
8.4.4. South Korea Food Grade Pullulan Regional Analysis and Outlook
8.4.5. Australia Food Grade Pullulan Regional Analysis and Outlook
8.4.6. South East Asia Food Grade Pullulan Regional Analysis and Outlook
8.4.7. Rest of Asia Pacific Food Grade Pullulan Regional Analysis and Outlook
8.5. South America Food Grade Pullulan Revenue (USD Million), by Country (2021-2032)
8.5.1. Brazil Food Grade Pullulan Regional Analysis and Outlook
8.5.2. Argentina Food Grade Pullulan Regional Analysis and Outlook
8.5.3. Rest of South America Food Grade Pullulan Regional Analysis and Outlook
8.6. Middle East and Africa Food Grade Pullulan Revenue (USD Million) by Country (2021-2032)
8.6.1. Middle East Food Grade Pullulan Regional Analysis and Outlook
8.6.2. Africa Food Grade Pullulan Regional Analysis and Outlook
Chapter 9. North America Food Grade Pullulan Analysis and Outlook
9.1. North America Food Grade Pullulan Revenue (USD Million) by Segments (2021-2032)
9.1.1. North America Food Grade Pullulan Revenue (USD Million) by Type (2021-2032)
9.1.2. North America Food Grade Pullulan Revenue (USD Million) by Application (2021-2032)
9.1.3. North America Food Grade Pullulan Revenue (USD Million) by Product (2021-2032)
By Type
High Purity
Regular
By Application
Preservative
Forming Agent
Quality Improver
Others
Chapter 10. Europe Food Grade Pullulan Analysis and Outlook
10.1. Europe Food Grade Pullulan Revenue (USD Million), by Segments (USD Million) (2021-2032)
10.1.1. Europe Food Grade Pullulan Revenue (USD Million) by Type (2021-2032)
10.1.2. Europe Food Grade Pullulan Revenue (USD Million) by Application (2021-2032)
10.1.3. Europe Food Grade Pullulan Revenue (USD Million) by Product (2021-2032)
By Type
High Purity
Regular
By Application
Preservative
Forming Agent
Quality Improver
Others
Chapter 11. Asia Pacific Food Grade Pullulan Analysis and Outlook
11.1. Asia Pacific Food Grade Pullulan Revenue (USD Million), and Revenue (USD Million) by Segments (2021-2032)
11.1.1. Asia Pacific Food Grade Pullulan Revenue (USD Million) by Type (2021-2032)
11.1.2. Asia Pacific Food Grade Pullulan Revenue (USD Million) by Application (2021-2032)
11.1.3. Asia Pacific Food Grade Pullulan Revenue (USD Million) by Product (2021-2032)
By Type
High Purity
Regular
By Application
Preservative
Forming Agent
Quality Improver
Others
Chapter 12. South America Food Grade Pullulan Analysis and Outlook
12.1. South America Food Grade Pullulan Revenue (USD Million), by Segments (2021-2032)
12.1.1. South America Food Grade Pullulan Revenue (USD Million) by Type (2021-2032)
12.1.2. South America Food Grade Pullulan Revenue (USD Million) by Application (2021-2032)
12.1.3. South America Food Grade Pullulan Revenue (USD Million) by Product (2021-2032)
By Type
High Purity
Regular
By Application
Preservative
Forming Agent
Quality Improver
Others
Chapter 13. Middle East and Africa Food Grade Pullulan Analysis and Outlook
13.1. Middle East and Africa Food Grade Pullulan Revenue (USD Million), by Segments (2021-2032)
13.1.1. Middle East and Africa Food Grade Pullulan Revenue (USD Million) by Type (2021-2032)
13.1.2. Middle East and Africa Food Grade Pullulan Revenue (USD Million) by Application (2021-2032)
13.1.3. Middle East and Africa Food Grade Pullulan Revenue (USD Million) by Product (2021-2032)
By Type
High Purity
Regular
By Application
Preservative
Forming Agent
Quality Improver
Others
Chapter 14. Food Grade Pullulan Company Profiles
14.1 Business Overview
14.2 Product Profiles
14.3 SWOT Profiles
14.5 Recent Developments
14.6 Financial Profile
List of Companies
Hayashibara Co., Ltd.
Henbo Bio-technology Co., Ltd.
Hierand Biotech Co., Ltd.
Jinmei Biotechnology Co., Ltd.
Kangnaxin Bio-technology Co., Ltd.
Kerry Oleochemicals (KOPL)
Meihua Holdings Group Co., Ltd.
Shandong Freda Pharmaceutical Group Co., Ltd.
15. Methodology and Data Sources
15.1 Customization Offerings
15.2 Subscription Services
15.3 Related Reports
15.4 Publisher Expertise
LIST OF TABLES
Table 1 Market Segmentation Analysis
Table 2 Global Food Grade Pullulan Market Share of Leading Companies, 2023
Table 3 Product Offerings of Leading Companies
Table 4 Low Growth Scenario Forecasts
Table 5 Reference Case Growth Scenario
Table 6 High Growth Case Scenario
Table 7 Global Food Grade Pullulan Revenue (USD Million) And CAGR (%) By Type (2021-2032)
Table 8 Global Food Grade Pullulan Revenue (USD Million) And CAGR (%) By Application (2021-2032)
Table 9 Global Food Grade Pullulan Revenue (USD Million) And CAGR (%) By Product (2021-2032)
Table 10 Global Food Grade Pullulan Market Revenue (USD Million) By Regions (2021-2032)
Table 11 Global Food Grade Pullulan Market Share (%) By Regions (2021-2032)
Table 12 North America Food Grade Pullulan Revenue (USD Million) By Country (2021-2032)
Table 13 Europe Food Grade Pullulan Revenue (USD Million) By Country (2021-2032)
Table 14 Asia Pacific Food Grade Pullulan Revenue (USD Million) By Country (2021-2032)
Table 15 South America Food Grade Pullulan Revenue (USD Million) By Country (2021-2032)
Table 16 Middle East and Africa Food Grade Pullulan Revenue (USD Million) By Region (2021-2032)
Table 17 North America Food Grade Pullulan Revenue (USD Million) By Type (2021-2032)
Table 18 North America Food Grade Pullulan Revenue (USD Million) By Application (2021-2032)
Table 19 North America Food Grade Pullulan Revenue (USD Million) By Product (2021-2032)
Table 20 Europe Food Grade Pullulan Revenue (USD Million) By Type (2021-2032)
Table 21 Europe Food Grade Pullulan Revenue (USD Million) By Application (2021-2032)
Table 22 Europe Food Grade Pullulan Revenue (USD Million) By Product (2021-2032)
Table 23 Asia Pacific Food Grade Pullulan Revenue (USD Million) By Type (2021-2032)
Table 24 Asia Pacific Food Grade Pullulan Revenue (USD Million) By Application (2021-2032)
Table 25 Asia Pacific Food Grade Pullulan Revenue (USD Million) By Product (2021-2032)
Table 26 South America Food Grade Pullulan Revenue (USD Million) By Type (2021-2032)
Table 27 South America Food Grade Pullulan Revenue (USD Million) By Application (2021-2032)
Table 28 South America Food Grade Pullulan Revenue (USD Million) By Product (2021-2032)
Table 29 Middle East and Africa Food Grade Pullulan Revenue (USD Million) By Type (2021-2032)
Table 30 Middle East and Africa Food Grade Pullulan Revenue (USD Million) By Application (2021-2032)
Table 31 Middle East and Africa Food Grade Pullulan Revenue (USD Million) By Product (2021-2032)
LIST OF FIGURES
Figure 1. Market Scope
Figure 2. Pricing Forecasts Per Unit, 2023- 2032
Figure 3. Porter’s Five Forces
Figure 4. Global Food Grade Pullulan Market Revenue (USD Million) By Regions (2021-2032)
Figure 5. Global Food Grade Pullulan Market Share (%) By Regions (2023)
Figure 6. North America Food Grade Pullulan Revenue (USD Million) By Country (2021-2032)
Figure 7. United States Food Grade Pullulan Revenue (USD Million) By Country (2021-2032)
Figure 8. Canada Food Grade Pullulan Revenue (USD Million) By Country (2021-2032)
Figure 9. Mexico Food Grade Pullulan Revenue (USD Million) By Country (2021-2032)
Figure 10. Europe Food Grade Pullulan Revenue (USD Million) By Country (2021-2032)
Figure 11. Germany Food Grade Pullulan Revenue (USD Million) By Country (2021-2032)
Figure 12. France Food Grade Pullulan Revenue (USD Million) By Country (2021-2032)
Figure 13. United Kingdom Food Grade Pullulan Revenue (USD Million) By Country (2021-2032)
Figure 14. Spain Food Grade Pullulan Revenue (USD Million) By Country (2021-2032)
Figure 15. Italy Food Grade Pullulan Revenue (USD Million) By Country (2021-2032)
Figure 16. Russia Food Grade Pullulan Revenue (USD Million) By Country (2021-2032)
Figure 17. Rest of Europe Food Grade Pullulan Revenue (USD Million) By Country (2021-2032)
Figure 11. Asia Pacific Food Grade Pullulan Revenue (USD Million) By Country (2021-2032)
Figure 12. China Food Grade Pullulan Revenue (USD Million) By Country (2021-2032)
Figure 13. Japan Food Grade Pullulan Revenue (USD Million) By Country (2021-2032)
Figure 14. India Food Grade Pullulan Revenue (USD Million) By Country (2021-2032)
Figure 15. South Korea Food Grade Pullulan Revenue (USD Million) By Country (2021-2032)
Figure 16. Australia Food Grade Pullulan Revenue (USD Million) By Country (2021-2032)
Figure 17. South East Asia Food Grade Pullulan Revenue (USD Million) By Country (2021-2032)
Figure 18. South America Food Grade Pullulan Revenue (USD Million) By Country (2021-2032)
Figure 19. Brazil Food Grade Pullulan Revenue (USD Million) By Country (2021-2032)
Figure 20. Argentina Food Grade Pullulan Revenue (USD Million) By Country (2021-2032)
Figure 21. Rest of Asia Pacific Food Grade Pullulan Revenue (USD Million) By Country (2021-2032)
Figure 22. Middle East and Africa Food Grade Pullulan Revenue (USD Million) By Region (2021-2032)
Figure 23. Saudi Arabia Food Grade Pullulan Revenue (USD Million) By Region (2021-2032)
Figure 24. The UAE Food Grade Pullulan Revenue (USD Million) By Region (2021-2032)
Figure 25. Rest of Middle East Food Grade Pullulan Revenue (USD Million) By Region (2021-2032)
Figure 26. South Africa Food Grade Pullulan Revenue (USD Million) By Region (2021-2032)
Figure 27. Africa Food Grade Pullulan Revenue (USD Million) By Region (2021-2032)
Figure 28. North America Food Grade Pullulan Revenue (USD Million) By Type (2021-2032)
Figure 29. North America Food Grade Pullulan Revenue (USD Million) By Application (2021-2032)
Figure 30. North America Food Grade Pullulan Revenue (USD Million) By Product (2021-2032)
Figure 31. Europe Food Grade Pullulan Revenue (USD Million) By Type (2021-2032)
Figure 32. Europe Food Grade Pullulan Revenue (USD Million) By Application (2021-2032)
Figure 33. Europe Food Grade Pullulan Revenue (USD Million) By Product (2021-2032)
Figure 34. Asia Pacific Food Grade Pullulan Revenue (USD Million) By Type (2021-2032)
Figure 35. Asia Pacific Food Grade Pullulan Revenue (USD Million) By Application (2021-2032)
Figure 36. Asia Pacific Food Grade Pullulan Revenue (USD Million) By Product (2021-2032)
Figure 37. South America Food Grade Pullulan Revenue (USD Million) By Type (2021-2032)
Figure 38. South America Food Grade Pullulan Revenue (USD Million) By Application (2021-2032)
Figure 39. South America Food Grade Pullulan Revenue (USD Million) By Product (2021-2032)
Figure 40. Middle East and Africa Food Grade Pullulan Revenue (USD Million) By Type (2021-2032)
Figure 41. Middle East and Africa Food Grade Pullulan Revenue (USD Million) By Application (2021-2032)
Figure 42. Middle East and Africa Food Grade Pullulan Revenue (USD Million) By Product (2021-2032)
By Type
High Purity
Regular
By Application
Preservative
Forming Agent
Quality Improver
Others
Countries Analyzed
North America (US, Canada, Mexico)
Europe (Germany, UK, France, Spain, Italy, Russia, Rest of Europe)
Asia Pacific (China, India, Japan, South Korea, Australia, South East Asia, Rest of Asia)
South America (Brazil, Argentina, Rest of South America)
Middle East and Africa (Saudi Arabia, UAE, Rest of Middle East, South Africa, Egypt, Rest of Africa)
