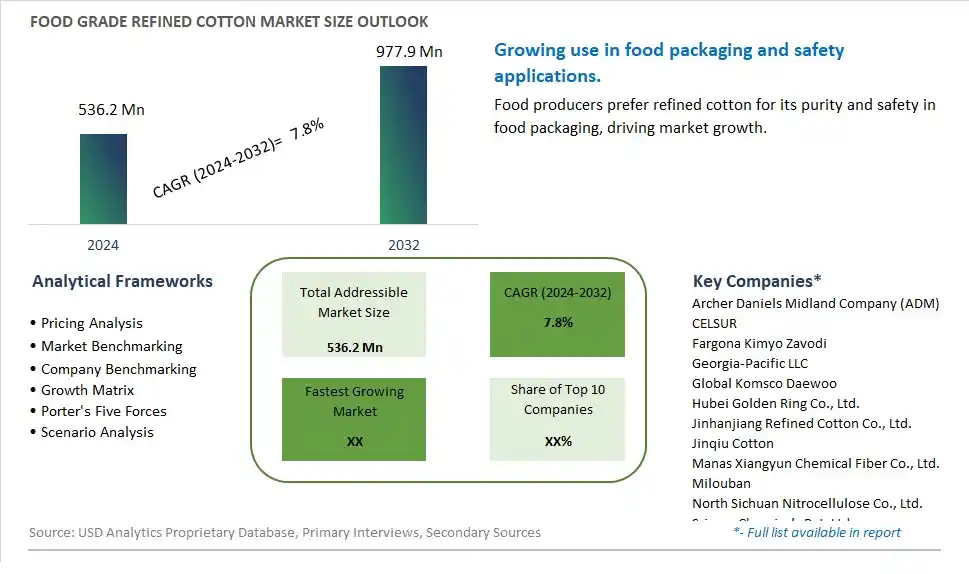
Global Food Grade Refined Cotton Market Size is valued at $536.2 Million in 2024 and is forecast to register a growth rate (CAGR) of 7.8% to reach $977.9 Million by 2032.
The global Food Grade Refined Cotton Market Comprehensive Study analyzes and forecasts the market size across 6 regions and 24 countries for diverse segments -By Type (Organic, Traditional), By Application (Food, Animal Feed, Others)
An Introduction to Food Grade Refined Cotton Market
In 2024, the Food Grade Refined Cotton market is thriving, fueled by the rising demand for cellulose derivatives used in food processing and packaging. Food grade refined cotton, processed into cellulose gum and other derivatives, is used as a thickening, stabilizing, and emulsifying agent in various food products. The market benefits from advancements in cotton refining and cellulose extraction technologies, the growing trend of clean label and natural ingredients, and the expansion of the global food processing sector. Additionally, the increasing focus on food safety and quality assurance is driving market growth.
Food Grade Refined Cotton Competitive Landscape
The market report analyses the leading companies in the industry including Archer Daniels Midland Company (ADM), CELSUR, Fargona Kimyo Zavodi, Georgia-Pacific LLC, Global Komsco Daewoo, Hubei Golden Ring Co., Ltd., Jinhanjiang Refined Cotton Co., Ltd., Jinqiu Cotton, Manas Xiangyun Chemical Fiber Co., Ltd., Milouban, North Sichuan Nitrocellulose Co., Ltd., Sriman Chemicals Pvt. Ltd., Swan Fiber (CHTC), Xinjiang Sunork Cotton Industry, Xinxiang T.N.C Chemical Co., Ltd., Zibo Huawei Biotechnology Co., Ltd., and Others.
Food Grade Refined Cotton Market Dynamics
Food Grade Refined Cotton Market Trend: Adoption of Eco-Friendly Ingredients
The most prominent trend in the Food Grade Refined Cotton Market is the adoption of eco-friendly ingredients. Consumers and manufacturers are increasingly seeking sustainable and biodegradable raw materials for food products. Refined cotton, used in cellulose production, aligns with this trend by offering a renewable and environmentally friendly ingredient option for various food applications, such as thickeners, stabilizers, and emulsifiers.
Food Grade Refined Cotton Market Driver: Growth in Processed and Packaged Foods
The key driver of the Food Grade Refined Cotton Market is the growth in processed and packaged foods. As consumer demand for convenience foods continues to rise, there is a corresponding increase in the need for food-grade ingredients that enhance texture, stability, and shelf life. Refined cotton-derived cellulose meets these requirements, making it a crucial component in the processed food industry.
Food Grade Refined Cotton Market Opportunity: Development of Innovative Food Applications
A significant opportunity in the Food Grade Refined Cotton Market lies in the development of innovative food applications. By exploring new uses for refined cotton in food formulations, such as plant-based meat alternatives, gluten-free products, and functional foods, companies can expand their product offerings and cater to emerging consumer trends. Investing in research and development to create unique and high-value applications can help drive market growth and differentiation.
Food Grade Refined Cotton Market Share Analysis: Traditional segment generated the highest revenue share in the industry
In the Food Grade Refined Cotton market, the Traditional type stands out as the largest segment. Traditional refined cotton is widely used across various industries due to its versatility and established production processes. It is primarily employed in food applications such as cooking oils, salad dressings, and food additives. Traditional refined cotton is valued for its neutral taste and odor, making it suitable for enhancing the texture and stability of food products without altering their natural flavors. Its long-standing presence in the market and widespread acceptance in food processing industries underline its significance as a reliable ingredient.
Food Grade Refined Cotton Market Share Analysis: Food is the fastest growing segment over the forecast period to 2032
The Food application segment is projected to be the fastest growing in the Food Grade Refined Cotton market up to 2032. Refined cotton finds expanding use in food applications owing to its benefits such as high purity, low impurities, and excellent absorbency properties. In food processing, refined cotton serves as a crucial component in various forms, including cooking oils, bakery products, and snack foods. As consumer preferences shift towards healthier and natural ingredients, refined cotton offers a compelling alternative to synthetic additives, contributing to its growing adoption in the food industry. Additionally, advancements in refining technologies and stringent quality standards further propel the demand for food-grade refined cotton, positioning it for robust growth in the coming years.
Food Grade Refined Cotton Market Segmentation
By Type
Organic
Traditional
By Application
Food
Animal Feed
Others
Countries Analyzed
North America (US, Canada, Mexico)
Europe (Germany, UK, France, Spain, Italy, Russia, Rest of Europe)
Asia Pacific (China, India, Japan, South Korea, Australia, South East Asia, Rest of Asia)
South America (Brazil, Argentina, Rest of South America)
Middle East and Africa (Saudi Arabia, UAE, Rest of Middle East, South Africa, Egypt, Rest of Africa)
Food Grade Refined Cotton Companies Profiled in the Study
Archer Daniels Midland Company (ADM)
CELSUR
Fargona Kimyo Zavodi
Georgia-Pacific LLC
Global Komsco Daewoo
Hubei Golden Ring Co., Ltd.
Jinhanjiang Refined Cotton Co., Ltd.
Jinqiu Cotton
Manas Xiangyun Chemical Fiber Co., Ltd.
Milouban
North Sichuan Nitrocellulose Co., Ltd.
Sriman Chemicals Pvt. Ltd.
Swan Fiber (CHTC)
Xinjiang Sunork Cotton Industry
Xinxiang T.N.C Chemical Co., Ltd.
Zibo Huawei Biotechnology Co., Ltd.
*- List Not Exhaustive
Chapter 1. TABLE OF CONTENTS
Chapter 2. Introduction to Food Grade Refined Cotton Market
2.1. Market Overview
2.2. Key Statistics and Report Highlights
2.3. Scope of the Comprehensive Study
2.3.1. Market Definition
2.3.2 Countries and Regions Covered
2.3.3 Research Objective
2.3.4 Units, Currency, and Conversions
2.3.5 Industry Value Chain
2.4. Key Market Segments
2.5. Key Companies
2.6. Study Period
Chapter 3. Strategic Analysis Review
3.1. Food Grade Refined Cotton Pricing Analysis and Forecast
3.2. Porter’s Five Forces
3.3. Market Ecosystem
3.4. SWOT Analysis
3.5. Regulatory Scenario
3.3. Effects of Inflation, Russia-Ukraine War, moderating economic growth, and other macroeconomic factors
Chapter 4. Competitive Landscape
4.1. Market Share Analysis
4.1.1. Global Food Grade Refined Cotton Market Share by Company, 2023
4.1.2. Product Offerings of Leading Food Grade Refined Cotton Companies
4.2. Market Entropy
4.2.1. New Product Launches in the Industry
4.2.2. Mergers, Acquisitions, Joint ventures, and Partnerships
4.3. Key Strategies and Best Practices
Chapter 5. Global Market Projections: Best, Reference, and Low Case Scenarios
5.1. Growth Analysis- Case Scenario Definitions
5.2. Low Growth Case Scenario Forecasts
5.3. Reference Growth Case Scenario Forecasts
5.4. High Growth Case Scenario Forecasts
Chapter 6. Market Dynamics
6.1. Food Grade Refined Cotton Market Drivers
6.2. Food Grade Refined Cotton Market Challenges
6.6. Food Grade Refined Cotton Market Opportunities
6.4. Food Grade Refined Cotton Market Trends
Chapter 7. Global Food Grade Refined Cotton Market Outlook Trends
7.1. Global Food Grade Refined Cotton Revenue (USD Million) and CAGR (%) by Type (2021-2032)
7.2. Global Food Grade Refined Cotton Revenue (USD Million) and CAGR (%) by Application (2021-2032)
7.3. Global Food Grade Refined Cotton Revenue (USD Million) and CAGR (%) by Product (2021-2032)
By Type
Organic
Traditional
By Application
Food
Animal Feed
Others
Chapter 8. Global Food Grade Refined Cotton Regional Analysis and Outlook
8.1. Global Food Grade Refined Cotton Revenue (USD Million) By Regions (2021- 2032)
8.2. North America Food Grade Refined Cotton Revenue (USD Million) by Country (2021-2032)
8.2.1. United States Food Grade Refined Cotton Regional Analysis and Outlook
8.2.2. Canada Food Grade Refined Cotton Regional Analysis and Outlook
8.2.3. Mexico Food Grade Refined Cotton Regional Analysis and Outlook
8.3. Europe Food Grade Refined Cotton Revenue (USD Million), by Country (2021-2032)
8.3.1. Germany Food Grade Refined Cotton Regional Analysis and Outlook
8.3.2. France Food Grade Refined Cotton Regional Analysis and Outlook
8.3.3. United Kingdom Food Grade Refined Cotton Regional Analysis and Outlook
8.3.4. Spain Food Grade Refined Cotton Regional Analysis and Outlook
8.3.5. Italy Food Grade Refined Cotton Regional Analysis and Outlook
8.3.6. Russia Food Grade Refined Cotton Regional Analysis and Outlook
8.3.7. Rest of Europe Food Grade Refined Cotton Regional Analysis and Outlook
8.4. Asia Pacific Food Grade Refined Cotton Revenue (USD Million) by Country (2021-2032)
8.4.1. China Food Grade Refined Cotton Regional Analysis and Outlook
8.4.2. Japan Food Grade Refined Cotton Regional Analysis and Outlook
8.4.3. India Food Grade Refined Cotton Regional Analysis and Outlook
8.4.4. South Korea Food Grade Refined Cotton Regional Analysis and Outlook
8.4.5. Australia Food Grade Refined Cotton Regional Analysis and Outlook
8.4.6. South East Asia Food Grade Refined Cotton Regional Analysis and Outlook
8.4.7. Rest of Asia Pacific Food Grade Refined Cotton Regional Analysis and Outlook
8.5. South America Food Grade Refined Cotton Revenue (USD Million), by Country (2021-2032)
8.5.1. Brazil Food Grade Refined Cotton Regional Analysis and Outlook
8.5.2. Argentina Food Grade Refined Cotton Regional Analysis and Outlook
8.5.3. Rest of South America Food Grade Refined Cotton Regional Analysis and Outlook
8.6. Middle East and Africa Food Grade Refined Cotton Revenue (USD Million) by Country (2021-2032)
8.6.1. Middle East Food Grade Refined Cotton Regional Analysis and Outlook
8.6.2. Africa Food Grade Refined Cotton Regional Analysis and Outlook
Chapter 9. North America Food Grade Refined Cotton Analysis and Outlook
9.1. North America Food Grade Refined Cotton Revenue (USD Million) by Segments (2021-2032)
9.1.1. North America Food Grade Refined Cotton Revenue (USD Million) by Type (2021-2032)
9.1.2. North America Food Grade Refined Cotton Revenue (USD Million) by Application (2021-2032)
9.1.3. North America Food Grade Refined Cotton Revenue (USD Million) by Product (2021-2032)
By Type
Organic
Traditional
By Application
Food
Animal Feed
Others
Chapter 10. Europe Food Grade Refined Cotton Analysis and Outlook
10.1. Europe Food Grade Refined Cotton Revenue (USD Million), by Segments (USD Million) (2021-2032)
10.1.1. Europe Food Grade Refined Cotton Revenue (USD Million) by Type (2021-2032)
10.1.2. Europe Food Grade Refined Cotton Revenue (USD Million) by Application (2021-2032)
10.1.3. Europe Food Grade Refined Cotton Revenue (USD Million) by Product (2021-2032)
By Type
Organic
Traditional
By Application
Food
Animal Feed
Others
Chapter 11. Asia Pacific Food Grade Refined Cotton Analysis and Outlook
11.1. Asia Pacific Food Grade Refined Cotton Revenue (USD Million), and Revenue (USD Million) by Segments (2021-2032)
11.1.1. Asia Pacific Food Grade Refined Cotton Revenue (USD Million) by Type (2021-2032)
11.1.2. Asia Pacific Food Grade Refined Cotton Revenue (USD Million) by Application (2021-2032)
11.1.3. Asia Pacific Food Grade Refined Cotton Revenue (USD Million) by Product (2021-2032)
By Type
Organic
Traditional
By Application
Food
Animal Feed
Others
Chapter 12. South America Food Grade Refined Cotton Analysis and Outlook
12.1. South America Food Grade Refined Cotton Revenue (USD Million), by Segments (2021-2032)
12.1.1. South America Food Grade Refined Cotton Revenue (USD Million) by Type (2021-2032)
12.1.2. South America Food Grade Refined Cotton Revenue (USD Million) by Application (2021-2032)
12.1.3. South America Food Grade Refined Cotton Revenue (USD Million) by Product (2021-2032)
By Type
Organic
Traditional
By Application
Food
Animal Feed
Others
Chapter 13. Middle East and Africa Food Grade Refined Cotton Analysis and Outlook
13.1. Middle East and Africa Food Grade Refined Cotton Revenue (USD Million), by Segments (2021-2032)
13.1.1. Middle East and Africa Food Grade Refined Cotton Revenue (USD Million) by Type (2021-2032)
13.1.2. Middle East and Africa Food Grade Refined Cotton Revenue (USD Million) by Application (2021-2032)
13.1.3. Middle East and Africa Food Grade Refined Cotton Revenue (USD Million) by Product (2021-2032)
By Type
Organic
Traditional
By Application
Food
Animal Feed
Others
Chapter 14. Food Grade Refined Cotton Company Profiles
14.1 Business Overview
14.2 Product Profiles
14.3 SWOT Profiles
14.5 Recent Developments
14.6 Financial Profile
List of Companies
Archer Daniels Midland Company (ADM)
CELSUR
Fargona Kimyo Zavodi
Georgia-Pacific LLC
Global Komsco Daewoo
Hubei Golden Ring Co., Ltd.
Jinhanjiang Refined Cotton Co., Ltd.
Jinqiu Cotton
Manas Xiangyun Chemical Fiber Co., Ltd.
Milouban
North Sichuan Nitrocellulose Co., Ltd.
Sriman Chemicals Pvt. Ltd.
Swan Fiber (CHTC)
Xinjiang Sunork Cotton Industry
Xinxiang T.N.C Chemical Co., Ltd.
Zibo Huawei Biotechnology Co., Ltd.
15. Methodology and Data Sources
15.1 Customization Offerings
15.2 Subscription Services
15.3 Related Reports
15.4 Publisher Expertise
LIST OF TABLES
Table 1 Market Segmentation Analysis
Table 2 Global Food Grade Refined Cotton Market Share of Leading Companies, 2023
Table 3 Product Offerings of Leading Companies
Table 4 Low Growth Scenario Forecasts
Table 5 Reference Case Growth Scenario
Table 6 High Growth Case Scenario
Table 7 Global Food Grade Refined Cotton Revenue (USD Million) And CAGR (%) By Type (2021-2032)
Table 8 Global Food Grade Refined Cotton Revenue (USD Million) And CAGR (%) By Application (2021-2032)
Table 9 Global Food Grade Refined Cotton Revenue (USD Million) And CAGR (%) By Product (2021-2032)
Table 10 Global Food Grade Refined Cotton Market Revenue (USD Million) By Regions (2021-2032)
Table 11 Global Food Grade Refined Cotton Market Share (%) By Regions (2021-2032)
Table 12 North America Food Grade Refined Cotton Revenue (USD Million) By Country (2021-2032)
Table 13 Europe Food Grade Refined Cotton Revenue (USD Million) By Country (2021-2032)
Table 14 Asia Pacific Food Grade Refined Cotton Revenue (USD Million) By Country (2021-2032)
Table 15 South America Food Grade Refined Cotton Revenue (USD Million) By Country (2021-2032)
Table 16 Middle East and Africa Food Grade Refined Cotton Revenue (USD Million) By Region (2021-2032)
Table 17 North America Food Grade Refined Cotton Revenue (USD Million) By Type (2021-2032)
Table 18 North America Food Grade Refined Cotton Revenue (USD Million) By Application (2021-2032)
Table 19 North America Food Grade Refined Cotton Revenue (USD Million) By Product (2021-2032)
Table 20 Europe Food Grade Refined Cotton Revenue (USD Million) By Type (2021-2032)
Table 21 Europe Food Grade Refined Cotton Revenue (USD Million) By Application (2021-2032)
Table 22 Europe Food Grade Refined Cotton Revenue (USD Million) By Product (2021-2032)
Table 23 Asia Pacific Food Grade Refined Cotton Revenue (USD Million) By Type (2021-2032)
Table 24 Asia Pacific Food Grade Refined Cotton Revenue (USD Million) By Application (2021-2032)
Table 25 Asia Pacific Food Grade Refined Cotton Revenue (USD Million) By Product (2021-2032)
Table 26 South America Food Grade Refined Cotton Revenue (USD Million) By Type (2021-2032)
Table 27 South America Food Grade Refined Cotton Revenue (USD Million) By Application (2021-2032)
Table 28 South America Food Grade Refined Cotton Revenue (USD Million) By Product (2021-2032)
Table 29 Middle East and Africa Food Grade Refined Cotton Revenue (USD Million) By Type (2021-2032)
Table 30 Middle East and Africa Food Grade Refined Cotton Revenue (USD Million) By Application (2021-2032)
Table 31 Middle East and Africa Food Grade Refined Cotton Revenue (USD Million) By Product (2021-2032)
LIST OF FIGURES
Figure 1. Market Scope
Figure 2. Pricing Forecasts Per Unit, 2023- 2032
Figure 3. Porter’s Five Forces
Figure 4. Global Food Grade Refined Cotton Market Revenue (USD Million) By Regions (2021-2032)
Figure 5. Global Food Grade Refined Cotton Market Share (%) By Regions (2023)
Figure 6. North America Food Grade Refined Cotton Revenue (USD Million) By Country (2021-2032)
Figure 7. United States Food Grade Refined Cotton Revenue (USD Million) By Country (2021-2032)
Figure 8. Canada Food Grade Refined Cotton Revenue (USD Million) By Country (2021-2032)
Figure 9. Mexico Food Grade Refined Cotton Revenue (USD Million) By Country (2021-2032)
Figure 10. Europe Food Grade Refined Cotton Revenue (USD Million) By Country (2021-2032)
Figure 11. Germany Food Grade Refined Cotton Revenue (USD Million) By Country (2021-2032)
Figure 12. France Food Grade Refined Cotton Revenue (USD Million) By Country (2021-2032)
Figure 13. United Kingdom Food Grade Refined Cotton Revenue (USD Million) By Country (2021-2032)
Figure 14. Spain Food Grade Refined Cotton Revenue (USD Million) By Country (2021-2032)
Figure 15. Italy Food Grade Refined Cotton Revenue (USD Million) By Country (2021-2032)
Figure 16. Russia Food Grade Refined Cotton Revenue (USD Million) By Country (2021-2032)
Figure 17. Rest of Europe Food Grade Refined Cotton Revenue (USD Million) By Country (2021-2032)
Figure 11. Asia Pacific Food Grade Refined Cotton Revenue (USD Million) By Country (2021-2032)
Figure 12. China Food Grade Refined Cotton Revenue (USD Million) By Country (2021-2032)
Figure 13. Japan Food Grade Refined Cotton Revenue (USD Million) By Country (2021-2032)
Figure 14. India Food Grade Refined Cotton Revenue (USD Million) By Country (2021-2032)
Figure 15. South Korea Food Grade Refined Cotton Revenue (USD Million) By Country (2021-2032)
Figure 16. Australia Food Grade Refined Cotton Revenue (USD Million) By Country (2021-2032)
Figure 17. South East Asia Food Grade Refined Cotton Revenue (USD Million) By Country (2021-2032)
Figure 18. South America Food Grade Refined Cotton Revenue (USD Million) By Country (2021-2032)
Figure 19. Brazil Food Grade Refined Cotton Revenue (USD Million) By Country (2021-2032)
Figure 20. Argentina Food Grade Refined Cotton Revenue (USD Million) By Country (2021-2032)
Figure 21. Rest of Asia Pacific Food Grade Refined Cotton Revenue (USD Million) By Country (2021-2032)
Figure 22. Middle East and Africa Food Grade Refined Cotton Revenue (USD Million) By Region (2021-2032)
Figure 23. Saudi Arabia Food Grade Refined Cotton Revenue (USD Million) By Region (2021-2032)
Figure 24. The UAE Food Grade Refined Cotton Revenue (USD Million) By Region (2021-2032)
Figure 25. Rest of Middle East Food Grade Refined Cotton Revenue (USD Million) By Region (2021-2032)
Figure 26. South Africa Food Grade Refined Cotton Revenue (USD Million) By Region (2021-2032)
Figure 27. Africa Food Grade Refined Cotton Revenue (USD Million) By Region (2021-2032)
Figure 28. North America Food Grade Refined Cotton Revenue (USD Million) By Type (2021-2032)
Figure 29. North America Food Grade Refined Cotton Revenue (USD Million) By Application (2021-2032)
Figure 30. North America Food Grade Refined Cotton Revenue (USD Million) By Product (2021-2032)
Figure 31. Europe Food Grade Refined Cotton Revenue (USD Million) By Type (2021-2032)
Figure 32. Europe Food Grade Refined Cotton Revenue (USD Million) By Application (2021-2032)
Figure 33. Europe Food Grade Refined Cotton Revenue (USD Million) By Product (2021-2032)
Figure 34. Asia Pacific Food Grade Refined Cotton Revenue (USD Million) By Type (2021-2032)
Figure 35. Asia Pacific Food Grade Refined Cotton Revenue (USD Million) By Application (2021-2032)
Figure 36. Asia Pacific Food Grade Refined Cotton Revenue (USD Million) By Product (2021-2032)
Figure 37. South America Food Grade Refined Cotton Revenue (USD Million) By Type (2021-2032)
Figure 38. South America Food Grade Refined Cotton Revenue (USD Million) By Application (2021-2032)
Figure 39. South America Food Grade Refined Cotton Revenue (USD Million) By Product (2021-2032)
Figure 40. Middle East and Africa Food Grade Refined Cotton Revenue (USD Million) By Type (2021-2032)
Figure 41. Middle East and Africa Food Grade Refined Cotton Revenue (USD Million) By Application (2021-2032)
Figure 42. Middle East and Africa Food Grade Refined Cotton Revenue (USD Million) By Product (2021-2032)
By Type
Organic
Traditional
By Application
Food
Animal Feed
Others
Countries Analyzed
North America (US, Canada, Mexico)
Europe (Germany, UK, France, Spain, Italy, Russia, Rest of Europe)
Asia Pacific (China, India, Japan, South Korea, Australia, South East Asia, Rest of Asia)
South America (Brazil, Argentina, Rest of South America)
Middle East and Africa (Saudi Arabia, UAE, Rest of Middle East, South Africa, Egypt, Rest of Africa)
