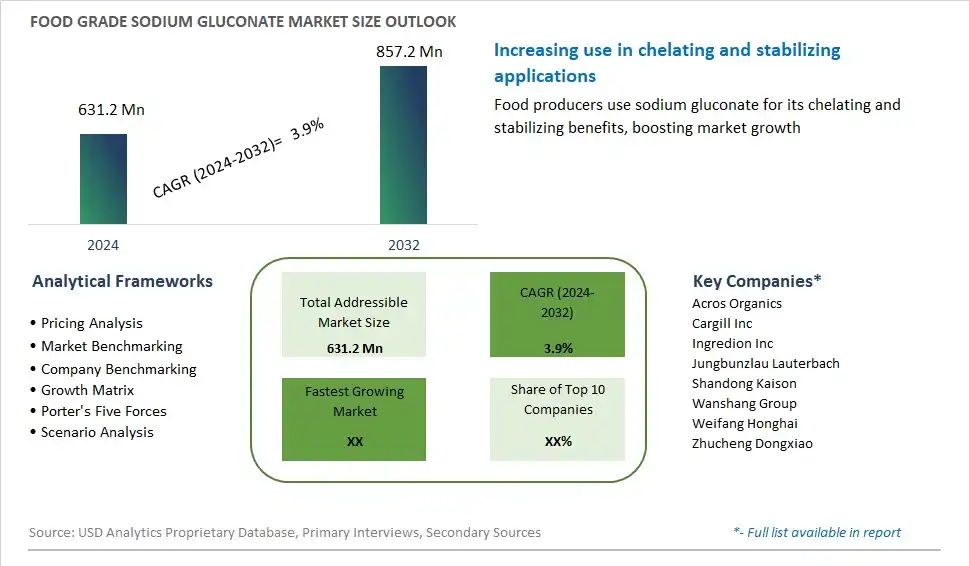
Global Food Grade Sodium Gluconate Market Size is valued at $631.2 Million in 2024 and is forecast to register a growth rate (CAGR) of 3.9% to reach $857.2 Million by 2032.
The global Food Grade Sodium Gluconate Market Comprehensive Study analyzes and forecasts the market size across 6 regions and 24 countries for diverse segments -By Application (Food and Beverages, Bakery and Confectionery, Dairy Products), By End-User (Food Manufacturers, Beverage Manufacturers), By Form (Powder, Liquid)
An Introduction to Food Grade Sodium Gluconate Market
The food grade sodium gluconate market in 2024 is witnessing robust growth, propelled by its multifunctional applications in the food and beverage industry. Sodium gluconate, a sodium salt of gluconic acid, is widely used as a sequestrant, stabilizer, and thickener. Its ability to improve the texture and stability of food products makes it essential in dairy, bakery, and meat processing. The market benefits from the increasing demand for high-quality, safe, and stable food products. Additionally, sodium gluconate is favored for its biodegradability and non-toxic nature, aligning with the growing consumer preference for natural and eco-friendly ingredients. Regulatory approvals and the push for cleaner labels further enhance its adoption. As food manufacturers strive to meet evolving consumer demands, the market for food grade sodium gluconate is poised for significant growth.
Food Grade Sodium Gluconate Competitive Landscape
The market report analyses the leading companies in the industry including Acros Organics, Cargill Inc, Ingredion Inc, Jungbunzlau Lauterbach, Shandong Kaison, Wanshang Group, Weifang Honghai, Zhucheng Dongxiao, and Others.
Food Grade Sodium Gluconate Market Dynamics
Food Grade Sodium Gluconate Market Trend: Shift Towards Clean Label and Sustainable Ingredients
A prominent trend in the food grade sodium gluconate market is the shift towards clean label and sustainable ingredients. As consumers become more conscious about the ingredients in their food and the environmental impact of food production, there's a growing preference for additives and preservatives that are perceived as natural, safe, and environmentally friendly. Sodium gluconate, derived from gluconic acid and glucose, is gaining traction as a food additive for its multifunctional properties, including chelating, sequestering, and buffering capabilities. This trend is driven by regulatory pressure to reduce the use of synthetic additives, consumer demand for clean label products, and the food industry's commitment to sustainability and corporate responsibility. Manufacturers are exploring the use of food grade sodium gluconate in various food and beverage applications, including dairy, bakery, and processed foods, to offer consumers safer, more natural food options while minimizing environmental impact and ensuring product quality and safety.
Market Driver: Rising Demand for Sodium Reduction and Flavor Enhancement
An essential driver fueling the food grade sodium gluconate market is the rising demand for sodium reduction and flavor enhancement solutions. With increasing concerns about the health risks associated with high sodium diets, such as hypertension and cardiovascular diseases, there's a growing emphasis on reducing sodium levels in processed foods and finding alternatives to traditional sodium-based additives. Sodium gluconate offers functional benefits such as salt reduction, flavor enhancement, and improved texture, making it an attractive option for food manufacturers seeking to meet sodium reduction targets without compromising taste or product quality. The need to address consumer health concerns, meet regulatory requirements, and maintain product acceptability is driving the adoption of food grade sodium gluconate as a key ingredient in sodium reduction strategies across various food and beverage categories.
Market Opportunity: Expansion into Meat and Poultry Processing Industry
A significant opportunity within the food grade sodium gluconate market lies in expansion into the meat and poultry processing industry. Beyond its traditional applications in bakery and dairy products, sodium gluconate has the potential to add value to meat and poultry products as a functional ingredient with multiple benefits. For example, sodium gluconate can be used as a chelating agent to enhance the tenderness and juiciness of meat products, improve marinade penetration, and extend shelf life by inhibiting microbial growth. Additionally, its ability to act as a buffer can help maintain the pH balance in processed meats, ensuring product stability and consistency. By tapping into the growing demand for processed meat products and offering solutions that address key challenges in meat processing, such as texture enhancement and shelf-life extension, manufacturers of food grade sodium gluconate can expand their market presence, capture new business opportunities, and drive growth in the competitive meat and poultry industry.
Food Grade Sodium Gluconate Market Share Analysis: Food and Beverages held the dominant market share in 2024
In the Food Grade Sodium Gluconate Market, the Food and Beverages segment is the largest, propelled by the versatile applications of sodium gluconate in enhancing food quality, stability, and functionality across a wide range of food and beverage products. Sodium gluconate serves as a multifunctional additive in the food industry, where it acts as a chelating agent, sequestrant, and stabilizer. It is widely used in food and beverage processing to improve texture, preserve flavor, and extend shelf life. Additionally, sodium gluconate plays a vital role in food formulations by enhancing the emulsification, gelling, and thickening properties of various food products. Its regulatory approval for use in food products and its status as a Generally Recognized as Safe (GRAS) ingredient further reinforce its dominance in the Food and Beverages segment. With the food industry's continuous innovation and the growing consumer demand for high-quality and nutritious food options, the Food and Beverages segment maintains its position as the largest in the Food Grade Sodium Gluconate Market.
Food Grade Sodium Gluconate Market Share Analysis: Beverage Manufacturers market is poised to register the fastest growth rae over the forecast period to 2032
In the Food Grade Sodium Gluconate Market, the Beverage Manufacturers segment is the fastest-growing, driven by the increasing demand for sodium gluconate as a versatile additive in beverage formulations. Beverage manufacturers are increasingly incorporating sodium gluconate to enhance product stability, texture, and flavor. Sodium gluconate serves as a chelating agent and pH regulator, helping to prevent mineral precipitation, improve clarity, and adjust acidity levels in beverages. Its ability to enhance the taste and mouthfeel of beverages, particularly in carbonated drinks, fruit juices, and sports drinks, contributes to its growing adoption by beverage manufacturers seeking to meet consumer preferences for high-quality and innovative products. Additionally, sodium gluconate's regulatory approval for use in food and beverage products and its recognized safety profile further drive its popularity among beverage manufacturers. With the beverage industry's continuous innovation and the growing consumer demand for functional and appealing beverage options, the Beverage Manufacturers segment in the Food Grade Sodium Gluconate Market is poised for rapid growth in the foreseeable future.
Food Grade Sodium Gluconate Market Share Analysis: Powder held the dominant market share in 2024
In the Food Grade Sodium Gluconate Market, the Powder segment is the largest, primarily due to its versatility, ease of handling, and extensive application in various food and beverage formulations. Powdered sodium gluconate offers manufacturers a convenient form for incorporation into recipes, allowing for precise dosage control and uniform dispersion within food matrices. Its fine particulate size ensures smooth texture and consistent performance in a wide range of products, including beverages, dairy products, sauces, and processed foods. Further, powdered sodium gluconate's stability and extended shelf life make it a preferred choice for food manufacturers seeking reliable and cost-effective additives. Additionally, its regulatory approval for use in food products and its status as a Generally Recognized as Safe (GRAS) ingredient further reinforce its dominance in the market. With its essential role in enhancing product quality, stability, and functionality, the Powder segment maintains its position as the largest in the Food Grade Sodium Gluconate Market.
Food Grade Sodium Gluconate Market Segmentation
By Application
Food and Beverages
Bakery and Confectionery
Dairy Products
By End-User
Food Manufacturers
Beverage Manufacturers
By Form
Powder
Liquid
Countries Analyzed
North America (US, Canada, Mexico)
Europe (Germany, UK, France, Spain, Italy, Russia, Rest of Europe)
Asia Pacific (China, India, Japan, South Korea, Australia, South East Asia, Rest of Asia)
South America (Brazil, Argentina, Rest of South America)
Middle East and Africa (Saudi Arabia, UAE, Rest of Middle East, South Africa, Egypt, Rest of Africa)
Food Grade Sodium Gluconate Companies Profiled in the Study
Acros Organics
Cargill Inc
Ingredion Inc
Jungbunzlau Lauterbach
Shandong Kaison
Wanshang Group
Weifang Honghai
Zhucheng Dongxiao
*- List Not Exhaustive
Chapter 1. TABLE OF CONTENTS
Chapter 2. Introduction to Food Grade Sodium Gluconate Market
2.1. Market Overview
2.2. Key Statistics and Report Highlights
2.3. Scope of the Comprehensive Study
2.3.1. Market Definition
2.3.2 Countries and Regions Covered
2.3.3 Research Objective
2.3.4 Units, Currency, and Conversions
2.3.5 Industry Value Chain
2.4. Key Market Segments
2.5. Key Companies
2.6. Study Period
Chapter 3. Strategic Analysis Review
3.1. Food Grade Sodium Gluconate Pricing Analysis and Forecast
3.2. Porter’s Five Forces
3.3. Market Ecosystem
3.4. SWOT Analysis
3.5. Regulatory Scenario
3.3. Effects of Inflation, Russia-Ukraine War, moderating economic growth, and other macroeconomic factors
Chapter 4. Competitive Landscape
4.1. Market Share Analysis
4.1.1. Global Food Grade Sodium Gluconate Market Share by Company, 2023
4.1.2. Product Offerings of Leading Food Grade Sodium Gluconate Companies
4.2. Market Entropy
4.2.1. New Product Launches in the Industry
4.2.2. Mergers, Acquisitions, Joint ventures, and Partnerships
4.3. Key Strategies and Best Practices
Chapter 5. Global Market Projections: Best, Reference, and Low Case Scenarios
5.1. Growth Analysis- Case Scenario Definitions
5.2. Low Growth Case Scenario Forecasts
5.3. Reference Growth Case Scenario Forecasts
5.4. High Growth Case Scenario Forecasts
Chapter 6. Market Dynamics
6.1. Food Grade Sodium Gluconate Market Drivers
6.2. Food Grade Sodium Gluconate Market Challenges
6.6. Food Grade Sodium Gluconate Market Opportunities
6.4. Food Grade Sodium Gluconate Market Trends
Chapter 7. Global Food Grade Sodium Gluconate Market Outlook Trends
7.1. Global Food Grade Sodium Gluconate Revenue (USD Million) and CAGR (%) by Type (2021-2032)
7.2. Global Food Grade Sodium Gluconate Revenue (USD Million) and CAGR (%) by Application (2021-2032)
7.3. Global Food Grade Sodium Gluconate Revenue (USD Million) and CAGR (%) by Product (2021-2032)
By Application
Food and Beverages
Bakery and Confectionery
Dairy Products
By End-User
Food Manufacturers
Beverage Manufacturers
By Form
Powder
Liquid
Chapter 8. Global Food Grade Sodium Gluconate Regional Analysis and Outlook
8.1. Global Food Grade Sodium Gluconate Revenue (USD Million) By Regions (2021- 2032)
8.2. North America Food Grade Sodium Gluconate Revenue (USD Million) by Country (2021-2032)
8.2.1. United States Food Grade Sodium Gluconate Regional Analysis and Outlook
8.2.2. Canada Food Grade Sodium Gluconate Regional Analysis and Outlook
8.2.3. Mexico Food Grade Sodium Gluconate Regional Analysis and Outlook
8.3. Europe Food Grade Sodium Gluconate Revenue (USD Million), by Country (2021-2032)
8.3.1. Germany Food Grade Sodium Gluconate Regional Analysis and Outlook
8.3.2. France Food Grade Sodium Gluconate Regional Analysis and Outlook
8.3.3. United Kingdom Food Grade Sodium Gluconate Regional Analysis and Outlook
8.3.4. Spain Food Grade Sodium Gluconate Regional Analysis and Outlook
8.3.5. Italy Food Grade Sodium Gluconate Regional Analysis and Outlook
8.3.6. Russia Food Grade Sodium Gluconate Regional Analysis and Outlook
8.3.7. Rest of Europe Food Grade Sodium Gluconate Regional Analysis and Outlook
8.4. Asia Pacific Food Grade Sodium Gluconate Revenue (USD Million) by Country (2021-2032)
8.4.1. China Food Grade Sodium Gluconate Regional Analysis and Outlook
8.4.2. Japan Food Grade Sodium Gluconate Regional Analysis and Outlook
8.4.3. India Food Grade Sodium Gluconate Regional Analysis and Outlook
8.4.4. South Korea Food Grade Sodium Gluconate Regional Analysis and Outlook
8.4.5. Australia Food Grade Sodium Gluconate Regional Analysis and Outlook
8.4.6. South East Asia Food Grade Sodium Gluconate Regional Analysis and Outlook
8.4.7. Rest of Asia Pacific Food Grade Sodium Gluconate Regional Analysis and Outlook
8.5. South America Food Grade Sodium Gluconate Revenue (USD Million), by Country (2021-2032)
8.5.1. Brazil Food Grade Sodium Gluconate Regional Analysis and Outlook
8.5.2. Argentina Food Grade Sodium Gluconate Regional Analysis and Outlook
8.5.3. Rest of South America Food Grade Sodium Gluconate Regional Analysis and Outlook
8.6. Middle East and Africa Food Grade Sodium Gluconate Revenue (USD Million) by Country (2021-2032)
8.6.1. Middle East Food Grade Sodium Gluconate Regional Analysis and Outlook
8.6.2. Africa Food Grade Sodium Gluconate Regional Analysis and Outlook
Chapter 9. North America Food Grade Sodium Gluconate Analysis and Outlook
9.1. North America Food Grade Sodium Gluconate Revenue (USD Million) by Segments (2021-2032)
9.1.1. North America Food Grade Sodium Gluconate Revenue (USD Million) by Type (2021-2032)
9.1.2. North America Food Grade Sodium Gluconate Revenue (USD Million) by Application (2021-2032)
9.1.3. North America Food Grade Sodium Gluconate Revenue (USD Million) by Product (2021-2032)
By Application
Food and Beverages
Bakery and Confectionery
Dairy Products
By End-User
Food Manufacturers
Beverage Manufacturers
By Form
Powder
Liquid
Chapter 10. Europe Food Grade Sodium Gluconate Analysis and Outlook
10.1. Europe Food Grade Sodium Gluconate Revenue (USD Million), by Segments (USD Million) (2021-2032)
10.1.1. Europe Food Grade Sodium Gluconate Revenue (USD Million) by Type (2021-2032)
10.1.2. Europe Food Grade Sodium Gluconate Revenue (USD Million) by Application (2021-2032)
10.1.3. Europe Food Grade Sodium Gluconate Revenue (USD Million) by Product (2021-2032)
By Application
Food and Beverages
Bakery and Confectionery
Dairy Products
By End-User
Food Manufacturers
Beverage Manufacturers
By Form
Powder
Liquid
Chapter 11. Asia Pacific Food Grade Sodium Gluconate Analysis and Outlook
11.1. Asia Pacific Food Grade Sodium Gluconate Revenue (USD Million), and Revenue (USD Million) by Segments (2021-2032)
11.1.1. Asia Pacific Food Grade Sodium Gluconate Revenue (USD Million) by Type (2021-2032)
11.1.2. Asia Pacific Food Grade Sodium Gluconate Revenue (USD Million) by Application (2021-2032)
11.1.3. Asia Pacific Food Grade Sodium Gluconate Revenue (USD Million) by Product (2021-2032)
By Application
Food and Beverages
Bakery and Confectionery
Dairy Products
By End-User
Food Manufacturers
Beverage Manufacturers
By Form
Powder
Liquid
Chapter 12. South America Food Grade Sodium Gluconate Analysis and Outlook
12.1. South America Food Grade Sodium Gluconate Revenue (USD Million), by Segments (2021-2032)
12.1.1. South America Food Grade Sodium Gluconate Revenue (USD Million) by Type (2021-2032)
12.1.2. South America Food Grade Sodium Gluconate Revenue (USD Million) by Application (2021-2032)
12.1.3. South America Food Grade Sodium Gluconate Revenue (USD Million) by Product (2021-2032)
By Application
Food and Beverages
Bakery and Confectionery
Dairy Products
By End-User
Food Manufacturers
Beverage Manufacturers
By Form
Powder
Liquid
Chapter 13. Middle East and Africa Food Grade Sodium Gluconate Analysis and Outlook
13.1. Middle East and Africa Food Grade Sodium Gluconate Revenue (USD Million), by Segments (2021-2032)
13.1.1. Middle East and Africa Food Grade Sodium Gluconate Revenue (USD Million) by Type (2021-2032)
13.1.2. Middle East and Africa Food Grade Sodium Gluconate Revenue (USD Million) by Application (2021-2032)
13.1.3. Middle East and Africa Food Grade Sodium Gluconate Revenue (USD Million) by Product (2021-2032)
By Application
Food and Beverages
Bakery and Confectionery
Dairy Products
By End-User
Food Manufacturers
Beverage Manufacturers
By Form
Powder
Liquid
Chapter 14. Food Grade Sodium Gluconate Company Profiles
14.1 Business Overview
14.2 Product Profiles
14.3 SWOT Profiles
14.5 Recent Developments
14.6 Financial Profile
List of Companies
Acros Organics
Cargill Inc
Ingredion Inc
Jungbunzlau Lauterbach
Shandong Kaison
Wanshang Group
Weifang Honghai
Zhucheng Dongxiao
15. Methodology and Data Sources
15.1 Customization Offerings
15.2 Subscription Services
15.3 Related Reports
15.4 Publisher Expertise
LIST OF TABLES
Table 1 Market Segmentation Analysis
Table 2 Global Food Grade Sodium Gluconate Market Share of Leading Companies, 2023
Table 3 Product Offerings of Leading Companies
Table 4 Low Growth Scenario Forecasts
Table 5 Reference Case Growth Scenario
Table 6 High Growth Case Scenario
Table 7 Global Food Grade Sodium Gluconate Revenue (USD Million) And CAGR (%) By Type (2021-2032)
Table 8 Global Food Grade Sodium Gluconate Revenue (USD Million) And CAGR (%) By Application (2021-2032)
Table 9 Global Food Grade Sodium Gluconate Revenue (USD Million) And CAGR (%) By Product (2021-2032)
Table 10 Global Food Grade Sodium Gluconate Market Revenue (USD Million) By Regions (2021-2032)
Table 11 Global Food Grade Sodium Gluconate Market Share (%) By Regions (2021-2032)
Table 12 North America Food Grade Sodium Gluconate Revenue (USD Million) By Country (2021-2032)
Table 13 Europe Food Grade Sodium Gluconate Revenue (USD Million) By Country (2021-2032)
Table 14 Asia Pacific Food Grade Sodium Gluconate Revenue (USD Million) By Country (2021-2032)
Table 15 South America Food Grade Sodium Gluconate Revenue (USD Million) By Country (2021-2032)
Table 16 Middle East and Africa Food Grade Sodium Gluconate Revenue (USD Million) By Region (2021-2032)
Table 17 North America Food Grade Sodium Gluconate Revenue (USD Million) By Type (2021-2032)
Table 18 North America Food Grade Sodium Gluconate Revenue (USD Million) By Application (2021-2032)
Table 19 North America Food Grade Sodium Gluconate Revenue (USD Million) By Product (2021-2032)
Table 20 Europe Food Grade Sodium Gluconate Revenue (USD Million) By Type (2021-2032)
Table 21 Europe Food Grade Sodium Gluconate Revenue (USD Million) By Application (2021-2032)
Table 22 Europe Food Grade Sodium Gluconate Revenue (USD Million) By Product (2021-2032)
Table 23 Asia Pacific Food Grade Sodium Gluconate Revenue (USD Million) By Type (2021-2032)
Table 24 Asia Pacific Food Grade Sodium Gluconate Revenue (USD Million) By Application (2021-2032)
Table 25 Asia Pacific Food Grade Sodium Gluconate Revenue (USD Million) By Product (2021-2032)
Table 26 South America Food Grade Sodium Gluconate Revenue (USD Million) By Type (2021-2032)
Table 27 South America Food Grade Sodium Gluconate Revenue (USD Million) By Application (2021-2032)
Table 28 South America Food Grade Sodium Gluconate Revenue (USD Million) By Product (2021-2032)
Table 29 Middle East and Africa Food Grade Sodium Gluconate Revenue (USD Million) By Type (2021-2032)
Table 30 Middle East and Africa Food Grade Sodium Gluconate Revenue (USD Million) By Application (2021-2032)
Table 31 Middle East and Africa Food Grade Sodium Gluconate Revenue (USD Million) By Product (2021-2032)
LIST OF FIGURES
Figure 1. Market Scope
Figure 2. Pricing Forecasts Per Unit, 2023- 2032
Figure 3. Porter’s Five Forces
Figure 4. Global Food Grade Sodium Gluconate Market Revenue (USD Million) By Regions (2021-2032)
Figure 5. Global Food Grade Sodium Gluconate Market Share (%) By Regions (2023)
Figure 6. North America Food Grade Sodium Gluconate Revenue (USD Million) By Country (2021-2032)
Figure 7. United States Food Grade Sodium Gluconate Revenue (USD Million) By Country (2021-2032)
Figure 8. Canada Food Grade Sodium Gluconate Revenue (USD Million) By Country (2021-2032)
Figure 9. Mexico Food Grade Sodium Gluconate Revenue (USD Million) By Country (2021-2032)
Figure 10. Europe Food Grade Sodium Gluconate Revenue (USD Million) By Country (2021-2032)
Figure 11. Germany Food Grade Sodium Gluconate Revenue (USD Million) By Country (2021-2032)
Figure 12. France Food Grade Sodium Gluconate Revenue (USD Million) By Country (2021-2032)
Figure 13. United Kingdom Food Grade Sodium Gluconate Revenue (USD Million) By Country (2021-2032)
Figure 14. Spain Food Grade Sodium Gluconate Revenue (USD Million) By Country (2021-2032)
Figure 15. Italy Food Grade Sodium Gluconate Revenue (USD Million) By Country (2021-2032)
Figure 16. Russia Food Grade Sodium Gluconate Revenue (USD Million) By Country (2021-2032)
Figure 17. Rest of Europe Food Grade Sodium Gluconate Revenue (USD Million) By Country (2021-2032)
Figure 11. Asia Pacific Food Grade Sodium Gluconate Revenue (USD Million) By Country (2021-2032)
Figure 12. China Food Grade Sodium Gluconate Revenue (USD Million) By Country (2021-2032)
Figure 13. Japan Food Grade Sodium Gluconate Revenue (USD Million) By Country (2021-2032)
Figure 14. India Food Grade Sodium Gluconate Revenue (USD Million) By Country (2021-2032)
Figure 15. South Korea Food Grade Sodium Gluconate Revenue (USD Million) By Country (2021-2032)
Figure 16. Australia Food Grade Sodium Gluconate Revenue (USD Million) By Country (2021-2032)
Figure 17. South East Asia Food Grade Sodium Gluconate Revenue (USD Million) By Country (2021-2032)
Figure 18. South America Food Grade Sodium Gluconate Revenue (USD Million) By Country (2021-2032)
Figure 19. Brazil Food Grade Sodium Gluconate Revenue (USD Million) By Country (2021-2032)
Figure 20. Argentina Food Grade Sodium Gluconate Revenue (USD Million) By Country (2021-2032)
Figure 21. Rest of Asia Pacific Food Grade Sodium Gluconate Revenue (USD Million) By Country (2021-2032)
Figure 22. Middle East and Africa Food Grade Sodium Gluconate Revenue (USD Million) By Region (2021-2032)
Figure 23. Saudi Arabia Food Grade Sodium Gluconate Revenue (USD Million) By Region (2021-2032)
Figure 24. The UAE Food Grade Sodium Gluconate Revenue (USD Million) By Region (2021-2032)
Figure 25. Rest of Middle East Food Grade Sodium Gluconate Revenue (USD Million) By Region (2021-2032)
Figure 26. South Africa Food Grade Sodium Gluconate Revenue (USD Million) By Region (2021-2032)
Figure 27. Africa Food Grade Sodium Gluconate Revenue (USD Million) By Region (2021-2032)
Figure 28. North America Food Grade Sodium Gluconate Revenue (USD Million) By Type (2021-2032)
Figure 29. North America Food Grade Sodium Gluconate Revenue (USD Million) By Application (2021-2032)
Figure 30. North America Food Grade Sodium Gluconate Revenue (USD Million) By Product (2021-2032)
Figure 31. Europe Food Grade Sodium Gluconate Revenue (USD Million) By Type (2021-2032)
Figure 32. Europe Food Grade Sodium Gluconate Revenue (USD Million) By Application (2021-2032)
Figure 33. Europe Food Grade Sodium Gluconate Revenue (USD Million) By Product (2021-2032)
Figure 34. Asia Pacific Food Grade Sodium Gluconate Revenue (USD Million) By Type (2021-2032)
Figure 35. Asia Pacific Food Grade Sodium Gluconate Revenue (USD Million) By Application (2021-2032)
Figure 36. Asia Pacific Food Grade Sodium Gluconate Revenue (USD Million) By Product (2021-2032)
Figure 37. South America Food Grade Sodium Gluconate Revenue (USD Million) By Type (2021-2032)
Figure 38. South America Food Grade Sodium Gluconate Revenue (USD Million) By Application (2021-2032)
Figure 39. South America Food Grade Sodium Gluconate Revenue (USD Million) By Product (2021-2032)
Figure 40. Middle East and Africa Food Grade Sodium Gluconate Revenue (USD Million) By Type (2021-2032)
Figure 41. Middle East and Africa Food Grade Sodium Gluconate Revenue (USD Million) By Application (2021-2032)
Figure 42. Middle East and Africa Food Grade Sodium Gluconate Revenue (USD Million) By Product (2021-2032)
By Application
Food and Beverages
Bakery and Confectionery
Dairy Products
By End-User
Food Manufacturers
Beverage Manufacturers
By Form
Powder
Liquid
Countries Analyzed
North America (US, Canada, Mexico)
Europe (Germany, UK, France, Spain, Italy, Russia, Rest of Europe)
Asia Pacific (China, India, Japan, South Korea, Australia, South East Asia, Rest of Asia)
South America (Brazil, Argentina, Rest of South America)
Middle East and Africa (Saudi Arabia, UAE, Rest of Middle East, South Africa, Egypt, Rest of Africa)
