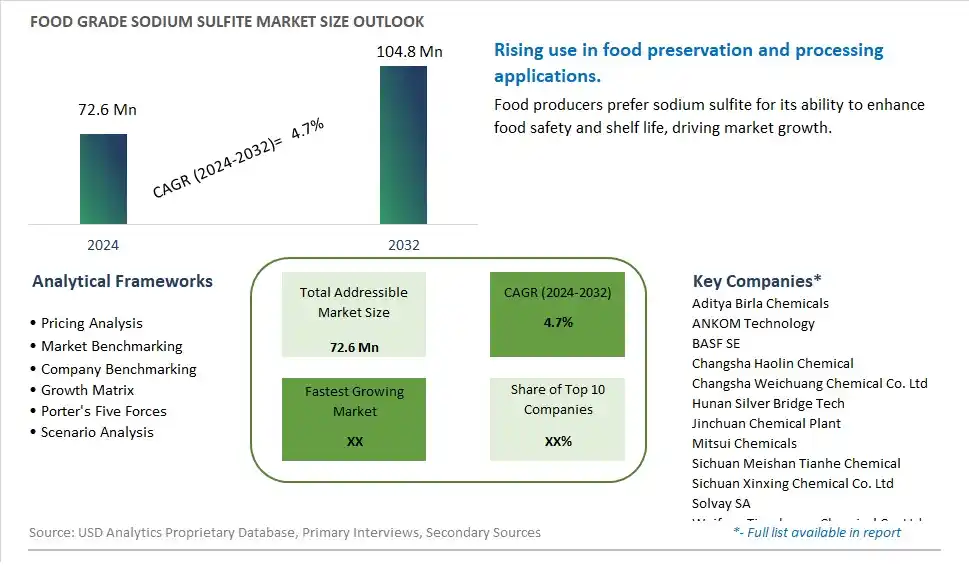
Global Food Grade Sodium Sulfite Market Size is valued at $72.6 Million in 2024 and is forecast to register a growth rate (CAGR) of 4.7% to reach $104.8 Million by 2032.
The global Food Grade Sodium Sulfite Market Comprehensive Study analyzes and forecasts the market size across 6 regions and 24 countries for diverse segments -By Type (Powder, Liquid), By Application (Preservative, Bleaching Agent, Oxygen Scavenger, Others), By End-User (Food Industry, Beverages Industry), By Channel (Direct Sales, Distribution Channel)
An Introduction to Food Grade Sodium Sulfite Market
The Food Grade Sodium Sulfite market in 2024 is witnessing robust growth, driven by the increasing demand for preservatives and antioxidants in food and beverage products. Food grade sodium sulfite is used to prevent discoloration and spoilage in products such as meat, beverages, and dried fruits. The market benefits from advancements in chemical production and application technologies, the growing trend of convenience and processed foods, and the expansion of the global food and beverage sector. Additionally, the rising focus on food safety and quality assurance is contributing to market growth.
Food Grade Sodium Sulfite Competitive Landscape
The market report analyses the leading companies in the industry including Aditya Birla Chemicals, ANKOM Technology, BASF SE, Changsha Haolin Chemical, Changsha Weichuang Chemical Co. Ltd, Hunan Silver Bridge Tech, Jinchuan Chemical Plant, Mitsui Chemicals, Sichuan Meishan Tianhe Chemical, Sichuan Xinxing Chemical Co. Ltd, Solvay SA, Weifang Tianchuang Chemical Co. Ltd, Yulin Chemical Factory, and Others.
Food Grade Sodium Sulfite Market Dynamics
Food Grade Sodium Sulfite Market Trend: Increasing Use in Food Processing
The most prominent trend in the Food Grade Sodium Sulfite Market is its increasing use in food processing. Sodium sulfite is widely used as a preservative and antioxidant in various food products to prevent spoilage and maintain color and freshness. This trend is driven by the growing demand for processed and packaged foods, which require effective preservation solutions to ensure product quality and safety.
Food Grade Sodium Sulfite Market Driver: Growth in Packaged Food Consumption
The key driver of the Food Grade Sodium Sulfite Market is the growth in packaged food consumption. As urbanization and busy lifestyles lead to higher demand for convenience foods, there is a corresponding need for preservatives that enhance the shelf life and safety of these products. Sodium sulfite's effectiveness in preventing oxidation and microbial growth makes it a valuable ingredient in the packaged food industry.
Food Grade Sodium Sulfite Market Opportunity: Development of Clean Label Alternatives
A significant opportunity in the Food Grade Sodium Sulfite Market lies in the development of clean label alternatives. As consumers become more health-conscious and seek transparency in food labeling, there is potential for creating natural and clean label preservatives that offer similar benefits to sodium sulfite. By investing in research and innovation to develop these alternatives, companies can meet consumer demand for safer and more natural food ingredients while maintaining product quality.
Food Grade Sodium Sulfite Market Share Analysis: Powder segment generated the highest revenue share in the industry
In the Food Grade Sodium Sulfite market, the Powder type stands out as the largest segment. Powdered sodium sulfite is preferred for its ease of handling, storage, and versatility in various food applications. It is commonly used as a preservative to extend the shelf life of food products by inhibiting microbial growth and preventing oxidation, which helps maintain color, flavor, and texture. Powdered sodium sulfite is also utilized as a food additive in the production of dried fruits and vegetables, as well as in meat and seafood processing to enhance food safety and quality. Its stable form ensures consistent performance across different food processing environments, making it a reliable choice for manufacturers seeking effective preservation solutions.
Food Grade Sodium Sulfite Market Share Analysis: Preservative is the fastest growing segment over the forecast period to 2032
The Preservative application emerges as the fastest growing segment in the Food Grade Sodium Sulfite market through 2032. Sodium sulfite is widely recognized for its preservative properties, especially in food and beverage industries. As a preservative, it helps inhibit the growth of bacteria and fungi, thereby extending the shelf life of perishable food products. This application is particularly crucial in the preservation of fruits, vegetables, and seafood during processing and storage. The increasing demand for convenience foods, ready-to-eat meals, and packaged foods has spurred the use of sodium sulfite as a preservative to ensure food safety and maintain product quality over longer periods. Further, stringent regulations regarding food safety and preservation techniques further drive the adoption of sodium sulfite in the Preservative application, making it a pivotal growth area in the market.
Food Grade Sodium Sulfite Market Share Analysis: Food Industry segment generated the highest revenue share in the industry
Within the Food Grade Sodium Sulfite market, the Food Industry emerges as the largest segment by end-user. Sodium sulfite finds extensive application in the food industry for its role as a preservative and antioxidant. It is commonly used in the preservation of fruits and vegetables, particularly in dried forms, to prevent discoloration and maintain freshness during storage and distribution. Additionally, sodium sulfite is utilized in meat processing to prevent microbial growth and oxidation, ensuring food safety and extending shelf life. Its effectiveness in maintaining food quality and safety standards makes it indispensable across various segments of the food industry, including processed foods, snacks, and ready-to-eat meals.
Food Grade Sodium Sulfite Market Share Analysis: Distribution Channel is the fastest growing segment over the forecast period to 2032
The Distribution Channel segment is projected to be the fastest growing in the Food Grade Sodium Sulfite market through 2032. Distribution channels play a crucial role in the efficient supply and availability of sodium sulfite to end-users in the food and beverage industry. Direct sales and distribution channels facilitate the widespread adoption of sodium sulfite by ensuring timely delivery, technical support, and product availability. The growth in this segment is driven by expanding food processing capabilities, increasing demand for preserved and packaged foods, and stringent regulations on food safety and quality. Distributors and suppliers are enhancing their logistical capabilities and expanding their reach to cater to the rising demand from food manufacturers, thereby driving growth in the Distribution Channel segment of the Food Grade Sodium Sulfite market.
Food Grade Sodium Sulfite Market Segmentation
By Type
Powder
Liquid
By Application
Preservative
Bleaching Agent
Oxygen Scavenger
Others
By End-User
Food Industry
Beverages Industry
By Channel
Direct Sales
Distribution Channel
Countries Analyzed
North America (US, Canada, Mexico)
Europe (Germany, UK, France, Spain, Italy, Russia, Rest of Europe)
Asia Pacific (China, India, Japan, South Korea, Australia, South East Asia, Rest of Asia)
South America (Brazil, Argentina, Rest of South America)
Middle East and Africa (Saudi Arabia, UAE, Rest of Middle East, South Africa, Egypt, Rest of Africa)
Food Grade Sodium Sulfite Companies Profiled in the Study
Aditya Birla Chemicals
ANKOM Technology
BASF SE
Changsha Haolin Chemical
Changsha Weichuang Chemical Co. Ltd
Hunan Silver Bridge Tech
Jinchuan Chemical Plant
Mitsui Chemicals
Sichuan Meishan Tianhe Chemical
Sichuan Xinxing Chemical Co. Ltd
Solvay SA
Weifang Tianchuang Chemical Co. Ltd
Yulin Chemical Factory
*- List Not Exhaustive
Chapter 1. TABLE OF CONTENTS
Chapter 2. Introduction to Food Grade Sodium Sulfite Market
2.1. Market Overview
2.2. Key Statistics and Report Highlights
2.3. Scope of the Comprehensive Study
2.3.1. Market Definition
2.3.2 Countries and Regions Covered
2.3.3 Research Objective
2.3.4 Units, Currency, and Conversions
2.3.5 Industry Value Chain
2.4. Key Market Segments
2.5. Key Companies
2.6. Study Period
Chapter 3. Strategic Analysis Review
3.1. Food Grade Sodium Sulfite Pricing Analysis and Forecast
3.2. Porter’s Five Forces
3.3. Market Ecosystem
3.4. SWOT Analysis
3.5. Regulatory Scenario
3.3. Effects of Inflation, Russia-Ukraine War, moderating economic growth, and other macroeconomic factors
Chapter 4. Competitive Landscape
4.1. Market Share Analysis
4.1.1. Global Food Grade Sodium Sulfite Market Share by Company, 2023
4.1.2. Product Offerings of Leading Food Grade Sodium Sulfite Companies
4.2. Market Entropy
4.2.1. New Product Launches in the Industry
4.2.2. Mergers, Acquisitions, Joint ventures, and Partnerships
4.3. Key Strategies and Best Practices
Chapter 5. Global Market Projections: Best, Reference, and Low Case Scenarios
5.1. Growth Analysis- Case Scenario Definitions
5.2. Low Growth Case Scenario Forecasts
5.3. Reference Growth Case Scenario Forecasts
5.4. High Growth Case Scenario Forecasts
Chapter 6. Market Dynamics
6.1. Food Grade Sodium Sulfite Market Drivers
6.2. Food Grade Sodium Sulfite Market Challenges
6.6. Food Grade Sodium Sulfite Market Opportunities
6.4. Food Grade Sodium Sulfite Market Trends
Chapter 7. Global Food Grade Sodium Sulfite Market Outlook Trends
7.1. Global Food Grade Sodium Sulfite Revenue (USD Million) and CAGR (%) by Type (2021-2032)
7.2. Global Food Grade Sodium Sulfite Revenue (USD Million) and CAGR (%) by Application (2021-2032)
7.3. Global Food Grade Sodium Sulfite Revenue (USD Million) and CAGR (%) by Product (2021-2032)
By Type
Powder
Liquid
By Application
Preservative
Bleaching Agent
Oxygen Scavenger
Others
By End-User
Food Industry
Beverages Industry
By Channel
Direct Sales
Distribution Channel
Chapter 8. Global Food Grade Sodium Sulfite Regional Analysis and Outlook
8.1. Global Food Grade Sodium Sulfite Revenue (USD Million) By Regions (2021- 2032)
8.2. North America Food Grade Sodium Sulfite Revenue (USD Million) by Country (2021-2032)
8.2.1. United States Food Grade Sodium Sulfite Regional Analysis and Outlook
8.2.2. Canada Food Grade Sodium Sulfite Regional Analysis and Outlook
8.2.3. Mexico Food Grade Sodium Sulfite Regional Analysis and Outlook
8.3. Europe Food Grade Sodium Sulfite Revenue (USD Million), by Country (2021-2032)
8.3.1. Germany Food Grade Sodium Sulfite Regional Analysis and Outlook
8.3.2. France Food Grade Sodium Sulfite Regional Analysis and Outlook
8.3.3. United Kingdom Food Grade Sodium Sulfite Regional Analysis and Outlook
8.3.4. Spain Food Grade Sodium Sulfite Regional Analysis and Outlook
8.3.5. Italy Food Grade Sodium Sulfite Regional Analysis and Outlook
8.3.6. Russia Food Grade Sodium Sulfite Regional Analysis and Outlook
8.3.7. Rest of Europe Food Grade Sodium Sulfite Regional Analysis and Outlook
8.4. Asia Pacific Food Grade Sodium Sulfite Revenue (USD Million) by Country (2021-2032)
8.4.1. China Food Grade Sodium Sulfite Regional Analysis and Outlook
8.4.2. Japan Food Grade Sodium Sulfite Regional Analysis and Outlook
8.4.3. India Food Grade Sodium Sulfite Regional Analysis and Outlook
8.4.4. South Korea Food Grade Sodium Sulfite Regional Analysis and Outlook
8.4.5. Australia Food Grade Sodium Sulfite Regional Analysis and Outlook
8.4.6. South East Asia Food Grade Sodium Sulfite Regional Analysis and Outlook
8.4.7. Rest of Asia Pacific Food Grade Sodium Sulfite Regional Analysis and Outlook
8.5. South America Food Grade Sodium Sulfite Revenue (USD Million), by Country (2021-2032)
8.5.1. Brazil Food Grade Sodium Sulfite Regional Analysis and Outlook
8.5.2. Argentina Food Grade Sodium Sulfite Regional Analysis and Outlook
8.5.3. Rest of South America Food Grade Sodium Sulfite Regional Analysis and Outlook
8.6. Middle East and Africa Food Grade Sodium Sulfite Revenue (USD Million) by Country (2021-2032)
8.6.1. Middle East Food Grade Sodium Sulfite Regional Analysis and Outlook
8.6.2. Africa Food Grade Sodium Sulfite Regional Analysis and Outlook
Chapter 9. North America Food Grade Sodium Sulfite Analysis and Outlook
9.1. North America Food Grade Sodium Sulfite Revenue (USD Million) by Segments (2021-2032)
9.1.1. North America Food Grade Sodium Sulfite Revenue (USD Million) by Type (2021-2032)
9.1.2. North America Food Grade Sodium Sulfite Revenue (USD Million) by Application (2021-2032)
9.1.3. North America Food Grade Sodium Sulfite Revenue (USD Million) by Product (2021-2032)
By Type
Powder
Liquid
By Application
Preservative
Bleaching Agent
Oxygen Scavenger
Others
By End-User
Food Industry
Beverages Industry
By Channel
Direct Sales
Distribution Channel
Chapter 10. Europe Food Grade Sodium Sulfite Analysis and Outlook
10.1. Europe Food Grade Sodium Sulfite Revenue (USD Million), by Segments (USD Million) (2021-2032)
10.1.1. Europe Food Grade Sodium Sulfite Revenue (USD Million) by Type (2021-2032)
10.1.2. Europe Food Grade Sodium Sulfite Revenue (USD Million) by Application (2021-2032)
10.1.3. Europe Food Grade Sodium Sulfite Revenue (USD Million) by Product (2021-2032)
By Type
Powder
Liquid
By Application
Preservative
Bleaching Agent
Oxygen Scavenger
Others
By End-User
Food Industry
Beverages Industry
By Channel
Direct Sales
Distribution Channel
Chapter 11. Asia Pacific Food Grade Sodium Sulfite Analysis and Outlook
11.1. Asia Pacific Food Grade Sodium Sulfite Revenue (USD Million), and Revenue (USD Million) by Segments (2021-2032)
11.1.1. Asia Pacific Food Grade Sodium Sulfite Revenue (USD Million) by Type (2021-2032)
11.1.2. Asia Pacific Food Grade Sodium Sulfite Revenue (USD Million) by Application (2021-2032)
11.1.3. Asia Pacific Food Grade Sodium Sulfite Revenue (USD Million) by Product (2021-2032)
By Type
Powder
Liquid
By Application
Preservative
Bleaching Agent
Oxygen Scavenger
Others
By End-User
Food Industry
Beverages Industry
By Channel
Direct Sales
Distribution Channel
Chapter 12. South America Food Grade Sodium Sulfite Analysis and Outlook
12.1. South America Food Grade Sodium Sulfite Revenue (USD Million), by Segments (2021-2032)
12.1.1. South America Food Grade Sodium Sulfite Revenue (USD Million) by Type (2021-2032)
12.1.2. South America Food Grade Sodium Sulfite Revenue (USD Million) by Application (2021-2032)
12.1.3. South America Food Grade Sodium Sulfite Revenue (USD Million) by Product (2021-2032)
By Type
Powder
Liquid
By Application
Preservative
Bleaching Agent
Oxygen Scavenger
Others
By End-User
Food Industry
Beverages Industry
By Channel
Direct Sales
Distribution Channel
Chapter 13. Middle East and Africa Food Grade Sodium Sulfite Analysis and Outlook
13.1. Middle East and Africa Food Grade Sodium Sulfite Revenue (USD Million), by Segments (2021-2032)
13.1.1. Middle East and Africa Food Grade Sodium Sulfite Revenue (USD Million) by Type (2021-2032)
13.1.2. Middle East and Africa Food Grade Sodium Sulfite Revenue (USD Million) by Application (2021-2032)
13.1.3. Middle East and Africa Food Grade Sodium Sulfite Revenue (USD Million) by Product (2021-2032)
By Type
Powder
Liquid
By Application
Preservative
Bleaching Agent
Oxygen Scavenger
Others
By End-User
Food Industry
Beverages Industry
By Channel
Direct Sales
Distribution Channel
Chapter 14. Food Grade Sodium Sulfite Company Profiles
14.1 Business Overview
14.2 Product Profiles
14.3 SWOT Profiles
14.5 Recent Developments
14.6 Financial Profile
List of Companies
Aditya Birla Chemicals
ANKOM Technology
BASF SE
Changsha Haolin Chemical
Changsha Weichuang Chemical Co. Ltd
Hunan Silver Bridge Tech
Jinchuan Chemical Plant
Mitsui Chemicals
Sichuan Meishan Tianhe Chemical
Sichuan Xinxing Chemical Co. Ltd
Solvay SA
Weifang Tianchuang Chemical Co. Ltd
Yulin Chemical Factory
15. Methodology and Data Sources
15.1 Customization Offerings
15.2 Subscription Services
15.3 Related Reports
15.4 Publisher Expertise
LIST OF TABLES
Table 1 Market Segmentation Analysis
Table 2 Global Food Grade Sodium Sulfite Market Share of Leading Companies, 2023
Table 3 Product Offerings of Leading Companies
Table 4 Low Growth Scenario Forecasts
Table 5 Reference Case Growth Scenario
Table 6 High Growth Case Scenario
Table 7 Global Food Grade Sodium Sulfite Revenue (USD Million) And CAGR (%) By Type (2021-2032)
Table 8 Global Food Grade Sodium Sulfite Revenue (USD Million) And CAGR (%) By Application (2021-2032)
Table 9 Global Food Grade Sodium Sulfite Revenue (USD Million) And CAGR (%) By Product (2021-2032)
Table 10 Global Food Grade Sodium Sulfite Market Revenue (USD Million) By Regions (2021-2032)
Table 11 Global Food Grade Sodium Sulfite Market Share (%) By Regions (2021-2032)
Table 12 North America Food Grade Sodium Sulfite Revenue (USD Million) By Country (2021-2032)
Table 13 Europe Food Grade Sodium Sulfite Revenue (USD Million) By Country (2021-2032)
Table 14 Asia Pacific Food Grade Sodium Sulfite Revenue (USD Million) By Country (2021-2032)
Table 15 South America Food Grade Sodium Sulfite Revenue (USD Million) By Country (2021-2032)
Table 16 Middle East and Africa Food Grade Sodium Sulfite Revenue (USD Million) By Region (2021-2032)
Table 17 North America Food Grade Sodium Sulfite Revenue (USD Million) By Type (2021-2032)
Table 18 North America Food Grade Sodium Sulfite Revenue (USD Million) By Application (2021-2032)
Table 19 North America Food Grade Sodium Sulfite Revenue (USD Million) By Product (2021-2032)
Table 20 Europe Food Grade Sodium Sulfite Revenue (USD Million) By Type (2021-2032)
Table 21 Europe Food Grade Sodium Sulfite Revenue (USD Million) By Application (2021-2032)
Table 22 Europe Food Grade Sodium Sulfite Revenue (USD Million) By Product (2021-2032)
Table 23 Asia Pacific Food Grade Sodium Sulfite Revenue (USD Million) By Type (2021-2032)
Table 24 Asia Pacific Food Grade Sodium Sulfite Revenue (USD Million) By Application (2021-2032)
Table 25 Asia Pacific Food Grade Sodium Sulfite Revenue (USD Million) By Product (2021-2032)
Table 26 South America Food Grade Sodium Sulfite Revenue (USD Million) By Type (2021-2032)
Table 27 South America Food Grade Sodium Sulfite Revenue (USD Million) By Application (2021-2032)
Table 28 South America Food Grade Sodium Sulfite Revenue (USD Million) By Product (2021-2032)
Table 29 Middle East and Africa Food Grade Sodium Sulfite Revenue (USD Million) By Type (2021-2032)
Table 30 Middle East and Africa Food Grade Sodium Sulfite Revenue (USD Million) By Application (2021-2032)
Table 31 Middle East and Africa Food Grade Sodium Sulfite Revenue (USD Million) By Product (2021-2032)
LIST OF FIGURES
Figure 1. Market Scope
Figure 2. Pricing Forecasts Per Unit, 2023- 2032
Figure 3. Porter’s Five Forces
Figure 4. Global Food Grade Sodium Sulfite Market Revenue (USD Million) By Regions (2021-2032)
Figure 5. Global Food Grade Sodium Sulfite Market Share (%) By Regions (2023)
Figure 6. North America Food Grade Sodium Sulfite Revenue (USD Million) By Country (2021-2032)
Figure 7. United States Food Grade Sodium Sulfite Revenue (USD Million) By Country (2021-2032)
Figure 8. Canada Food Grade Sodium Sulfite Revenue (USD Million) By Country (2021-2032)
Figure 9. Mexico Food Grade Sodium Sulfite Revenue (USD Million) By Country (2021-2032)
Figure 10. Europe Food Grade Sodium Sulfite Revenue (USD Million) By Country (2021-2032)
Figure 11. Germany Food Grade Sodium Sulfite Revenue (USD Million) By Country (2021-2032)
Figure 12. France Food Grade Sodium Sulfite Revenue (USD Million) By Country (2021-2032)
Figure 13. United Kingdom Food Grade Sodium Sulfite Revenue (USD Million) By Country (2021-2032)
Figure 14. Spain Food Grade Sodium Sulfite Revenue (USD Million) By Country (2021-2032)
Figure 15. Italy Food Grade Sodium Sulfite Revenue (USD Million) By Country (2021-2032)
Figure 16. Russia Food Grade Sodium Sulfite Revenue (USD Million) By Country (2021-2032)
Figure 17. Rest of Europe Food Grade Sodium Sulfite Revenue (USD Million) By Country (2021-2032)
Figure 11. Asia Pacific Food Grade Sodium Sulfite Revenue (USD Million) By Country (2021-2032)
Figure 12. China Food Grade Sodium Sulfite Revenue (USD Million) By Country (2021-2032)
Figure 13. Japan Food Grade Sodium Sulfite Revenue (USD Million) By Country (2021-2032)
Figure 14. India Food Grade Sodium Sulfite Revenue (USD Million) By Country (2021-2032)
Figure 15. South Korea Food Grade Sodium Sulfite Revenue (USD Million) By Country (2021-2032)
Figure 16. Australia Food Grade Sodium Sulfite Revenue (USD Million) By Country (2021-2032)
Figure 17. South East Asia Food Grade Sodium Sulfite Revenue (USD Million) By Country (2021-2032)
Figure 18. South America Food Grade Sodium Sulfite Revenue (USD Million) By Country (2021-2032)
Figure 19. Brazil Food Grade Sodium Sulfite Revenue (USD Million) By Country (2021-2032)
Figure 20. Argentina Food Grade Sodium Sulfite Revenue (USD Million) By Country (2021-2032)
Figure 21. Rest of Asia Pacific Food Grade Sodium Sulfite Revenue (USD Million) By Country (2021-2032)
Figure 22. Middle East and Africa Food Grade Sodium Sulfite Revenue (USD Million) By Region (2021-2032)
Figure 23. Saudi Arabia Food Grade Sodium Sulfite Revenue (USD Million) By Region (2021-2032)
Figure 24. The UAE Food Grade Sodium Sulfite Revenue (USD Million) By Region (2021-2032)
Figure 25. Rest of Middle East Food Grade Sodium Sulfite Revenue (USD Million) By Region (2021-2032)
Figure 26. South Africa Food Grade Sodium Sulfite Revenue (USD Million) By Region (2021-2032)
Figure 27. Africa Food Grade Sodium Sulfite Revenue (USD Million) By Region (2021-2032)
Figure 28. North America Food Grade Sodium Sulfite Revenue (USD Million) By Type (2021-2032)
Figure 29. North America Food Grade Sodium Sulfite Revenue (USD Million) By Application (2021-2032)
Figure 30. North America Food Grade Sodium Sulfite Revenue (USD Million) By Product (2021-2032)
Figure 31. Europe Food Grade Sodium Sulfite Revenue (USD Million) By Type (2021-2032)
Figure 32. Europe Food Grade Sodium Sulfite Revenue (USD Million) By Application (2021-2032)
Figure 33. Europe Food Grade Sodium Sulfite Revenue (USD Million) By Product (2021-2032)
Figure 34. Asia Pacific Food Grade Sodium Sulfite Revenue (USD Million) By Type (2021-2032)
Figure 35. Asia Pacific Food Grade Sodium Sulfite Revenue (USD Million) By Application (2021-2032)
Figure 36. Asia Pacific Food Grade Sodium Sulfite Revenue (USD Million) By Product (2021-2032)
Figure 37. South America Food Grade Sodium Sulfite Revenue (USD Million) By Type (2021-2032)
Figure 38. South America Food Grade Sodium Sulfite Revenue (USD Million) By Application (2021-2032)
Figure 39. South America Food Grade Sodium Sulfite Revenue (USD Million) By Product (2021-2032)
Figure 40. Middle East and Africa Food Grade Sodium Sulfite Revenue (USD Million) By Type (2021-2032)
Figure 41. Middle East and Africa Food Grade Sodium Sulfite Revenue (USD Million) By Application (2021-2032)
Figure 42. Middle East and Africa Food Grade Sodium Sulfite Revenue (USD Million) By Product (2021-2032)
By Type
Powder
Liquid
By Application
Preservative
Bleaching Agent
Oxygen Scavenger
Others
By End-User
Food Industry
Beverages Industry
By Channel
Direct Sales
Distribution Channel
Countries Analyzed
North America (US, Canada, Mexico)
Europe (Germany, UK, France, Spain, Italy, Russia, Rest of Europe)
Asia Pacific (China, India, Japan, South Korea, Australia, South East Asia, Rest of Asia)
South America (Brazil, Argentina, Rest of South America)
Middle East and Africa (Saudi Arabia, UAE, Rest of Middle East, South Africa, Egypt, Rest of Africa)
