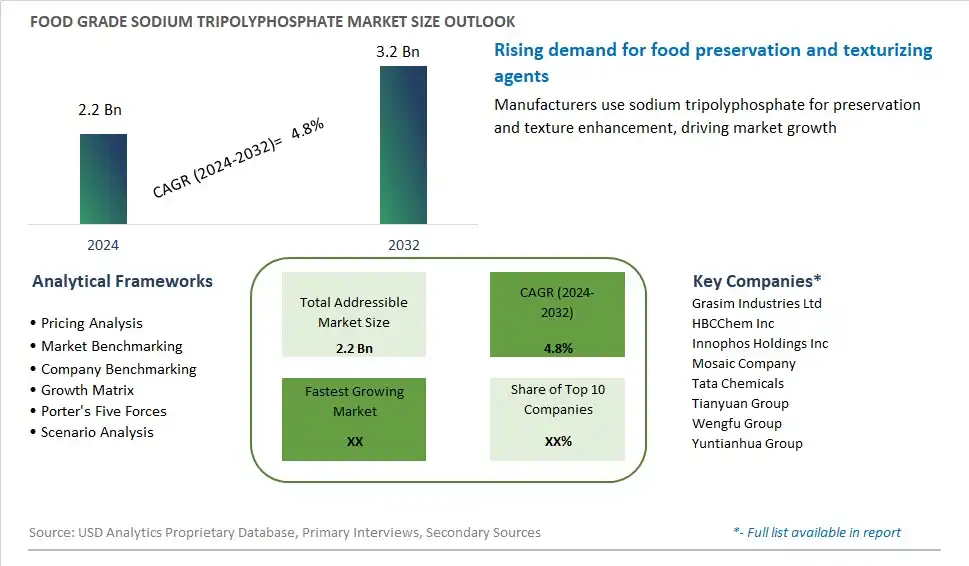
Global Food Grade Sodium Tripolyphosphate Market Size is valued at $2.2 Billion in 2024 and is forecast to register a growth rate (CAGR) of 4.8% to reach $3.2 Billion by 2032.
The global Food Grade Sodium Tripolyphosphate Market Comprehensive Study analyzes and forecasts the market size across 6 regions and 24 countries for diverse segments -By Application (Seafood Processing, Meat Processing), By Distribution Channel (Direct Sales, Indirect Sales), By End-User (Food and Beverage, Food Service)
An Introduction to Food Grade Sodium Tripolyphosphate Market
In 2024, the food grade sodium tripolyphosphate (STPP) market is expanding, driven by its critical role as a preservative and texture enhancer in the food industry. STPP is widely used in seafood, meat, and poultry processing to retain moisture, improve texture, and extend shelf life. The market is supported by the increasing demand for processed and convenience foods, where STPP helps maintain product quality and appearance. Additionally, its use as an emulsifier in dairy products and baked goods further boosts its demand. Regulatory approvals and the trend towards maintaining high standards of food safety and quality support the adoption of STPP. As food manufacturers continue to innovate and enhance product formulations, the market for food grade sodium tripolyphosphate is set to grow, driving market expansion and development.
Food Grade Sodium Tripolyphosphate Competitive Landscape
The market report analyses the leading companies in the industry including Grasim Industries Ltd, HBCChem Inc, Innophos Holdings Inc, Mosaic Company, Tata Chemicals, Tianyuan Group, Wengfu Group, Yuntianhua Group, and Others.
Food Grade Sodium Tripolyphosphate Market Dynamics
Food Grade Sodium Tripolyphosphate Market Trend: Growing Emphasis on Food Safety and Quality Assurance
A prominent trend in the food grade sodium tripolyphosphate market is the growing emphasis on food safety and quality assurance. With increasing concerns about foodborne illnesses and contamination incidents, there's a heightened awareness of the importance of effective food preservation methods and stringent quality control measures in the food industry. Sodium tripolyphosphate, a multifunctional additive with sequestering, emulsifying, and buffering properties, is gaining traction as a key ingredient for maintaining food safety and extending shelf life in a variety of food products. This trend is driven by regulatory requirements, consumer demand for safe and high-quality food products, and the food industry's commitment to meeting stringent safety standards and ensuring product integrity throughout the supply chain. Manufacturers are incorporating food grade sodium tripolyphosphate into a wide range of processed foods, including seafood, meat products, and canned goods, to prevent microbial growth, enhance texture, and preserve product freshness, thereby addressing consumer concerns about food safety and quality.
Market Driver: Growth in Processed Food Industry and Convenience Foods Sector
An essential driver fueling the food grade sodium tripolyphosphate market is the growth in the processed food industry and convenience foods sector. With changing consumer lifestyles, urbanization, and increasing demand for convenient meal options, there's a rising consumption of processed and ready-to-eat food products worldwide. Sodium tripolyphosphate plays a crucial role in the production of processed foods by improving moisture retention, texture, and shelf stability, thereby extending the shelf life of perishable products and reducing food waste. As the processed food industry continues to expand globally, driven by factors such as busy lifestyles, on-the-go consumption habits, and the proliferation of online food delivery services, the demand for food grade sodium tripolyphosphate is expected to rise. Manufacturers are leveraging the functionality and versatility of sodium tripolyphosphate to meet the evolving needs of the processed food industry and capitalize on the growing market for convenient, shelf-stable food products.
Market Opportunity: Expansion into Functional Beverages and Dairy Alternatives
A significant opportunity within the food grade sodium tripolyphosphate market lies in expansion into functional beverages and dairy alternatives. Beyond its traditional applications in processed meats and seafood, sodium tripolyphosphate has the potential to add value to a range of functional food and beverage products aimed at enhancing texture, stability, and mouthfeel. For example, sodium tripolyphosphate can be used in dairy alternatives such as plant-based milk and yogurt to improve emulsion stability, prevent separation, and enhance creaminess. Similarly, it can be incorporated into functional beverages such as protein shakes, meal replacements, and sports drinks to improve dispersibility, suspension, and overall product quality. By tapping into the growing market for functional beverages and dairy alternatives and offering solutions that address key formulation challenges, such as texture enhancement and stability improvement, manufacturers of food grade sodium tripolyphosphate can diversify their product portfolios, reach new consumer segments, and capitalize on emerging trends in the food and beverage industry.
Food Grade Sodium Tripolyphosphate Market Share Analysis: Seafood Processing held the dominant market share in 2024
In the Food Grade Sodium Tripolyphosphate Market, the Seafood Processing segment is the largest, driven by the widespread use of sodium tripolyphosphate (STPP) as a versatile additive in seafood processing. STPP serves as a crucial component in the seafood industry, where it is utilized for its water-retention properties, texture enhancement, and preservation effects. As a water-binding agent, STPP helps seafood products retain moisture during processing and storage, preventing dehydration and maintaining freshness. Additionally, STPP functions as a pH regulator, improving the overall texture and appearance of seafood products such as shrimp, fish fillets, and scallops. Further, STPP's ability to inhibit the growth of spoilage bacteria and prolong the shelf life of seafood products further reinforces its dominance in the Seafood Processing segment. With the growing demand for processed seafood products and the need for extended shelf life in the seafood industry, the Seafood Processing segment remains the largest in the Food Grade Sodium Tripolyphosphate Market.
Food Grade Sodium Tripolyphosphate Market Share Analysis: Indirect Sales market is poised to register the fastest growth rae over the forecast period to 2032
In the Food Grade Sodium Tripolyphosphate Market, the Indirect Sales segment is the fastest-growing, propelled by the increasing adoption of sodium tripolyphosphate (STPP) by various intermediaries and distribution channels. Indirect sales channels, such as wholesalers, distributors, and retailers, play a crucial role in expanding the reach of STPP to a diverse range of end-users in the food processing industry. These channels offer convenience, accessibility, and logistical support to food manufacturers, enabling them to procure STPP in bulk quantities efficiently. Further, indirect sales channels provide value-added services such as product storage, transportation, and inventory management, which are essential for meeting the dynamic demands of the food industry. Additionally, the presence of established distribution networks and partnerships with key players further accelerates the penetration of STPP into new markets and geographic regions. With the continuous expansion of the food processing industry and the increasing demand for STPP as a multifunctional additive, the Indirect Sales segment in the Food Grade Sodium Tripolyphosphate Market is poised for rapid growth in the foreseeable future.
Food Grade Sodium Tripolyphosphate Market Share Analysis: Food and Beverage held the dominant market share in 2024
In the Food Grade Sodium Tripolyphosphate Market, the Food and Beverage segment is the largest, driven by the extensive use of sodium tripolyphosphate (STPP) as a versatile additive in various food and beverage applications. STPP serves as a crucial ingredient in food processing, where it functions as a water-retention agent, emulsifier, and texture enhancer. In the food industry, STPP is utilized in a wide range of products, including processed meats, seafood, dairy products, and beverages, to improve texture, appearance, and shelf life. Further, STPP's ability to enhance the water-binding capacity of food products makes it an essential component in meat brining, seafood processing, and bakery formulations. Additionally, STPP's regulatory approval for use in food products and its recognized safety profile further reinforce its dominance in the Food and Beverage segment. With the food industry's continuous innovation and the growing consumer demand for high-quality and convenient food products, the Food and Beverage segment maintains its position as the largest in the Food Grade Sodium Tripolyphosphate Market.
Food Grade Sodium Tripolyphosphate Market Segmentation
By Application
Seafood Processing
Meat Processing
By Distribution Channel
Direct Sales
Indirect Sales
By End-User
Food and Beverage
Food Service
Countries Analyzed
North America (US, Canada, Mexico)
Europe (Germany, UK, France, Spain, Italy, Russia, Rest of Europe)
Asia Pacific (China, India, Japan, South Korea, Australia, South East Asia, Rest of Asia)
South America (Brazil, Argentina, Rest of South America)
Middle East and Africa (Saudi Arabia, UAE, Rest of Middle East, South Africa, Egypt, Rest of Africa)
Food Grade Sodium Tripolyphosphate Companies Profiled in the Study
Grasim Industries Ltd
HBCChem Inc
Innophos Holdings Inc
Mosaic Company
Tata Chemicals
Tianyuan Group
Wengfu Group
Yuntianhua Group
*- List Not Exhaustive
Chapter 1. TABLE OF CONTENTS
Chapter 2. Introduction to Food Grade Sodium Tripolyphosphate Market
2.1. Market Overview
2.2. Key Statistics and Report Highlights
2.3. Scope of the Comprehensive Study
2.3.1. Market Definition
2.3.2 Countries and Regions Covered
2.3.3 Research Objective
2.3.4 Units, Currency, and Conversions
2.3.5 Industry Value Chain
2.4. Key Market Segments
2.5. Key Companies
2.6. Study Period
Chapter 3. Strategic Analysis Review
3.1. Food Grade Sodium Tripolyphosphate Pricing Analysis and Forecast
3.2. Porter’s Five Forces
3.3. Market Ecosystem
3.4. SWOT Analysis
3.5. Regulatory Scenario
3.3. Effects of Inflation, Russia-Ukraine War, moderating economic growth, and other macroeconomic factors
Chapter 4. Competitive Landscape
4.1. Market Share Analysis
4.1.1. Global Food Grade Sodium Tripolyphosphate Market Share by Company, 2023
4.1.2. Product Offerings of Leading Food Grade Sodium Tripolyphosphate Companies
4.2. Market Entropy
4.2.1. New Product Launches in the Industry
4.2.2. Mergers, Acquisitions, Joint ventures, and Partnerships
4.3. Key Strategies and Best Practices
Chapter 5. Global Market Projections: Best, Reference, and Low Case Scenarios
5.1. Growth Analysis- Case Scenario Definitions
5.2. Low Growth Case Scenario Forecasts
5.3. Reference Growth Case Scenario Forecasts
5.4. High Growth Case Scenario Forecasts
Chapter 6. Market Dynamics
6.1. Food Grade Sodium Tripolyphosphate Market Drivers
6.2. Food Grade Sodium Tripolyphosphate Market Challenges
6.6. Food Grade Sodium Tripolyphosphate Market Opportunities
6.4. Food Grade Sodium Tripolyphosphate Market Trends
Chapter 7. Global Food Grade Sodium Tripolyphosphate Market Outlook Trends
7.1. Global Food Grade Sodium Tripolyphosphate Revenue (USD Million) and CAGR (%) by Type (2021-2032)
7.2. Global Food Grade Sodium Tripolyphosphate Revenue (USD Million) and CAGR (%) by Application (2021-2032)
7.3. Global Food Grade Sodium Tripolyphosphate Revenue (USD Million) and CAGR (%) by Product (2021-2032)
By Application
Seafood Processing
Meat Processing
By Distribution Channel
Direct Sales
Indirect Sales
By End-User
Food and Beverage
Food Service
Chapter 8. Global Food Grade Sodium Tripolyphosphate Regional Analysis and Outlook
8.1. Global Food Grade Sodium Tripolyphosphate Revenue (USD Million) By Regions (2021- 2032)
8.2. North America Food Grade Sodium Tripolyphosphate Revenue (USD Million) by Country (2021-2032)
8.2.1. United States Food Grade Sodium Tripolyphosphate Regional Analysis and Outlook
8.2.2. Canada Food Grade Sodium Tripolyphosphate Regional Analysis and Outlook
8.2.3. Mexico Food Grade Sodium Tripolyphosphate Regional Analysis and Outlook
8.3. Europe Food Grade Sodium Tripolyphosphate Revenue (USD Million), by Country (2021-2032)
8.3.1. Germany Food Grade Sodium Tripolyphosphate Regional Analysis and Outlook
8.3.2. France Food Grade Sodium Tripolyphosphate Regional Analysis and Outlook
8.3.3. United Kingdom Food Grade Sodium Tripolyphosphate Regional Analysis and Outlook
8.3.4. Spain Food Grade Sodium Tripolyphosphate Regional Analysis and Outlook
8.3.5. Italy Food Grade Sodium Tripolyphosphate Regional Analysis and Outlook
8.3.6. Russia Food Grade Sodium Tripolyphosphate Regional Analysis and Outlook
8.3.7. Rest of Europe Food Grade Sodium Tripolyphosphate Regional Analysis and Outlook
8.4. Asia Pacific Food Grade Sodium Tripolyphosphate Revenue (USD Million) by Country (2021-2032)
8.4.1. China Food Grade Sodium Tripolyphosphate Regional Analysis and Outlook
8.4.2. Japan Food Grade Sodium Tripolyphosphate Regional Analysis and Outlook
8.4.3. India Food Grade Sodium Tripolyphosphate Regional Analysis and Outlook
8.4.4. South Korea Food Grade Sodium Tripolyphosphate Regional Analysis and Outlook
8.4.5. Australia Food Grade Sodium Tripolyphosphate Regional Analysis and Outlook
8.4.6. South East Asia Food Grade Sodium Tripolyphosphate Regional Analysis and Outlook
8.4.7. Rest of Asia Pacific Food Grade Sodium Tripolyphosphate Regional Analysis and Outlook
8.5. South America Food Grade Sodium Tripolyphosphate Revenue (USD Million), by Country (2021-2032)
8.5.1. Brazil Food Grade Sodium Tripolyphosphate Regional Analysis and Outlook
8.5.2. Argentina Food Grade Sodium Tripolyphosphate Regional Analysis and Outlook
8.5.3. Rest of South America Food Grade Sodium Tripolyphosphate Regional Analysis and Outlook
8.6. Middle East and Africa Food Grade Sodium Tripolyphosphate Revenue (USD Million) by Country (2021-2032)
8.6.1. Middle East Food Grade Sodium Tripolyphosphate Regional Analysis and Outlook
8.6.2. Africa Food Grade Sodium Tripolyphosphate Regional Analysis and Outlook
Chapter 9. North America Food Grade Sodium Tripolyphosphate Analysis and Outlook
9.1. North America Food Grade Sodium Tripolyphosphate Revenue (USD Million) by Segments (2021-2032)
9.1.1. North America Food Grade Sodium Tripolyphosphate Revenue (USD Million) by Type (2021-2032)
9.1.2. North America Food Grade Sodium Tripolyphosphate Revenue (USD Million) by Application (2021-2032)
9.1.3. North America Food Grade Sodium Tripolyphosphate Revenue (USD Million) by Product (2021-2032)
By Application
Seafood Processing
Meat Processing
By Distribution Channel
Direct Sales
Indirect Sales
By End-User
Food and Beverage
Food Service
Chapter 10. Europe Food Grade Sodium Tripolyphosphate Analysis and Outlook
10.1. Europe Food Grade Sodium Tripolyphosphate Revenue (USD Million), by Segments (USD Million) (2021-2032)
10.1.1. Europe Food Grade Sodium Tripolyphosphate Revenue (USD Million) by Type (2021-2032)
10.1.2. Europe Food Grade Sodium Tripolyphosphate Revenue (USD Million) by Application (2021-2032)
10.1.3. Europe Food Grade Sodium Tripolyphosphate Revenue (USD Million) by Product (2021-2032)
By Application
Seafood Processing
Meat Processing
By Distribution Channel
Direct Sales
Indirect Sales
By End-User
Food and Beverage
Food Service
Chapter 11. Asia Pacific Food Grade Sodium Tripolyphosphate Analysis and Outlook
11.1. Asia Pacific Food Grade Sodium Tripolyphosphate Revenue (USD Million), and Revenue (USD Million) by Segments (2021-2032)
11.1.1. Asia Pacific Food Grade Sodium Tripolyphosphate Revenue (USD Million) by Type (2021-2032)
11.1.2. Asia Pacific Food Grade Sodium Tripolyphosphate Revenue (USD Million) by Application (2021-2032)
11.1.3. Asia Pacific Food Grade Sodium Tripolyphosphate Revenue (USD Million) by Product (2021-2032)
By Application
Seafood Processing
Meat Processing
By Distribution Channel
Direct Sales
Indirect Sales
By End-User
Food and Beverage
Food Service
Chapter 12. South America Food Grade Sodium Tripolyphosphate Analysis and Outlook
12.1. South America Food Grade Sodium Tripolyphosphate Revenue (USD Million), by Segments (2021-2032)
12.1.1. South America Food Grade Sodium Tripolyphosphate Revenue (USD Million) by Type (2021-2032)
12.1.2. South America Food Grade Sodium Tripolyphosphate Revenue (USD Million) by Application (2021-2032)
12.1.3. South America Food Grade Sodium Tripolyphosphate Revenue (USD Million) by Product (2021-2032)
By Application
Seafood Processing
Meat Processing
By Distribution Channel
Direct Sales
Indirect Sales
By End-User
Food and Beverage
Food Service
Chapter 13. Middle East and Africa Food Grade Sodium Tripolyphosphate Analysis and Outlook
13.1. Middle East and Africa Food Grade Sodium Tripolyphosphate Revenue (USD Million), by Segments (2021-2032)
13.1.1. Middle East and Africa Food Grade Sodium Tripolyphosphate Revenue (USD Million) by Type (2021-2032)
13.1.2. Middle East and Africa Food Grade Sodium Tripolyphosphate Revenue (USD Million) by Application (2021-2032)
13.1.3. Middle East and Africa Food Grade Sodium Tripolyphosphate Revenue (USD Million) by Product (2021-2032)
By Application
Seafood Processing
Meat Processing
By Distribution Channel
Direct Sales
Indirect Sales
By End-User
Food and Beverage
Food Service
Chapter 14. Food Grade Sodium Tripolyphosphate Company Profiles
14.1 Business Overview
14.2 Product Profiles
14.3 SWOT Profiles
14.5 Recent Developments
14.6 Financial Profile
List of Companies
Grasim Industries Ltd
HBCChem Inc
Innophos Holdings Inc
Mosaic Company
Tata Chemicals
Tianyuan Group
Wengfu Group
Yuntianhua Group
15. Methodology and Data Sources
15.1 Customization Offerings
15.2 Subscription Services
15.3 Related Reports
15.4 Publisher Expertise
LIST OF TABLES
Table 1 Market Segmentation Analysis
Table 2 Global Food Grade Sodium Tripolyphosphate Market Share of Leading Companies, 2023
Table 3 Product Offerings of Leading Companies
Table 4 Low Growth Scenario Forecasts
Table 5 Reference Case Growth Scenario
Table 6 High Growth Case Scenario
Table 7 Global Food Grade Sodium Tripolyphosphate Revenue (USD Million) And CAGR (%) By Type (2021-2032)
Table 8 Global Food Grade Sodium Tripolyphosphate Revenue (USD Million) And CAGR (%) By Application (2021-2032)
Table 9 Global Food Grade Sodium Tripolyphosphate Revenue (USD Million) And CAGR (%) By Product (2021-2032)
Table 10 Global Food Grade Sodium Tripolyphosphate Market Revenue (USD Million) By Regions (2021-2032)
Table 11 Global Food Grade Sodium Tripolyphosphate Market Share (%) By Regions (2021-2032)
Table 12 North America Food Grade Sodium Tripolyphosphate Revenue (USD Million) By Country (2021-2032)
Table 13 Europe Food Grade Sodium Tripolyphosphate Revenue (USD Million) By Country (2021-2032)
Table 14 Asia Pacific Food Grade Sodium Tripolyphosphate Revenue (USD Million) By Country (2021-2032)
Table 15 South America Food Grade Sodium Tripolyphosphate Revenue (USD Million) By Country (2021-2032)
Table 16 Middle East and Africa Food Grade Sodium Tripolyphosphate Revenue (USD Million) By Region (2021-2032)
Table 17 North America Food Grade Sodium Tripolyphosphate Revenue (USD Million) By Type (2021-2032)
Table 18 North America Food Grade Sodium Tripolyphosphate Revenue (USD Million) By Application (2021-2032)
Table 19 North America Food Grade Sodium Tripolyphosphate Revenue (USD Million) By Product (2021-2032)
Table 20 Europe Food Grade Sodium Tripolyphosphate Revenue (USD Million) By Type (2021-2032)
Table 21 Europe Food Grade Sodium Tripolyphosphate Revenue (USD Million) By Application (2021-2032)
Table 22 Europe Food Grade Sodium Tripolyphosphate Revenue (USD Million) By Product (2021-2032)
Table 23 Asia Pacific Food Grade Sodium Tripolyphosphate Revenue (USD Million) By Type (2021-2032)
Table 24 Asia Pacific Food Grade Sodium Tripolyphosphate Revenue (USD Million) By Application (2021-2032)
Table 25 Asia Pacific Food Grade Sodium Tripolyphosphate Revenue (USD Million) By Product (2021-2032)
Table 26 South America Food Grade Sodium Tripolyphosphate Revenue (USD Million) By Type (2021-2032)
Table 27 South America Food Grade Sodium Tripolyphosphate Revenue (USD Million) By Application (2021-2032)
Table 28 South America Food Grade Sodium Tripolyphosphate Revenue (USD Million) By Product (2021-2032)
Table 29 Middle East and Africa Food Grade Sodium Tripolyphosphate Revenue (USD Million) By Type (2021-2032)
Table 30 Middle East and Africa Food Grade Sodium Tripolyphosphate Revenue (USD Million) By Application (2021-2032)
Table 31 Middle East and Africa Food Grade Sodium Tripolyphosphate Revenue (USD Million) By Product (2021-2032)
LIST OF FIGURES
Figure 1. Market Scope
Figure 2. Pricing Forecasts Per Unit, 2023- 2032
Figure 3. Porter’s Five Forces
Figure 4. Global Food Grade Sodium Tripolyphosphate Market Revenue (USD Million) By Regions (2021-2032)
Figure 5. Global Food Grade Sodium Tripolyphosphate Market Share (%) By Regions (2023)
Figure 6. North America Food Grade Sodium Tripolyphosphate Revenue (USD Million) By Country (2021-2032)
Figure 7. United States Food Grade Sodium Tripolyphosphate Revenue (USD Million) By Country (2021-2032)
Figure 8. Canada Food Grade Sodium Tripolyphosphate Revenue (USD Million) By Country (2021-2032)
Figure 9. Mexico Food Grade Sodium Tripolyphosphate Revenue (USD Million) By Country (2021-2032)
Figure 10. Europe Food Grade Sodium Tripolyphosphate Revenue (USD Million) By Country (2021-2032)
Figure 11. Germany Food Grade Sodium Tripolyphosphate Revenue (USD Million) By Country (2021-2032)
Figure 12. France Food Grade Sodium Tripolyphosphate Revenue (USD Million) By Country (2021-2032)
Figure 13. United Kingdom Food Grade Sodium Tripolyphosphate Revenue (USD Million) By Country (2021-2032)
Figure 14. Spain Food Grade Sodium Tripolyphosphate Revenue (USD Million) By Country (2021-2032)
Figure 15. Italy Food Grade Sodium Tripolyphosphate Revenue (USD Million) By Country (2021-2032)
Figure 16. Russia Food Grade Sodium Tripolyphosphate Revenue (USD Million) By Country (2021-2032)
Figure 17. Rest of Europe Food Grade Sodium Tripolyphosphate Revenue (USD Million) By Country (2021-2032)
Figure 11. Asia Pacific Food Grade Sodium Tripolyphosphate Revenue (USD Million) By Country (2021-2032)
Figure 12. China Food Grade Sodium Tripolyphosphate Revenue (USD Million) By Country (2021-2032)
Figure 13. Japan Food Grade Sodium Tripolyphosphate Revenue (USD Million) By Country (2021-2032)
Figure 14. India Food Grade Sodium Tripolyphosphate Revenue (USD Million) By Country (2021-2032)
Figure 15. South Korea Food Grade Sodium Tripolyphosphate Revenue (USD Million) By Country (2021-2032)
Figure 16. Australia Food Grade Sodium Tripolyphosphate Revenue (USD Million) By Country (2021-2032)
Figure 17. South East Asia Food Grade Sodium Tripolyphosphate Revenue (USD Million) By Country (2021-2032)
Figure 18. South America Food Grade Sodium Tripolyphosphate Revenue (USD Million) By Country (2021-2032)
Figure 19. Brazil Food Grade Sodium Tripolyphosphate Revenue (USD Million) By Country (2021-2032)
Figure 20. Argentina Food Grade Sodium Tripolyphosphate Revenue (USD Million) By Country (2021-2032)
Figure 21. Rest of Asia Pacific Food Grade Sodium Tripolyphosphate Revenue (USD Million) By Country (2021-2032)
Figure 22. Middle East and Africa Food Grade Sodium Tripolyphosphate Revenue (USD Million) By Region (2021-2032)
Figure 23. Saudi Arabia Food Grade Sodium Tripolyphosphate Revenue (USD Million) By Region (2021-2032)
Figure 24. The UAE Food Grade Sodium Tripolyphosphate Revenue (USD Million) By Region (2021-2032)
Figure 25. Rest of Middle East Food Grade Sodium Tripolyphosphate Revenue (USD Million) By Region (2021-2032)
Figure 26. South Africa Food Grade Sodium Tripolyphosphate Revenue (USD Million) By Region (2021-2032)
Figure 27. Africa Food Grade Sodium Tripolyphosphate Revenue (USD Million) By Region (2021-2032)
Figure 28. North America Food Grade Sodium Tripolyphosphate Revenue (USD Million) By Type (2021-2032)
Figure 29. North America Food Grade Sodium Tripolyphosphate Revenue (USD Million) By Application (2021-2032)
Figure 30. North America Food Grade Sodium Tripolyphosphate Revenue (USD Million) By Product (2021-2032)
Figure 31. Europe Food Grade Sodium Tripolyphosphate Revenue (USD Million) By Type (2021-2032)
Figure 32. Europe Food Grade Sodium Tripolyphosphate Revenue (USD Million) By Application (2021-2032)
Figure 33. Europe Food Grade Sodium Tripolyphosphate Revenue (USD Million) By Product (2021-2032)
Figure 34. Asia Pacific Food Grade Sodium Tripolyphosphate Revenue (USD Million) By Type (2021-2032)
Figure 35. Asia Pacific Food Grade Sodium Tripolyphosphate Revenue (USD Million) By Application (2021-2032)
Figure 36. Asia Pacific Food Grade Sodium Tripolyphosphate Revenue (USD Million) By Product (2021-2032)
Figure 37. South America Food Grade Sodium Tripolyphosphate Revenue (USD Million) By Type (2021-2032)
Figure 38. South America Food Grade Sodium Tripolyphosphate Revenue (USD Million) By Application (2021-2032)
Figure 39. South America Food Grade Sodium Tripolyphosphate Revenue (USD Million) By Product (2021-2032)
Figure 40. Middle East and Africa Food Grade Sodium Tripolyphosphate Revenue (USD Million) By Type (2021-2032)
Figure 41. Middle East and Africa Food Grade Sodium Tripolyphosphate Revenue (USD Million) By Application (2021-2032)
Figure 42. Middle East and Africa Food Grade Sodium Tripolyphosphate Revenue (USD Million) By Product (2021-2032)
By Application
Seafood Processing
Meat Processing
By Distribution Channel
Direct Sales
Indirect Sales
By End-User
Food and Beverage
Food Service
Countries Analyzed
North America (US, Canada, Mexico)
Europe (Germany, UK, France, Spain, Italy, Russia, Rest of Europe)
Asia Pacific (China, India, Japan, South Korea, Australia, South East Asia, Rest of Asia)
South America (Brazil, Argentina, Rest of South America)
Middle East and Africa (Saudi Arabia, UAE, Rest of Middle East, South Africa, Egypt, Rest of Africa)
