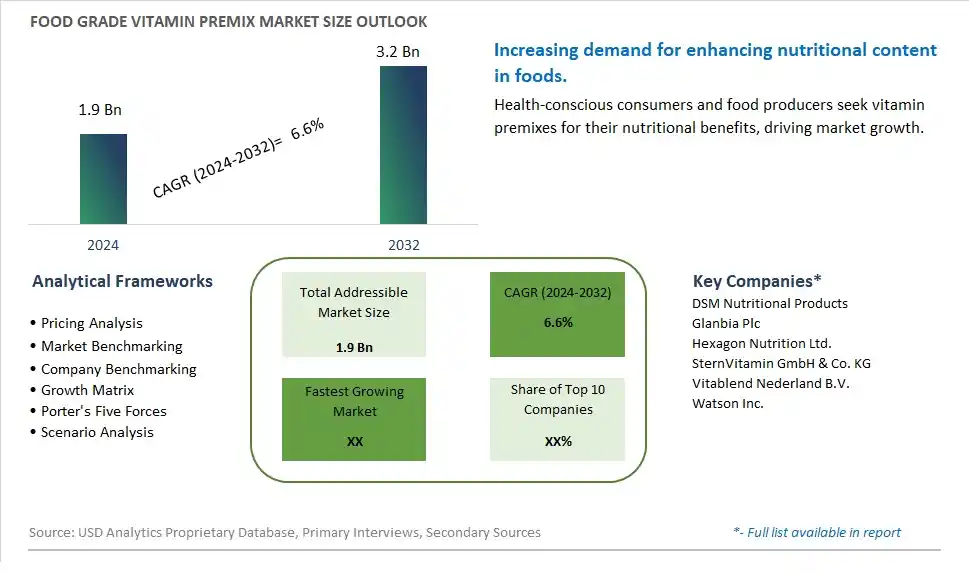
Global Food Grade Vitamin Premix Market Size is valued at $1.9 Billion in 2024 and is forecast to register a growth rate (CAGR) of 6.6% to reach $3.2 Billion by 2032.
The global Food Grade Vitamin Premix Market Comprehensive Study analyzes and forecasts the market size across 6 regions and 24 countries for diverse segments -By Type (10% Effective Substance Content, 20% Effective Substance Content, 30% Effective Substance Content), By Application (Infant Formulae, Clinical Nutrition, Sport Nutrition, Nutritional Drinks, Dairy)
An Introduction to Food Grade Vitamin Premix Market
The Food Grade Vitamin Premix market in 2024 is experiencing significant growth, driven by the increasing demand for nutrient fortification in food and beverage products. Food grade vitamin premixes, which combine various vitamins tailored to specific nutritional needs, are used in applications such as infant formula, dairy products, and functional foods. The market benefits from advancements in premix formulation and delivery technologies, the growing trend of health and wellness, and the expansion of the functional food and beverage sectors. Additionally, government initiatives to address nutritional deficiencies and promote public health are contributing to market growth.
Food Grade Vitamin Premix Competitive Landscape
The market report analyses the leading companies in the industry including DSM Nutritional Products, Glanbia Plc, Hexagon Nutrition Ltd., SternVitamin GmbH & Co. KG, Vitablend Nederland B.V., Watson Inc., and Others.
Food Grade Vitamin Premix Market Dynamics
Food Grade Vitamin Premix Market Trend: Growing Demand for Nutrient-Enriched Foods
The most prominent trend in the Food Grade Vitamin Premix Market is the growing demand for nutrient-enriched foods. Consumers are increasingly seeking food products that provide additional health benefits, such as improved nutrition and enhanced wellness. This trend is driven by the health and wellness movement, which emphasizes the importance of balanced diets and the role of fortified foods in addressing nutritional deficiencies.
Food Grade Vitamin Premix Market Driver: Increase in Health-Conscious Consumers
The key driver of the Food Grade Vitamin Premix Market is the increase in health-conscious consumers. As more people focus on their health and dietary choices, there is a higher demand for food products that offer added nutritional value. Vitamin premixes, which can be easily incorporated into various food and beverage products, provide a convenient way for manufacturers to enhance the nutritional profile of their offerings and attract health-conscious consumers.
Food Grade Vitamin Premix Market Opportunity: Expansion into Functional and Specialty Foods
A significant opportunity in the Food Grade Vitamin Premix Market lies in the expansion into functional and specialty foods. By developing vitamin premixes tailored to specific health needs, such as immune support, cognitive function, and energy enhancement, companies can create targeted products that appeal to niche consumer segments. This approach can help manufacturers differentiate their products and capture a larger share of the growing market for functional and specialty foods.
Food Grade Vitamin Premix Market Share Analysis: 20% Effective Substance Content segment generated the highest revenue share in the industry
In the Food Grade Vitamin Premix market, the segment with 20% Effective Substance Content stands out as the largest. Vitamin premixes with 20% effective substance content are widely used in various food and nutritional products due to their balanced potency and suitability for diverse applications. They are commonly incorporated into food formulations to fortify products with essential vitamins, ensuring nutritional adequacy and health benefits for consumers across different age groups and dietary needs. This segment's dominance is driven by the versatility of 20% effective substance content premixes, which meet the stringent regulatory requirements for food fortification while effectively addressing consumer demands for enhanced nutritional value in everyday food items.
Food Grade Vitamin Premix Market Share Analysis: Clinical Nutrition is the fastest growing segment over the forecast period to 2032
Among the segments in the Food Grade Vitamin Premix market, Clinical Nutrition is expected to experience the fastest growth rate through 2032. Clinical nutrition applications utilize vitamin premixes to formulate specialized nutritional products tailored for medical conditions and dietary therapies. These premixes are crucial in the production of therapeutic foods, enteral nutrition products, and dietary supplements designed to meet specific health needs, such as for patients recovering from illnesses, undergoing medical treatments, or managing chronic conditions. The increasing prevalence of chronic diseases, coupled with rising healthcare expenditures globally, is driving the demand for clinical nutrition solutions that incorporate precise and balanced vitamin compositions to support therapeutic outcomes and improve patient health. Thus, the Clinical Nutrition segment is poised to expand rapidly, driven by advancements in medical nutrition research and growing consumer awareness of personalized health management solutions.
Food Grade Vitamin Premix Market Segmentation
By Type
10% Effective Substance Content
20% Effective Substance Content
30% Effective Substance Content
By Application
Infant Formulae
Clinical Nutrition
Sport Nutrition
Nutritional Drinks
Dairy
Countries Analyzed
North America (US, Canada, Mexico)
Europe (Germany, UK, France, Spain, Italy, Russia, Rest of Europe)
Asia Pacific (China, India, Japan, South Korea, Australia, South East Asia, Rest of Asia)
South America (Brazil, Argentina, Rest of South America)
Middle East and Africa (Saudi Arabia, UAE, Rest of Middle East, South Africa, Egypt, Rest of Africa)
Food Grade Vitamin Premix Companies Profiled in the Study
DSM Nutritional Products
Glanbia Plc
Hexagon Nutrition Ltd.
SternVitamin GmbH & Co. KG
Vitablend Nederland B.V.
Watson Inc.
*- List Not Exhaustive
Chapter 1. TABLE OF CONTENTS
Chapter 2. Introduction to Food Grade Vitamin Premix Market
2.1. Market Overview
2.2. Key Statistics and Report Highlights
2.3. Scope of the Comprehensive Study
2.3.1. Market Definition
2.3.2 Countries and Regions Covered
2.3.3 Research Objective
2.3.4 Units, Currency, and Conversions
2.3.5 Industry Value Chain
2.4. Key Market Segments
2.5. Key Companies
2.6. Study Period
Chapter 3. Strategic Analysis Review
3.1. Food Grade Vitamin Premix Pricing Analysis and Forecast
3.2. Porter’s Five Forces
3.3. Market Ecosystem
3.4. SWOT Analysis
3.5. Regulatory Scenario
3.3. Effects of Inflation, Russia-Ukraine War, moderating economic growth, and other macroeconomic factors
Chapter 4. Competitive Landscape
4.1. Market Share Analysis
4.1.1. Global Food Grade Vitamin Premix Market Share by Company, 2023
4.1.2. Product Offerings of Leading Food Grade Vitamin Premix Companies
4.2. Market Entropy
4.2.1. New Product Launches in the Industry
4.2.2. Mergers, Acquisitions, Joint ventures, and Partnerships
4.3. Key Strategies and Best Practices
Chapter 5. Global Market Projections: Best, Reference, and Low Case Scenarios
5.1. Growth Analysis- Case Scenario Definitions
5.2. Low Growth Case Scenario Forecasts
5.3. Reference Growth Case Scenario Forecasts
5.4. High Growth Case Scenario Forecasts
Chapter 6. Market Dynamics
6.1. Food Grade Vitamin Premix Market Drivers
6.2. Food Grade Vitamin Premix Market Challenges
6.6. Food Grade Vitamin Premix Market Opportunities
6.4. Food Grade Vitamin Premix Market Trends
Chapter 7. Global Food Grade Vitamin Premix Market Outlook Trends
7.1. Global Food Grade Vitamin Premix Revenue (USD Million) and CAGR (%) by Type (2021-2032)
7.2. Global Food Grade Vitamin Premix Revenue (USD Million) and CAGR (%) by Application (2021-2032)
7.3. Global Food Grade Vitamin Premix Revenue (USD Million) and CAGR (%) by Product (2021-2032)
By Type
10% Effective Substance Content
20% Effective Substance Content
30% Effective Substance Content
By Application
Infant Formulae
Clinical Nutrition
Sport Nutrition
Nutritional Drinks
Dairy
Chapter 8. Global Food Grade Vitamin Premix Regional Analysis and Outlook
8.1. Global Food Grade Vitamin Premix Revenue (USD Million) By Regions (2021- 2032)
8.2. North America Food Grade Vitamin Premix Revenue (USD Million) by Country (2021-2032)
8.2.1. United States Food Grade Vitamin Premix Regional Analysis and Outlook
8.2.2. Canada Food Grade Vitamin Premix Regional Analysis and Outlook
8.2.3. Mexico Food Grade Vitamin Premix Regional Analysis and Outlook
8.3. Europe Food Grade Vitamin Premix Revenue (USD Million), by Country (2021-2032)
8.3.1. Germany Food Grade Vitamin Premix Regional Analysis and Outlook
8.3.2. France Food Grade Vitamin Premix Regional Analysis and Outlook
8.3.3. United Kingdom Food Grade Vitamin Premix Regional Analysis and Outlook
8.3.4. Spain Food Grade Vitamin Premix Regional Analysis and Outlook
8.3.5. Italy Food Grade Vitamin Premix Regional Analysis and Outlook
8.3.6. Russia Food Grade Vitamin Premix Regional Analysis and Outlook
8.3.7. Rest of Europe Food Grade Vitamin Premix Regional Analysis and Outlook
8.4. Asia Pacific Food Grade Vitamin Premix Revenue (USD Million) by Country (2021-2032)
8.4.1. China Food Grade Vitamin Premix Regional Analysis and Outlook
8.4.2. Japan Food Grade Vitamin Premix Regional Analysis and Outlook
8.4.3. India Food Grade Vitamin Premix Regional Analysis and Outlook
8.4.4. South Korea Food Grade Vitamin Premix Regional Analysis and Outlook
8.4.5. Australia Food Grade Vitamin Premix Regional Analysis and Outlook
8.4.6. South East Asia Food Grade Vitamin Premix Regional Analysis and Outlook
8.4.7. Rest of Asia Pacific Food Grade Vitamin Premix Regional Analysis and Outlook
8.5. South America Food Grade Vitamin Premix Revenue (USD Million), by Country (2021-2032)
8.5.1. Brazil Food Grade Vitamin Premix Regional Analysis and Outlook
8.5.2. Argentina Food Grade Vitamin Premix Regional Analysis and Outlook
8.5.3. Rest of South America Food Grade Vitamin Premix Regional Analysis and Outlook
8.6. Middle East and Africa Food Grade Vitamin Premix Revenue (USD Million) by Country (2021-2032)
8.6.1. Middle East Food Grade Vitamin Premix Regional Analysis and Outlook
8.6.2. Africa Food Grade Vitamin Premix Regional Analysis and Outlook
Chapter 9. North America Food Grade Vitamin Premix Analysis and Outlook
9.1. North America Food Grade Vitamin Premix Revenue (USD Million) by Segments (2021-2032)
9.1.1. North America Food Grade Vitamin Premix Revenue (USD Million) by Type (2021-2032)
9.1.2. North America Food Grade Vitamin Premix Revenue (USD Million) by Application (2021-2032)
9.1.3. North America Food Grade Vitamin Premix Revenue (USD Million) by Product (2021-2032)
By Type
10% Effective Substance Content
20% Effective Substance Content
30% Effective Substance Content
By Application
Infant Formulae
Clinical Nutrition
Sport Nutrition
Nutritional Drinks
Dairy
Chapter 10. Europe Food Grade Vitamin Premix Analysis and Outlook
10.1. Europe Food Grade Vitamin Premix Revenue (USD Million), by Segments (USD Million) (2021-2032)
10.1.1. Europe Food Grade Vitamin Premix Revenue (USD Million) by Type (2021-2032)
10.1.2. Europe Food Grade Vitamin Premix Revenue (USD Million) by Application (2021-2032)
10.1.3. Europe Food Grade Vitamin Premix Revenue (USD Million) by Product (2021-2032)
By Type
10% Effective Substance Content
20% Effective Substance Content
30% Effective Substance Content
By Application
Infant Formulae
Clinical Nutrition
Sport Nutrition
Nutritional Drinks
Dairy
Chapter 11. Asia Pacific Food Grade Vitamin Premix Analysis and Outlook
11.1. Asia Pacific Food Grade Vitamin Premix Revenue (USD Million), and Revenue (USD Million) by Segments (2021-2032)
11.1.1. Asia Pacific Food Grade Vitamin Premix Revenue (USD Million) by Type (2021-2032)
11.1.2. Asia Pacific Food Grade Vitamin Premix Revenue (USD Million) by Application (2021-2032)
11.1.3. Asia Pacific Food Grade Vitamin Premix Revenue (USD Million) by Product (2021-2032)
By Type
10% Effective Substance Content
20% Effective Substance Content
30% Effective Substance Content
By Application
Infant Formulae
Clinical Nutrition
Sport Nutrition
Nutritional Drinks
Dairy
Chapter 12. South America Food Grade Vitamin Premix Analysis and Outlook
12.1. South America Food Grade Vitamin Premix Revenue (USD Million), by Segments (2021-2032)
12.1.1. South America Food Grade Vitamin Premix Revenue (USD Million) by Type (2021-2032)
12.1.2. South America Food Grade Vitamin Premix Revenue (USD Million) by Application (2021-2032)
12.1.3. South America Food Grade Vitamin Premix Revenue (USD Million) by Product (2021-2032)
By Type
10% Effective Substance Content
20% Effective Substance Content
30% Effective Substance Content
By Application
Infant Formulae
Clinical Nutrition
Sport Nutrition
Nutritional Drinks
Dairy
Chapter 13. Middle East and Africa Food Grade Vitamin Premix Analysis and Outlook
13.1. Middle East and Africa Food Grade Vitamin Premix Revenue (USD Million), by Segments (2021-2032)
13.1.1. Middle East and Africa Food Grade Vitamin Premix Revenue (USD Million) by Type (2021-2032)
13.1.2. Middle East and Africa Food Grade Vitamin Premix Revenue (USD Million) by Application (2021-2032)
13.1.3. Middle East and Africa Food Grade Vitamin Premix Revenue (USD Million) by Product (2021-2032)
By Type
10% Effective Substance Content
20% Effective Substance Content
30% Effective Substance Content
By Application
Infant Formulae
Clinical Nutrition
Sport Nutrition
Nutritional Drinks
Dairy
Chapter 14. Food Grade Vitamin Premix Company Profiles
14.1 Business Overview
14.2 Product Profiles
14.3 SWOT Profiles
14.5 Recent Developments
14.6 Financial Profile
List of Companies
DSM Nutritional Products
Glanbia Plc
Hexagon Nutrition Ltd.
SternVitamin GmbH & Co. KG
Vitablend Nederland B.V.
Watson Inc.
15. Methodology and Data Sources
15.1 Customization Offerings
15.2 Subscription Services
15.3 Related Reports
15.4 Publisher Expertise
LIST OF TABLES
Table 1 Market Segmentation Analysis
Table 2 Global Food Grade Vitamin Premix Market Share of Leading Companies, 2023
Table 3 Product Offerings of Leading Companies
Table 4 Low Growth Scenario Forecasts
Table 5 Reference Case Growth Scenario
Table 6 High Growth Case Scenario
Table 7 Global Food Grade Vitamin Premix Revenue (USD Million) And CAGR (%) By Type (2021-2032)
Table 8 Global Food Grade Vitamin Premix Revenue (USD Million) And CAGR (%) By Application (2021-2032)
Table 9 Global Food Grade Vitamin Premix Revenue (USD Million) And CAGR (%) By Product (2021-2032)
Table 10 Global Food Grade Vitamin Premix Market Revenue (USD Million) By Regions (2021-2032)
Table 11 Global Food Grade Vitamin Premix Market Share (%) By Regions (2021-2032)
Table 12 North America Food Grade Vitamin Premix Revenue (USD Million) By Country (2021-2032)
Table 13 Europe Food Grade Vitamin Premix Revenue (USD Million) By Country (2021-2032)
Table 14 Asia Pacific Food Grade Vitamin Premix Revenue (USD Million) By Country (2021-2032)
Table 15 South America Food Grade Vitamin Premix Revenue (USD Million) By Country (2021-2032)
Table 16 Middle East and Africa Food Grade Vitamin Premix Revenue (USD Million) By Region (2021-2032)
Table 17 North America Food Grade Vitamin Premix Revenue (USD Million) By Type (2021-2032)
Table 18 North America Food Grade Vitamin Premix Revenue (USD Million) By Application (2021-2032)
Table 19 North America Food Grade Vitamin Premix Revenue (USD Million) By Product (2021-2032)
Table 20 Europe Food Grade Vitamin Premix Revenue (USD Million) By Type (2021-2032)
Table 21 Europe Food Grade Vitamin Premix Revenue (USD Million) By Application (2021-2032)
Table 22 Europe Food Grade Vitamin Premix Revenue (USD Million) By Product (2021-2032)
Table 23 Asia Pacific Food Grade Vitamin Premix Revenue (USD Million) By Type (2021-2032)
Table 24 Asia Pacific Food Grade Vitamin Premix Revenue (USD Million) By Application (2021-2032)
Table 25 Asia Pacific Food Grade Vitamin Premix Revenue (USD Million) By Product (2021-2032)
Table 26 South America Food Grade Vitamin Premix Revenue (USD Million) By Type (2021-2032)
Table 27 South America Food Grade Vitamin Premix Revenue (USD Million) By Application (2021-2032)
Table 28 South America Food Grade Vitamin Premix Revenue (USD Million) By Product (2021-2032)
Table 29 Middle East and Africa Food Grade Vitamin Premix Revenue (USD Million) By Type (2021-2032)
Table 30 Middle East and Africa Food Grade Vitamin Premix Revenue (USD Million) By Application (2021-2032)
Table 31 Middle East and Africa Food Grade Vitamin Premix Revenue (USD Million) By Product (2021-2032)
LIST OF FIGURES
Figure 1. Market Scope
Figure 2. Pricing Forecasts Per Unit, 2023- 2032
Figure 3. Porter’s Five Forces
Figure 4. Global Food Grade Vitamin Premix Market Revenue (USD Million) By Regions (2021-2032)
Figure 5. Global Food Grade Vitamin Premix Market Share (%) By Regions (2023)
Figure 6. North America Food Grade Vitamin Premix Revenue (USD Million) By Country (2021-2032)
Figure 7. United States Food Grade Vitamin Premix Revenue (USD Million) By Country (2021-2032)
Figure 8. Canada Food Grade Vitamin Premix Revenue (USD Million) By Country (2021-2032)
Figure 9. Mexico Food Grade Vitamin Premix Revenue (USD Million) By Country (2021-2032)
Figure 10. Europe Food Grade Vitamin Premix Revenue (USD Million) By Country (2021-2032)
Figure 11. Germany Food Grade Vitamin Premix Revenue (USD Million) By Country (2021-2032)
Figure 12. France Food Grade Vitamin Premix Revenue (USD Million) By Country (2021-2032)
Figure 13. United Kingdom Food Grade Vitamin Premix Revenue (USD Million) By Country (2021-2032)
Figure 14. Spain Food Grade Vitamin Premix Revenue (USD Million) By Country (2021-2032)
Figure 15. Italy Food Grade Vitamin Premix Revenue (USD Million) By Country (2021-2032)
Figure 16. Russia Food Grade Vitamin Premix Revenue (USD Million) By Country (2021-2032)
Figure 17. Rest of Europe Food Grade Vitamin Premix Revenue (USD Million) By Country (2021-2032)
Figure 11. Asia Pacific Food Grade Vitamin Premix Revenue (USD Million) By Country (2021-2032)
Figure 12. China Food Grade Vitamin Premix Revenue (USD Million) By Country (2021-2032)
Figure 13. Japan Food Grade Vitamin Premix Revenue (USD Million) By Country (2021-2032)
Figure 14. India Food Grade Vitamin Premix Revenue (USD Million) By Country (2021-2032)
Figure 15. South Korea Food Grade Vitamin Premix Revenue (USD Million) By Country (2021-2032)
Figure 16. Australia Food Grade Vitamin Premix Revenue (USD Million) By Country (2021-2032)
Figure 17. South East Asia Food Grade Vitamin Premix Revenue (USD Million) By Country (2021-2032)
Figure 18. South America Food Grade Vitamin Premix Revenue (USD Million) By Country (2021-2032)
Figure 19. Brazil Food Grade Vitamin Premix Revenue (USD Million) By Country (2021-2032)
Figure 20. Argentina Food Grade Vitamin Premix Revenue (USD Million) By Country (2021-2032)
Figure 21. Rest of Asia Pacific Food Grade Vitamin Premix Revenue (USD Million) By Country (2021-2032)
Figure 22. Middle East and Africa Food Grade Vitamin Premix Revenue (USD Million) By Region (2021-2032)
Figure 23. Saudi Arabia Food Grade Vitamin Premix Revenue (USD Million) By Region (2021-2032)
Figure 24. The UAE Food Grade Vitamin Premix Revenue (USD Million) By Region (2021-2032)
Figure 25. Rest of Middle East Food Grade Vitamin Premix Revenue (USD Million) By Region (2021-2032)
Figure 26. South Africa Food Grade Vitamin Premix Revenue (USD Million) By Region (2021-2032)
Figure 27. Africa Food Grade Vitamin Premix Revenue (USD Million) By Region (2021-2032)
Figure 28. North America Food Grade Vitamin Premix Revenue (USD Million) By Type (2021-2032)
Figure 29. North America Food Grade Vitamin Premix Revenue (USD Million) By Application (2021-2032)
Figure 30. North America Food Grade Vitamin Premix Revenue (USD Million) By Product (2021-2032)
Figure 31. Europe Food Grade Vitamin Premix Revenue (USD Million) By Type (2021-2032)
Figure 32. Europe Food Grade Vitamin Premix Revenue (USD Million) By Application (2021-2032)
Figure 33. Europe Food Grade Vitamin Premix Revenue (USD Million) By Product (2021-2032)
Figure 34. Asia Pacific Food Grade Vitamin Premix Revenue (USD Million) By Type (2021-2032)
Figure 35. Asia Pacific Food Grade Vitamin Premix Revenue (USD Million) By Application (2021-2032)
Figure 36. Asia Pacific Food Grade Vitamin Premix Revenue (USD Million) By Product (2021-2032)
Figure 37. South America Food Grade Vitamin Premix Revenue (USD Million) By Type (2021-2032)
Figure 38. South America Food Grade Vitamin Premix Revenue (USD Million) By Application (2021-2032)
Figure 39. South America Food Grade Vitamin Premix Revenue (USD Million) By Product (2021-2032)
Figure 40. Middle East and Africa Food Grade Vitamin Premix Revenue (USD Million) By Type (2021-2032)
Figure 41. Middle East and Africa Food Grade Vitamin Premix Revenue (USD Million) By Application (2021-2032)
Figure 42. Middle East and Africa Food Grade Vitamin Premix Revenue (USD Million) By Product (2021-2032)
By Type
10% Effective Substance Content
20% Effective Substance Content
30% Effective Substance Content
By Application
Infant Formulae
Clinical Nutrition
Sport Nutrition
Nutritional Drinks
Dairy
Countries Analyzed
North America (US, Canada, Mexico)
Europe (Germany, UK, France, Spain, Italy, Russia, Rest of Europe)
Asia Pacific (China, India, Japan, South Korea, Australia, South East Asia, Rest of Asia)
South America (Brazil, Argentina, Rest of South America)
Middle East and Africa (Saudi Arabia, UAE, Rest of Middle East, South Africa, Egypt, Rest of Africa)
