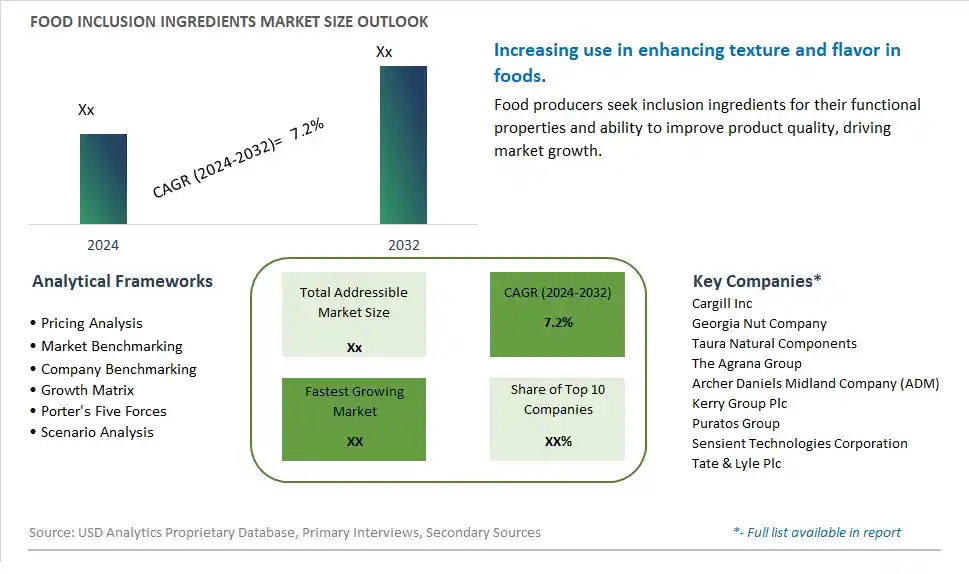
Global Food Inclusion Ingredients Market Size is valued at $XX Million in 2024 and is forecast to register a growth rate (CAGR) of 7.2% to reach $XX Million by 2032.
The global Food Inclusion Ingredients Market Comprehensive Study analyzes and forecasts the market size across 6 regions and 24 countries for diverse segments -By Type (Solid, Liquid), By Application (Cereal Products, Snacks & Bars, Bakery Products, Dairy & Frozen Desserts, Chocolate & Confectionery Products, Others)
An Introduction to Food Inclusion Ingredients Market
The Food Inclusion Ingredients market in 2024 is thriving, fueled by the rising demand for innovative and value-added food products. Food inclusion ingredients, such as fruits, nuts, chocolates, and cereals, are incorporated into various food products to enhance flavor, texture, and nutritional value. The market benefits from advancements in ingredient processing and preservation technologies, the growing trend of convenience and functional foods, and the expansion of the global food industry. Additionally, the increasing focus on clean label and natural ingredients is driving market growth.
Food Inclusion Ingredients Competitive Landscape
The market report analyses the leading companies in the industry including Cargill Inc, Georgia Nut Company, Taura Natural Components, The Agrana Group, Archer Daniels Midland Company (ADM), Kerry Group Plc, Puratos Group, Sensient Technologies Corporation, Tate & Lyle Plc, and Others.
Food Inclusion Ingredients Market Dynamics
Food Inclusion Ingredients Market Trend: Growing Popularity of Value-Added Foods
The most prominent trend in the Food Inclusion Ingredients Market is the growing popularity of value-added foods. Consumers are increasingly seeking food products that offer unique flavors, textures, and nutritional benefits. Inclusion ingredients, such as fruits, nuts, and chocolate chips, add value to basic food items by enhancing their appeal and differentiating them in the market. This trend is driven by the desire for premium and indulgent food experiences.
Food Inclusion Ingredients Market Driver: Increase in Demand for Convenience Foods
The key driver of the Food Inclusion Ingredients Market is the increase in demand for convenience foods. As busy lifestyles and urbanization drive the consumption of ready-to-eat and easy-to-prepare food products, there is a higher need for inclusion ingredients that enhance the taste and nutritional profile of these foods. Inclusion ingredients provide a simple way for manufacturers to innovate and meet consumer demand for convenient yet appealing food options.
Food Inclusion Ingredients Market Opportunity: Expansion into Health and Wellness Products
A significant opportunity in the Food Inclusion Ingredients Market lies in the expansion into health and wellness products. By developing inclusion ingredients that align with health trends, such as superfoods, high-protein additives, and functional inclusions, companies can cater to health-conscious consumers. Offering ingredients that not only enhance flavor and texture but also provide added health benefits can help manufacturers capture a larger share of the growing market for health and wellness foods.
Food Inclusion Ingredients Market Share Analysis: Solid Inclusion Ingredients segment generated the highest revenue share in the industry
In the Food Inclusion Ingredients market, solid inclusion ingredients emerge as the largest segment. Solid inclusion ingredients include chunks, pieces, or granules of various food materials such as fruits, nuts, chocolate, and grains, which are added to enhance the texture, flavor, and visual appeal of food products. These ingredients are widely used across various food applications due to their versatility in adding sensory attributes and nutritional value to a wide range of products. Solid inclusion ingredients are favored by manufacturers for their ability to create differentiated products that appeal to consumer preferences for taste and texture in cereal products, snacks & bars, bakery items, dairy & frozen desserts, and chocolate & confectionery products.
Food Inclusion Ingredients Market Share Analysis: Snacks & Bars Application is the fastest growing segment over the forecast period to 2032
Among the segments in the Food Inclusion Ingredients market, the Snacks & Bars application is projected to experience the fastest growth up to 2032. The increasing consumer demand for convenient and nutritious snack options is driving the growth of this segment. Snacks and bars enriched with inclusion ingredients such as dried fruits, nuts, seeds, and chocolate pieces are gaining popularity as consumers seek indulgent yet healthier snack choices. Manufacturers are innovating to meet this demand by incorporating a variety of solid inclusion ingredients that not only enhance the sensory appeal but also contribute to the nutritional profile of snacks and bars. The trend towards on-the-go consumption habits and the preference for premium snacking experiences are further propelling the expansion of this segment in the Food Inclusion Ingredients market. As a result, snacks & bars are expected to remain a key growth driver for solid inclusion ingredients in the food industry.
Food Inclusion Ingredients Market Segmentation
By Type
Solid
Liquid
By Application
Cereal Products
Snacks & Bars
Bakery Products
Dairy & Frozen Desserts
Chocolate & Confectionery Products
Others
Countries Analyzed
North America (US, Canada, Mexico)
Europe (Germany, UK, France, Spain, Italy, Russia, Rest of Europe)
Asia Pacific (China, India, Japan, South Korea, Australia, South East Asia, Rest of Asia)
South America (Brazil, Argentina, Rest of South America)
Middle East and Africa (Saudi Arabia, UAE, Rest of Middle East, South Africa, Egypt, Rest of Africa)
Food Inclusion Ingredients Companies Profiled in the Study
Cargill Inc
Georgia Nut Company
Taura Natural Components
The Agrana Group
Archer Daniels Midland Company (ADM)
Kerry Group Plc
Puratos Group
Sensient Technologies Corporation
Tate & Lyle Plc
*- List Not Exhaustive
Chapter 1. TABLE OF CONTENTS
Chapter 2. Introduction to Food Inclusion Ingredients Market
2.1. Market Overview
2.2. Key Statistics and Report Highlights
2.3. Scope of the Comprehensive Study
2.3.1. Market Definition
2.3.2 Countries and Regions Covered
2.3.3 Research Objective
2.3.4 Units, Currency, and Conversions
2.3.5 Industry Value Chain
2.4. Key Market Segments
2.5. Key Companies
2.6. Study Period
Chapter 3. Strategic Analysis Review
3.1. Food Inclusion Ingredients Pricing Analysis and Forecast
3.2. Porter’s Five Forces
3.3. Market Ecosystem
3.4. SWOT Analysis
3.5. Regulatory Scenario
3.3. Effects of Inflation, Russia-Ukraine War, moderating economic growth, and other macroeconomic factors
Chapter 4. Competitive Landscape
4.1. Market Share Analysis
4.1.1. Global Food Inclusion Ingredients Market Share by Company, 2023
4.1.2. Product Offerings of Leading Food Inclusion Ingredients Companies
4.2. Market Entropy
4.2.1. New Product Launches in the Industry
4.2.2. Mergers, Acquisitions, Joint ventures, and Partnerships
4.3. Key Strategies and Best Practices
Chapter 5. Global Market Projections: Best, Reference, and Low Case Scenarios
5.1. Growth Analysis- Case Scenario Definitions
5.2. Low Growth Case Scenario Forecasts
5.3. Reference Growth Case Scenario Forecasts
5.4. High Growth Case Scenario Forecasts
Chapter 6. Market Dynamics
6.1. Food Inclusion Ingredients Market Drivers
6.2. Food Inclusion Ingredients Market Challenges
6.6. Food Inclusion Ingredients Market Opportunities
6.4. Food Inclusion Ingredients Market Trends
Chapter 7. Global Food Inclusion Ingredients Market Outlook Trends
7.1. Global Food Inclusion Ingredients Revenue (USD Million) and CAGR (%) by Type (2021-2032)
7.2. Global Food Inclusion Ingredients Revenue (USD Million) and CAGR (%) by Application (2021-2032)
7.3. Global Food Inclusion Ingredients Revenue (USD Million) and CAGR (%) by Product (2021-2032)
By Type
Solid
Liquid
By Application
Cereal Products
Snacks & Bars
Bakery Products
Dairy & Frozen Desserts
Chocolate & Confectionery Products
Others
Chapter 8. Global Food Inclusion Ingredients Regional Analysis and Outlook
8.1. Global Food Inclusion Ingredients Revenue (USD Million) By Regions (2021- 2032)
8.2. North America Food Inclusion Ingredients Revenue (USD Million) by Country (2021-2032)
8.2.1. United States Food Inclusion Ingredients Regional Analysis and Outlook
8.2.2. Canada Food Inclusion Ingredients Regional Analysis and Outlook
8.2.3. Mexico Food Inclusion Ingredients Regional Analysis and Outlook
8.3. Europe Food Inclusion Ingredients Revenue (USD Million), by Country (2021-2032)
8.3.1. Germany Food Inclusion Ingredients Regional Analysis and Outlook
8.3.2. France Food Inclusion Ingredients Regional Analysis and Outlook
8.3.3. United Kingdom Food Inclusion Ingredients Regional Analysis and Outlook
8.3.4. Spain Food Inclusion Ingredients Regional Analysis and Outlook
8.3.5. Italy Food Inclusion Ingredients Regional Analysis and Outlook
8.3.6. Russia Food Inclusion Ingredients Regional Analysis and Outlook
8.3.7. Rest of Europe Food Inclusion Ingredients Regional Analysis and Outlook
8.4. Asia Pacific Food Inclusion Ingredients Revenue (USD Million) by Country (2021-2032)
8.4.1. China Food Inclusion Ingredients Regional Analysis and Outlook
8.4.2. Japan Food Inclusion Ingredients Regional Analysis and Outlook
8.4.3. India Food Inclusion Ingredients Regional Analysis and Outlook
8.4.4. South Korea Food Inclusion Ingredients Regional Analysis and Outlook
8.4.5. Australia Food Inclusion Ingredients Regional Analysis and Outlook
8.4.6. South East Asia Food Inclusion Ingredients Regional Analysis and Outlook
8.4.7. Rest of Asia Pacific Food Inclusion Ingredients Regional Analysis and Outlook
8.5. South America Food Inclusion Ingredients Revenue (USD Million), by Country (2021-2032)
8.5.1. Brazil Food Inclusion Ingredients Regional Analysis and Outlook
8.5.2. Argentina Food Inclusion Ingredients Regional Analysis and Outlook
8.5.3. Rest of South America Food Inclusion Ingredients Regional Analysis and Outlook
8.6. Middle East and Africa Food Inclusion Ingredients Revenue (USD Million) by Country (2021-2032)
8.6.1. Middle East Food Inclusion Ingredients Regional Analysis and Outlook
8.6.2. Africa Food Inclusion Ingredients Regional Analysis and Outlook
Chapter 9. North America Food Inclusion Ingredients Analysis and Outlook
9.1. North America Food Inclusion Ingredients Revenue (USD Million) by Segments (2021-2032)
9.1.1. North America Food Inclusion Ingredients Revenue (USD Million) by Type (2021-2032)
9.1.2. North America Food Inclusion Ingredients Revenue (USD Million) by Application (2021-2032)
9.1.3. North America Food Inclusion Ingredients Revenue (USD Million) by Product (2021-2032)
By Type
Solid
Liquid
By Application
Cereal Products
Snacks & Bars
Bakery Products
Dairy & Frozen Desserts
Chocolate & Confectionery Products
Others
Chapter 10. Europe Food Inclusion Ingredients Analysis and Outlook
10.1. Europe Food Inclusion Ingredients Revenue (USD Million), by Segments (USD Million) (2021-2032)
10.1.1. Europe Food Inclusion Ingredients Revenue (USD Million) by Type (2021-2032)
10.1.2. Europe Food Inclusion Ingredients Revenue (USD Million) by Application (2021-2032)
10.1.3. Europe Food Inclusion Ingredients Revenue (USD Million) by Product (2021-2032)
By Type
Solid
Liquid
By Application
Cereal Products
Snacks & Bars
Bakery Products
Dairy & Frozen Desserts
Chocolate & Confectionery Products
Others
Chapter 11. Asia Pacific Food Inclusion Ingredients Analysis and Outlook
11.1. Asia Pacific Food Inclusion Ingredients Revenue (USD Million), and Revenue (USD Million) by Segments (2021-2032)
11.1.1. Asia Pacific Food Inclusion Ingredients Revenue (USD Million) by Type (2021-2032)
11.1.2. Asia Pacific Food Inclusion Ingredients Revenue (USD Million) by Application (2021-2032)
11.1.3. Asia Pacific Food Inclusion Ingredients Revenue (USD Million) by Product (2021-2032)
By Type
Solid
Liquid
By Application
Cereal Products
Snacks & Bars
Bakery Products
Dairy & Frozen Desserts
Chocolate & Confectionery Products
Others
Chapter 12. South America Food Inclusion Ingredients Analysis and Outlook
12.1. South America Food Inclusion Ingredients Revenue (USD Million), by Segments (2021-2032)
12.1.1. South America Food Inclusion Ingredients Revenue (USD Million) by Type (2021-2032)
12.1.2. South America Food Inclusion Ingredients Revenue (USD Million) by Application (2021-2032)
12.1.3. South America Food Inclusion Ingredients Revenue (USD Million) by Product (2021-2032)
By Type
Solid
Liquid
By Application
Cereal Products
Snacks & Bars
Bakery Products
Dairy & Frozen Desserts
Chocolate & Confectionery Products
Others
Chapter 13. Middle East and Africa Food Inclusion Ingredients Analysis and Outlook
13.1. Middle East and Africa Food Inclusion Ingredients Revenue (USD Million), by Segments (2021-2032)
13.1.1. Middle East and Africa Food Inclusion Ingredients Revenue (USD Million) by Type (2021-2032)
13.1.2. Middle East and Africa Food Inclusion Ingredients Revenue (USD Million) by Application (2021-2032)
13.1.3. Middle East and Africa Food Inclusion Ingredients Revenue (USD Million) by Product (2021-2032)
By Type
Solid
Liquid
By Application
Cereal Products
Snacks & Bars
Bakery Products
Dairy & Frozen Desserts
Chocolate & Confectionery Products
Others
Chapter 14. Food Inclusion Ingredients Company Profiles
14.1 Business Overview
14.2 Product Profiles
14.3 SWOT Profiles
14.5 Recent Developments
14.6 Financial Profile
List of Companies
Cargill Inc
Georgia Nut Company
Taura Natural Components
The Agrana Group
Archer Daniels Midland Company (ADM)
Kerry Group Plc
Puratos Group
Sensient Technologies Corporation
Tate & Lyle Plc
15. Methodology and Data Sources
15.1 Customization Offerings
15.2 Subscription Services
15.3 Related Reports
15.4 Publisher Expertise
LIST OF TABLES
Table 1 Market Segmentation Analysis
Table 2 Global Food Inclusion Ingredients Market Share of Leading Companies, 2023
Table 3 Product Offerings of Leading Companies
Table 4 Low Growth Scenario Forecasts
Table 5 Reference Case Growth Scenario
Table 6 High Growth Case Scenario
Table 7 Global Food Inclusion Ingredients Revenue (USD Million) And CAGR (%) By Type (2021-2032)
Table 8 Global Food Inclusion Ingredients Revenue (USD Million) And CAGR (%) By Application (2021-2032)
Table 9 Global Food Inclusion Ingredients Revenue (USD Million) And CAGR (%) By Product (2021-2032)
Table 10 Global Food Inclusion Ingredients Market Revenue (USD Million) By Regions (2021-2032)
Table 11 Global Food Inclusion Ingredients Market Share (%) By Regions (2021-2032)
Table 12 North America Food Inclusion Ingredients Revenue (USD Million) By Country (2021-2032)
Table 13 Europe Food Inclusion Ingredients Revenue (USD Million) By Country (2021-2032)
Table 14 Asia Pacific Food Inclusion Ingredients Revenue (USD Million) By Country (2021-2032)
Table 15 South America Food Inclusion Ingredients Revenue (USD Million) By Country (2021-2032)
Table 16 Middle East and Africa Food Inclusion Ingredients Revenue (USD Million) By Region (2021-2032)
Table 17 North America Food Inclusion Ingredients Revenue (USD Million) By Type (2021-2032)
Table 18 North America Food Inclusion Ingredients Revenue (USD Million) By Application (2021-2032)
Table 19 North America Food Inclusion Ingredients Revenue (USD Million) By Product (2021-2032)
Table 20 Europe Food Inclusion Ingredients Revenue (USD Million) By Type (2021-2032)
Table 21 Europe Food Inclusion Ingredients Revenue (USD Million) By Application (2021-2032)
Table 22 Europe Food Inclusion Ingredients Revenue (USD Million) By Product (2021-2032)
Table 23 Asia Pacific Food Inclusion Ingredients Revenue (USD Million) By Type (2021-2032)
Table 24 Asia Pacific Food Inclusion Ingredients Revenue (USD Million) By Application (2021-2032)
Table 25 Asia Pacific Food Inclusion Ingredients Revenue (USD Million) By Product (2021-2032)
Table 26 South America Food Inclusion Ingredients Revenue (USD Million) By Type (2021-2032)
Table 27 South America Food Inclusion Ingredients Revenue (USD Million) By Application (2021-2032)
Table 28 South America Food Inclusion Ingredients Revenue (USD Million) By Product (2021-2032)
Table 29 Middle East and Africa Food Inclusion Ingredients Revenue (USD Million) By Type (2021-2032)
Table 30 Middle East and Africa Food Inclusion Ingredients Revenue (USD Million) By Application (2021-2032)
Table 31 Middle East and Africa Food Inclusion Ingredients Revenue (USD Million) By Product (2021-2032)
LIST OF FIGURES
Figure 1. Market Scope
Figure 2. Pricing Forecasts Per Unit, 2023- 2032
Figure 3. Porter’s Five Forces
Figure 4. Global Food Inclusion Ingredients Market Revenue (USD Million) By Regions (2021-2032)
Figure 5. Global Food Inclusion Ingredients Market Share (%) By Regions (2023)
Figure 6. North America Food Inclusion Ingredients Revenue (USD Million) By Country (2021-2032)
Figure 7. United States Food Inclusion Ingredients Revenue (USD Million) By Country (2021-2032)
Figure 8. Canada Food Inclusion Ingredients Revenue (USD Million) By Country (2021-2032)
Figure 9. Mexico Food Inclusion Ingredients Revenue (USD Million) By Country (2021-2032)
Figure 10. Europe Food Inclusion Ingredients Revenue (USD Million) By Country (2021-2032)
Figure 11. Germany Food Inclusion Ingredients Revenue (USD Million) By Country (2021-2032)
Figure 12. France Food Inclusion Ingredients Revenue (USD Million) By Country (2021-2032)
Figure 13. United Kingdom Food Inclusion Ingredients Revenue (USD Million) By Country (2021-2032)
Figure 14. Spain Food Inclusion Ingredients Revenue (USD Million) By Country (2021-2032)
Figure 15. Italy Food Inclusion Ingredients Revenue (USD Million) By Country (2021-2032)
Figure 16. Russia Food Inclusion Ingredients Revenue (USD Million) By Country (2021-2032)
Figure 17. Rest of Europe Food Inclusion Ingredients Revenue (USD Million) By Country (2021-2032)
Figure 11. Asia Pacific Food Inclusion Ingredients Revenue (USD Million) By Country (2021-2032)
Figure 12. China Food Inclusion Ingredients Revenue (USD Million) By Country (2021-2032)
Figure 13. Japan Food Inclusion Ingredients Revenue (USD Million) By Country (2021-2032)
Figure 14. India Food Inclusion Ingredients Revenue (USD Million) By Country (2021-2032)
Figure 15. South Korea Food Inclusion Ingredients Revenue (USD Million) By Country (2021-2032)
Figure 16. Australia Food Inclusion Ingredients Revenue (USD Million) By Country (2021-2032)
Figure 17. South East Asia Food Inclusion Ingredients Revenue (USD Million) By Country (2021-2032)
Figure 18. South America Food Inclusion Ingredients Revenue (USD Million) By Country (2021-2032)
Figure 19. Brazil Food Inclusion Ingredients Revenue (USD Million) By Country (2021-2032)
Figure 20. Argentina Food Inclusion Ingredients Revenue (USD Million) By Country (2021-2032)
Figure 21. Rest of Asia Pacific Food Inclusion Ingredients Revenue (USD Million) By Country (2021-2032)
Figure 22. Middle East and Africa Food Inclusion Ingredients Revenue (USD Million) By Region (2021-2032)
Figure 23. Saudi Arabia Food Inclusion Ingredients Revenue (USD Million) By Region (2021-2032)
Figure 24. The UAE Food Inclusion Ingredients Revenue (USD Million) By Region (2021-2032)
Figure 25. Rest of Middle East Food Inclusion Ingredients Revenue (USD Million) By Region (2021-2032)
Figure 26. South Africa Food Inclusion Ingredients Revenue (USD Million) By Region (2021-2032)
Figure 27. Africa Food Inclusion Ingredients Revenue (USD Million) By Region (2021-2032)
Figure 28. North America Food Inclusion Ingredients Revenue (USD Million) By Type (2021-2032)
Figure 29. North America Food Inclusion Ingredients Revenue (USD Million) By Application (2021-2032)
Figure 30. North America Food Inclusion Ingredients Revenue (USD Million) By Product (2021-2032)
Figure 31. Europe Food Inclusion Ingredients Revenue (USD Million) By Type (2021-2032)
Figure 32. Europe Food Inclusion Ingredients Revenue (USD Million) By Application (2021-2032)
Figure 33. Europe Food Inclusion Ingredients Revenue (USD Million) By Product (2021-2032)
Figure 34. Asia Pacific Food Inclusion Ingredients Revenue (USD Million) By Type (2021-2032)
Figure 35. Asia Pacific Food Inclusion Ingredients Revenue (USD Million) By Application (2021-2032)
Figure 36. Asia Pacific Food Inclusion Ingredients Revenue (USD Million) By Product (2021-2032)
Figure 37. South America Food Inclusion Ingredients Revenue (USD Million) By Type (2021-2032)
Figure 38. South America Food Inclusion Ingredients Revenue (USD Million) By Application (2021-2032)
Figure 39. South America Food Inclusion Ingredients Revenue (USD Million) By Product (2021-2032)
Figure 40. Middle East and Africa Food Inclusion Ingredients Revenue (USD Million) By Type (2021-2032)
Figure 41. Middle East and Africa Food Inclusion Ingredients Revenue (USD Million) By Application (2021-2032)
Figure 42. Middle East and Africa Food Inclusion Ingredients Revenue (USD Million) By Product (2021-2032)
By Type
Solid
Liquid
By Application
Cereal Products
Snacks & Bars
Bakery Products
Dairy & Frozen Desserts
Chocolate & Confectionery Products
Others
Countries Analyzed
North America (US, Canada, Mexico)
Europe (Germany, UK, France, Spain, Italy, Russia, Rest of Europe)
Asia Pacific (China, India, Japan, South Korea, Australia, South East Asia, Rest of Asia)
South America (Brazil, Argentina, Rest of South America)
Middle East and Africa (Saudi Arabia, UAE, Rest of Middle East, South Africa, Egypt, Rest of Africa)
