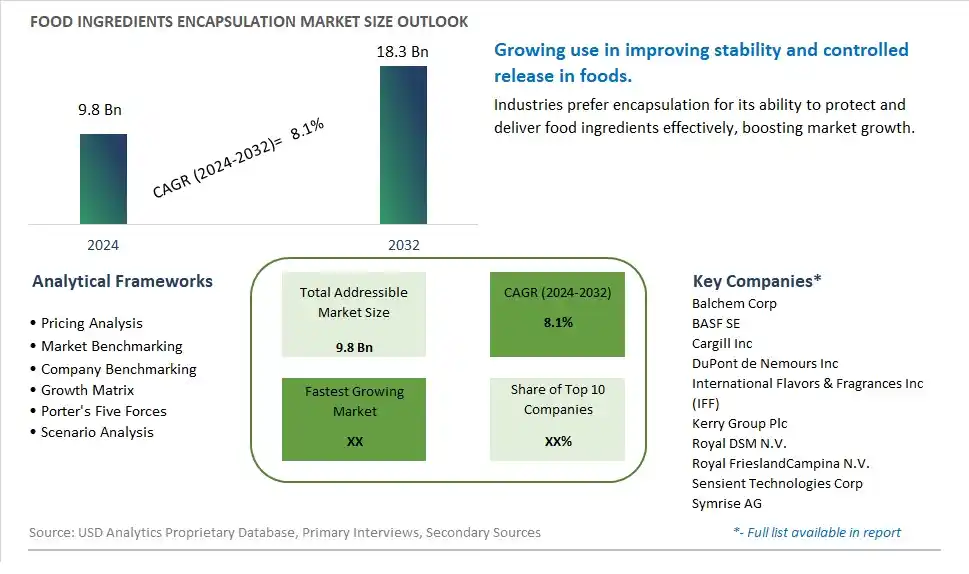
Global Food Ingredients Encapsulation Market Size is valued at $9.8 Billion in 2024 and is forecast to register a growth rate (CAGR) of 8.1% to reach $18.3 Billion by 2032.
The global Food Ingredients Encapsulation Market Comprehensive Study analyzes and forecasts the market size across 6 regions and 24 countries for diverse segments -By Type (Microencapsulation, Nanoencapsulation, Hybrid Encapsulation), By Application (Food, Beverages, Others)
An Introduction to Food Ingredients Encapsulation Market
In 2024, the Food Ingredients Encapsulation market is experiencing robust growth, driven by the increasing demand for enhanced stability, shelf life, and controlled release of food ingredients. Encapsulation technology is widely used to protect flavors, vitamins, probiotics, and enzymes, ensuring their efficacy in various food products. The market benefits from advancements in encapsulation techniques, the growing trend of functional and fortified foods, and the expansion of the convenience food sector. Additionally, the increasing focus on clean label and natural ingredients is contributing to market growth.
Food Ingredients Encapsulation Competitive Landscape
The market report analyses the leading companies in the industry including Balchem Corp, BASF SE, Cargill Inc, DuPont de Nemours Inc, International Flavors & Fragrances Inc (IFF), Kerry Group Plc, Royal DSM N.V., Royal FrieslandCampina N.V., Sensient Technologies Corp, Symrise AG, and Others.
Food Ingredients Encapsulation Market Dynamics
Food Ingredients Encapsulation Market Trend: Demand for Enhanced Ingredient Stability and Functional Performance
The market for food ingredients encapsulation is witnessing a prominent trend towards the demand for enhanced ingredient stability and functional performance. Food manufacturers are increasingly turning to encapsulation technologies to protect sensitive ingredients, such as vitamins, flavors, and bioactive compounds, from degradation during processing, storage, and consumption. This trend is driven by the need for improved product quality, extended shelf life, controlled release, and targeted delivery of functional ingredients in a variety of food and beverage applications.
Food Ingredients Encapsulation Market Driver: Technological Advancements in Encapsulation Techniques
A major driver for the food ingredients encapsulation market is the continuous advancements in encapsulation techniques and materials. Innovations in microencapsulation, nanoencapsulation, spray drying, and coacervation enable the encapsulation of a wide range of ingredients with varying properties and functionalities. The drive for precision, efficiency, and versatility in encapsulation processes supports the development of encapsulated ingredients that offer improved solubility, stability, bioavailability, and sensory characteristics. This driver is reinforced by the demand for clean label solutions, natural ingredients, and value-added functionalities in food products.
Food Ingredients Encapsulation Market Opportunity: Customized Encapsulation Solutions for Specific Applications
The market for food ingredients encapsulation presents a significant opportunity for customized encapsulation solutions tailored to specific applications and formulation challenges. Companies specializing in encapsulation technologies can collaborate with food manufacturers to develop bespoke encapsulated ingredients optimized for functionality, performance, and compatibility with diverse food matrices. This opportunity includes creating encapsulated ingredients with targeted release profiles, extended shelf life, improved texture, reduced off-flavors, and enhanced nutritional content. Collaborating with research institutions, universities, and industry experts can support the development of innovative encapsulation solutions that address market demands, regulatory requirements, and consumer preferences effectively.
Food Ingredients Encapsulation Market Share Analysis: Microencapsulation segment generated the highest revenue share in the industry
The largest segment in the Food Ingredients Encapsulation Market is Microencapsulation. This segment dominates the market due to several key factors. Microencapsulation involves enclosing active food ingredients, such as vitamins, minerals, flavors, and enzymes, within a microscopic capsule, providing protection from environmental factors like heat, light, and moisture. This technology extends the shelf life of food products, enhances their stability and bioavailability, and facilitates controlled release, thereby improving overall product quality. Microencapsulation finds extensive applications across various food and beverage categories, including dairy products, bakery items, confectionery, beverages, and functional foods. Its versatility and ability to address challenges related to ingredient degradation, flavor masking, and targeted delivery make it a preferred choice for food manufacturers aiming to create innovative and value-added products. Further, the growing consumer demand for functional foods and fortified products, along with the rising emphasis on natural ingredients and clean-label solutions, further propels the adoption of microencapsulation in the food industry. As food manufacturers continue to invest in research and development to enhance product quality and consumer appeal, the Microencapsulation segment is expected to maintain its dominance and witness continued growth in the coming years.
Food Ingredients Encapsulation Market Share Analysis: Beverages is the fastest growing segment over the forecast period to 2032
The fastest-growing segment in the Food Ingredients Encapsulation Market is Beverages. This segment is experiencing rapid growth due to several key factors driving market dynamics. Encapsulation technology plays a crucial role in the beverage industry by enhancing the stability, shelf life, and sensory properties of various beverage products. Microencapsulation, nanoencapsulation, and hybrid encapsulation techniques are widely employed to encapsulate flavors, vitamins, minerals, antioxidants, and other active ingredients in beverages, ensuring their protection during processing, storage, and consumption. Beverages, including functional drinks, fruit juices, energy drinks, and ready-to-drink products, are witnessing increased demand from health-conscious consumers seeking nutritious, convenient, and flavorful options. Encapsulation enables the incorporation of sensitive or reactive ingredients into beverages without compromising their quality or efficacy, thereby fueling innovation and product differentiation in the market. Additionally, the growing trend towards fortified and functional beverages, coupled with rising consumer preferences for natural ingredients and enhanced sensory experiences, further drives the adoption of encapsulation technology in the beverage sector. As beverage manufacturers continue to focus on product innovation and addressing consumer demands for healthier and more functional drink options, the Beverages segment within the Food Ingredients Encapsulation Market is poised for significant growth and expansion by 2032.
Food Ingredients Encapsulation Market Segmentation
By Type
Microencapsulation
Nanoencapsulation
Hybrid Encapsulation
By Application
Food
Beverages
Others
Countries Analyzed
North America (US, Canada, Mexico)
Europe (Germany, UK, France, Spain, Italy, Russia, Rest of Europe)
Asia Pacific (China, India, Japan, South Korea, Australia, South East Asia, Rest of Asia)
South America (Brazil, Argentina, Rest of South America)
Middle East and Africa (Saudi Arabia, UAE, Rest of Middle East, South Africa, Egypt, Rest of Africa)
Food Ingredients Encapsulation Companies Profiled in the Study
Balchem Corp
BASF SE
Cargill Inc
DuPont de Nemours Inc
International Flavors & Fragrances Inc (IFF)
Kerry Group Plc
Royal DSM N.V.
Royal FrieslandCampina N.V.
Sensient Technologies Corp
Symrise AG
*- List Not Exhaustive
Chapter 1. TABLE OF CONTENTS
Chapter 2. Introduction to Food Ingredients Encapsulation Market
2.1. Market Overview
2.2. Key Statistics and Report Highlights
2.3. Scope of the Comprehensive Study
2.3.1. Market Definition
2.3.2 Countries and Regions Covered
2.3.3 Research Objective
2.3.4 Units, Currency, and Conversions
2.3.5 Industry Value Chain
2.4. Key Market Segments
2.5. Key Companies
2.6. Study Period
Chapter 3. Strategic Analysis Review
3.1. Food Ingredients Encapsulation Pricing Analysis and Forecast
3.2. Porter’s Five Forces
3.3. Market Ecosystem
3.4. SWOT Analysis
3.5. Regulatory Scenario
3.3. Effects of Inflation, Russia-Ukraine War, moderating economic growth, and other macroeconomic factors
Chapter 4. Competitive Landscape
4.1. Market Share Analysis
4.1.1. Global Food Ingredients Encapsulation Market Share by Company, 2023
4.1.2. Product Offerings of Leading Food Ingredients Encapsulation Companies
4.2. Market Entropy
4.2.1. New Product Launches in the Industry
4.2.2. Mergers, Acquisitions, Joint ventures, and Partnerships
4.3. Key Strategies and Best Practices
Chapter 5. Global Market Projections: Best, Reference, and Low Case Scenarios
5.1. Growth Analysis- Case Scenario Definitions
5.2. Low Growth Case Scenario Forecasts
5.3. Reference Growth Case Scenario Forecasts
5.4. High Growth Case Scenario Forecasts
Chapter 6. Market Dynamics
6.1. Food Ingredients Encapsulation Market Drivers
6.2. Food Ingredients Encapsulation Market Challenges
6.6. Food Ingredients Encapsulation Market Opportunities
6.4. Food Ingredients Encapsulation Market Trends
Chapter 7. Global Food Ingredients Encapsulation Market Outlook Trends
7.1. Global Food Ingredients Encapsulation Revenue (USD Million) and CAGR (%) by Type (2021-2032)
7.2. Global Food Ingredients Encapsulation Revenue (USD Million) and CAGR (%) by Application (2021-2032)
7.3. Global Food Ingredients Encapsulation Revenue (USD Million) and CAGR (%) by Product (2021-2032)
By Type
Microencapsulation
Nanoencapsulation
Hybrid Encapsulation
By Application
Food
Beverages
Others
Chapter 8. Global Food Ingredients Encapsulation Regional Analysis and Outlook
8.1. Global Food Ingredients Encapsulation Revenue (USD Million) By Regions (2021- 2032)
8.2. North America Food Ingredients Encapsulation Revenue (USD Million) by Country (2021-2032)
8.2.1. United States Food Ingredients Encapsulation Regional Analysis and Outlook
8.2.2. Canada Food Ingredients Encapsulation Regional Analysis and Outlook
8.2.3. Mexico Food Ingredients Encapsulation Regional Analysis and Outlook
8.3. Europe Food Ingredients Encapsulation Revenue (USD Million), by Country (2021-2032)
8.3.1. Germany Food Ingredients Encapsulation Regional Analysis and Outlook
8.3.2. France Food Ingredients Encapsulation Regional Analysis and Outlook
8.3.3. United Kingdom Food Ingredients Encapsulation Regional Analysis and Outlook
8.3.4. Spain Food Ingredients Encapsulation Regional Analysis and Outlook
8.3.5. Italy Food Ingredients Encapsulation Regional Analysis and Outlook
8.3.6. Russia Food Ingredients Encapsulation Regional Analysis and Outlook
8.3.7. Rest of Europe Food Ingredients Encapsulation Regional Analysis and Outlook
8.4. Asia Pacific Food Ingredients Encapsulation Revenue (USD Million) by Country (2021-2032)
8.4.1. China Food Ingredients Encapsulation Regional Analysis and Outlook
8.4.2. Japan Food Ingredients Encapsulation Regional Analysis and Outlook
8.4.3. India Food Ingredients Encapsulation Regional Analysis and Outlook
8.4.4. South Korea Food Ingredients Encapsulation Regional Analysis and Outlook
8.4.5. Australia Food Ingredients Encapsulation Regional Analysis and Outlook
8.4.6. South East Asia Food Ingredients Encapsulation Regional Analysis and Outlook
8.4.7. Rest of Asia Pacific Food Ingredients Encapsulation Regional Analysis and Outlook
8.5. South America Food Ingredients Encapsulation Revenue (USD Million), by Country (2021-2032)
8.5.1. Brazil Food Ingredients Encapsulation Regional Analysis and Outlook
8.5.2. Argentina Food Ingredients Encapsulation Regional Analysis and Outlook
8.5.3. Rest of South America Food Ingredients Encapsulation Regional Analysis and Outlook
8.6. Middle East and Africa Food Ingredients Encapsulation Revenue (USD Million) by Country (2021-2032)
8.6.1. Middle East Food Ingredients Encapsulation Regional Analysis and Outlook
8.6.2. Africa Food Ingredients Encapsulation Regional Analysis and Outlook
Chapter 9. North America Food Ingredients Encapsulation Analysis and Outlook
9.1. North America Food Ingredients Encapsulation Revenue (USD Million) by Segments (2021-2032)
9.1.1. North America Food Ingredients Encapsulation Revenue (USD Million) by Type (2021-2032)
9.1.2. North America Food Ingredients Encapsulation Revenue (USD Million) by Application (2021-2032)
9.1.3. North America Food Ingredients Encapsulation Revenue (USD Million) by Product (2021-2032)
By Type
Microencapsulation
Nanoencapsulation
Hybrid Encapsulation
By Application
Food
Beverages
Others
Chapter 10. Europe Food Ingredients Encapsulation Analysis and Outlook
10.1. Europe Food Ingredients Encapsulation Revenue (USD Million), by Segments (USD Million) (2021-2032)
10.1.1. Europe Food Ingredients Encapsulation Revenue (USD Million) by Type (2021-2032)
10.1.2. Europe Food Ingredients Encapsulation Revenue (USD Million) by Application (2021-2032)
10.1.3. Europe Food Ingredients Encapsulation Revenue (USD Million) by Product (2021-2032)
By Type
Microencapsulation
Nanoencapsulation
Hybrid Encapsulation
By Application
Food
Beverages
Others
Chapter 11. Asia Pacific Food Ingredients Encapsulation Analysis and Outlook
11.1. Asia Pacific Food Ingredients Encapsulation Revenue (USD Million), and Revenue (USD Million) by Segments (2021-2032)
11.1.1. Asia Pacific Food Ingredients Encapsulation Revenue (USD Million) by Type (2021-2032)
11.1.2. Asia Pacific Food Ingredients Encapsulation Revenue (USD Million) by Application (2021-2032)
11.1.3. Asia Pacific Food Ingredients Encapsulation Revenue (USD Million) by Product (2021-2032)
By Type
Microencapsulation
Nanoencapsulation
Hybrid Encapsulation
By Application
Food
Beverages
Others
Chapter 12. South America Food Ingredients Encapsulation Analysis and Outlook
12.1. South America Food Ingredients Encapsulation Revenue (USD Million), by Segments (2021-2032)
12.1.1. South America Food Ingredients Encapsulation Revenue (USD Million) by Type (2021-2032)
12.1.2. South America Food Ingredients Encapsulation Revenue (USD Million) by Application (2021-2032)
12.1.3. South America Food Ingredients Encapsulation Revenue (USD Million) by Product (2021-2032)
By Type
Microencapsulation
Nanoencapsulation
Hybrid Encapsulation
By Application
Food
Beverages
Others
Chapter 13. Middle East and Africa Food Ingredients Encapsulation Analysis and Outlook
13.1. Middle East and Africa Food Ingredients Encapsulation Revenue (USD Million), by Segments (2021-2032)
13.1.1. Middle East and Africa Food Ingredients Encapsulation Revenue (USD Million) by Type (2021-2032)
13.1.2. Middle East and Africa Food Ingredients Encapsulation Revenue (USD Million) by Application (2021-2032)
13.1.3. Middle East and Africa Food Ingredients Encapsulation Revenue (USD Million) by Product (2021-2032)
By Type
Microencapsulation
Nanoencapsulation
Hybrid Encapsulation
By Application
Food
Beverages
Others
Chapter 14. Food Ingredients Encapsulation Company Profiles
14.1 Business Overview
14.2 Product Profiles
14.3 SWOT Profiles
14.5 Recent Developments
14.6 Financial Profile
List of Companies
Balchem Corp
BASF SE
Cargill Inc
DuPont de Nemours Inc
International Flavors & Fragrances Inc (IFF)
Kerry Group Plc
Royal DSM N.V.
Royal FrieslandCampina N.V.
Sensient Technologies Corp
Symrise AG
15. Methodology and Data Sources
15.1 Customization Offerings
15.2 Subscription Services
15.3 Related Reports
15.4 Publisher Expertise
LIST OF TABLES
Table 1 Market Segmentation Analysis
Table 2 Global Food Ingredients Encapsulation Market Share of Leading Companies, 2023
Table 3 Product Offerings of Leading Companies
Table 4 Low Growth Scenario Forecasts
Table 5 Reference Case Growth Scenario
Table 6 High Growth Case Scenario
Table 7 Global Food Ingredients Encapsulation Revenue (USD Million) And CAGR (%) By Type (2021-2032)
Table 8 Global Food Ingredients Encapsulation Revenue (USD Million) And CAGR (%) By Application (2021-2032)
Table 9 Global Food Ingredients Encapsulation Revenue (USD Million) And CAGR (%) By Product (2021-2032)
Table 10 Global Food Ingredients Encapsulation Market Revenue (USD Million) By Regions (2021-2032)
Table 11 Global Food Ingredients Encapsulation Market Share (%) By Regions (2021-2032)
Table 12 North America Food Ingredients Encapsulation Revenue (USD Million) By Country (2021-2032)
Table 13 Europe Food Ingredients Encapsulation Revenue (USD Million) By Country (2021-2032)
Table 14 Asia Pacific Food Ingredients Encapsulation Revenue (USD Million) By Country (2021-2032)
Table 15 South America Food Ingredients Encapsulation Revenue (USD Million) By Country (2021-2032)
Table 16 Middle East and Africa Food Ingredients Encapsulation Revenue (USD Million) By Region (2021-2032)
Table 17 North America Food Ingredients Encapsulation Revenue (USD Million) By Type (2021-2032)
Table 18 North America Food Ingredients Encapsulation Revenue (USD Million) By Application (2021-2032)
Table 19 North America Food Ingredients Encapsulation Revenue (USD Million) By Product (2021-2032)
Table 20 Europe Food Ingredients Encapsulation Revenue (USD Million) By Type (2021-2032)
Table 21 Europe Food Ingredients Encapsulation Revenue (USD Million) By Application (2021-2032)
Table 22 Europe Food Ingredients Encapsulation Revenue (USD Million) By Product (2021-2032)
Table 23 Asia Pacific Food Ingredients Encapsulation Revenue (USD Million) By Type (2021-2032)
Table 24 Asia Pacific Food Ingredients Encapsulation Revenue (USD Million) By Application (2021-2032)
Table 25 Asia Pacific Food Ingredients Encapsulation Revenue (USD Million) By Product (2021-2032)
Table 26 South America Food Ingredients Encapsulation Revenue (USD Million) By Type (2021-2032)
Table 27 South America Food Ingredients Encapsulation Revenue (USD Million) By Application (2021-2032)
Table 28 South America Food Ingredients Encapsulation Revenue (USD Million) By Product (2021-2032)
Table 29 Middle East and Africa Food Ingredients Encapsulation Revenue (USD Million) By Type (2021-2032)
Table 30 Middle East and Africa Food Ingredients Encapsulation Revenue (USD Million) By Application (2021-2032)
Table 31 Middle East and Africa Food Ingredients Encapsulation Revenue (USD Million) By Product (2021-2032)
LIST OF FIGURES
Figure 1. Market Scope
Figure 2. Pricing Forecasts Per Unit, 2023- 2032
Figure 3. Porter’s Five Forces
Figure 4. Global Food Ingredients Encapsulation Market Revenue (USD Million) By Regions (2021-2032)
Figure 5. Global Food Ingredients Encapsulation Market Share (%) By Regions (2023)
Figure 6. North America Food Ingredients Encapsulation Revenue (USD Million) By Country (2021-2032)
Figure 7. United States Food Ingredients Encapsulation Revenue (USD Million) By Country (2021-2032)
Figure 8. Canada Food Ingredients Encapsulation Revenue (USD Million) By Country (2021-2032)
Figure 9. Mexico Food Ingredients Encapsulation Revenue (USD Million) By Country (2021-2032)
Figure 10. Europe Food Ingredients Encapsulation Revenue (USD Million) By Country (2021-2032)
Figure 11. Germany Food Ingredients Encapsulation Revenue (USD Million) By Country (2021-2032)
Figure 12. France Food Ingredients Encapsulation Revenue (USD Million) By Country (2021-2032)
Figure 13. United Kingdom Food Ingredients Encapsulation Revenue (USD Million) By Country (2021-2032)
Figure 14. Spain Food Ingredients Encapsulation Revenue (USD Million) By Country (2021-2032)
Figure 15. Italy Food Ingredients Encapsulation Revenue (USD Million) By Country (2021-2032)
Figure 16. Russia Food Ingredients Encapsulation Revenue (USD Million) By Country (2021-2032)
Figure 17. Rest of Europe Food Ingredients Encapsulation Revenue (USD Million) By Country (2021-2032)
Figure 11. Asia Pacific Food Ingredients Encapsulation Revenue (USD Million) By Country (2021-2032)
Figure 12. China Food Ingredients Encapsulation Revenue (USD Million) By Country (2021-2032)
Figure 13. Japan Food Ingredients Encapsulation Revenue (USD Million) By Country (2021-2032)
Figure 14. India Food Ingredients Encapsulation Revenue (USD Million) By Country (2021-2032)
Figure 15. South Korea Food Ingredients Encapsulation Revenue (USD Million) By Country (2021-2032)
Figure 16. Australia Food Ingredients Encapsulation Revenue (USD Million) By Country (2021-2032)
Figure 17. South East Asia Food Ingredients Encapsulation Revenue (USD Million) By Country (2021-2032)
Figure 18. South America Food Ingredients Encapsulation Revenue (USD Million) By Country (2021-2032)
Figure 19. Brazil Food Ingredients Encapsulation Revenue (USD Million) By Country (2021-2032)
Figure 20. Argentina Food Ingredients Encapsulation Revenue (USD Million) By Country (2021-2032)
Figure 21. Rest of Asia Pacific Food Ingredients Encapsulation Revenue (USD Million) By Country (2021-2032)
Figure 22. Middle East and Africa Food Ingredients Encapsulation Revenue (USD Million) By Region (2021-2032)
Figure 23. Saudi Arabia Food Ingredients Encapsulation Revenue (USD Million) By Region (2021-2032)
Figure 24. The UAE Food Ingredients Encapsulation Revenue (USD Million) By Region (2021-2032)
Figure 25. Rest of Middle East Food Ingredients Encapsulation Revenue (USD Million) By Region (2021-2032)
Figure 26. South Africa Food Ingredients Encapsulation Revenue (USD Million) By Region (2021-2032)
Figure 27. Africa Food Ingredients Encapsulation Revenue (USD Million) By Region (2021-2032)
Figure 28. North America Food Ingredients Encapsulation Revenue (USD Million) By Type (2021-2032)
Figure 29. North America Food Ingredients Encapsulation Revenue (USD Million) By Application (2021-2032)
Figure 30. North America Food Ingredients Encapsulation Revenue (USD Million) By Product (2021-2032)
Figure 31. Europe Food Ingredients Encapsulation Revenue (USD Million) By Type (2021-2032)
Figure 32. Europe Food Ingredients Encapsulation Revenue (USD Million) By Application (2021-2032)
Figure 33. Europe Food Ingredients Encapsulation Revenue (USD Million) By Product (2021-2032)
Figure 34. Asia Pacific Food Ingredients Encapsulation Revenue (USD Million) By Type (2021-2032)
Figure 35. Asia Pacific Food Ingredients Encapsulation Revenue (USD Million) By Application (2021-2032)
Figure 36. Asia Pacific Food Ingredients Encapsulation Revenue (USD Million) By Product (2021-2032)
Figure 37. South America Food Ingredients Encapsulation Revenue (USD Million) By Type (2021-2032)
Figure 38. South America Food Ingredients Encapsulation Revenue (USD Million) By Application (2021-2032)
Figure 39. South America Food Ingredients Encapsulation Revenue (USD Million) By Product (2021-2032)
Figure 40. Middle East and Africa Food Ingredients Encapsulation Revenue (USD Million) By Type (2021-2032)
Figure 41. Middle East and Africa Food Ingredients Encapsulation Revenue (USD Million) By Application (2021-2032)
Figure 42. Middle East and Africa Food Ingredients Encapsulation Revenue (USD Million) By Product (2021-2032)
By Type
Microencapsulation
Nanoencapsulation
Hybrid Encapsulation
By Application
Food
Beverages
Others
Countries Analyzed
North America (US, Canada, Mexico)
Europe (Germany, UK, France, Spain, Italy, Russia, Rest of Europe)
Asia Pacific (China, India, Japan, South Korea, Australia, South East Asia, Rest of Asia)
South America (Brazil, Argentina, Rest of South America)
Middle East and Africa (Saudi Arabia, UAE, Rest of Middle East, South Africa, Egypt, Rest of Africa)
