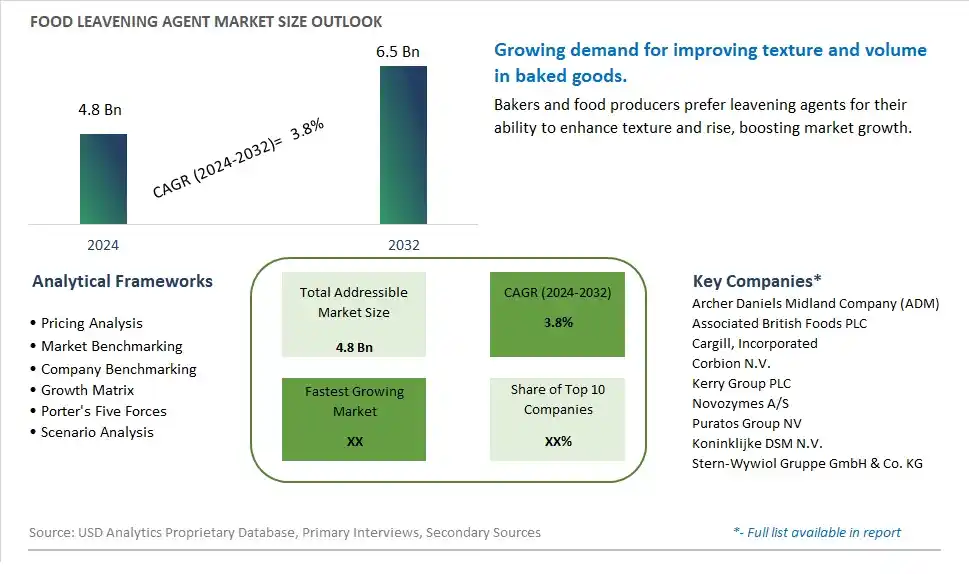
Global Food Leavening Agent Market Size is valued at $4.8 Billion in 2024 and is forecast to register a growth rate (CAGR) of 3.8% to reach $6.5 Billion by 2032.
The global Food Leavening Agent Market Comprehensive Study analyzes and forecasts the market size across 6 regions and 24 countries for diverse segments -By Form (Physical Leaving Agent, Chemical Leaving Agent, Biological Leaving Agent), By Application (Bread, Biscuits and Cookies, Cakes and Pastries, Rolls and Pies, Others), By Type (Yeast, Baking Powder, Baking Soda, Others)
An Introduction to Food Leavening Agent Market
In 2024, the Food Leavening Agent market is witnessing robust growth, driven by the increasing demand for baked goods and processed foods. Leavening agents, such as baking powder, baking soda, and yeast, are essential for improving the texture and volume of baked products. The market benefits from advancements in food processing technologies, the growing trend of home baking and convenience foods, and the expansion of the global bakery sector. Additionally, the rising focus on clean label and natural leavening agents is contributing to market growth.
Food Leavening Agent Competitive Landscape
The market report analyses the leading companies in the industry including Archer Daniels Midland Company (ADM), Associated British Foods PLC, Cargill, Incorporated, Corbion N.V., Kerry Group PLC, Novozymes A/S, Puratos Group NV, Koninklijke DSM N.V., Stern-Wywiol Gruppe GmbH & Co. KG, and Others.
Food Leavening Agent Market Dynamics
Food Leavening Agent Market Trend: Rising Demand for Clean Label Leavening Agents
The most prominent trend in the Food Leavening Agent Market is the rising demand for clean label leavening agents. Consumers are increasingly looking for food products with simple, natural, and recognizable ingredients. This trend is driven by the clean label movement, which emphasizes transparency and the avoidance of artificial additives. Manufacturers are responding by developing leavening agents that meet these clean label criteria while maintaining functionality and performance.
Food Leavening Agent Market Driver: Growth in Bakery and Confectionery Industries
The key driver of the Food Leavening Agent Market is the growth in the bakery and confectionery industries. As consumer demand for baked goods and confectionery products continues to rise, there is a corresponding increase in the need for effective leavening agents. These agents play a crucial role in achieving the desired texture, volume, and consistency in a wide range of baked products, driving their demand in the food industry.
Food Leavening Agent Market Opportunity: Innovation in Natural and Organic Leavening Solutions
A significant opportunity in the Food Leavening Agent Market lies in innovation in natural and organic leavening solutions. As consumers become more health-conscious and seek organic food products, there is potential for developing leavening agents that are derived from natural sources and certified organic. By offering products that cater to the growing demand for natural and organic baked goods, companies can differentiate themselves and attract health-focused consumers.
Food Leavening Agent Market Share Analysis: Yeast segment generated the highest revenue share in the industry
Within the Food Leavening Agent market, Yeast stands out as the largest segment by type. Yeast is a crucial ingredient in baking processes, especially in the production of bread, where it acts as a biological leavening agent. Yeast facilitates fermentation, converting sugars into carbon dioxide gas and alcohol, which causes the dough to rise and gives bread its characteristic texture and flavor. Due to its widespread use in baking applications, yeast holds a dominant position in the market among other types of leavening agents such as baking powder, baking soda, and others. Its natural fermentation process contributes not only to the leavening but also enhances the aroma and taste profile of baked goods.
Food Leavening Agent Market Share Analysis: Bread is the fastest growing segment over the forecast period to 2032
The Bread application segment is poised for rapid growth in the Food Leavening Agent market up to 2032. Bread is a staple food consumed globally, and the demand for various types of bread, including whole grain, artisanal, and specialty bread, continues to rise. Leavening agents, particularly yeast, play a critical role in achieving the desired texture and volume in bread production. With increasing consumer preferences for healthier and artisanal bread varieties, the demand for leavening agents in bread-making is expected to surge. Further, innovations in baking technologies and rising disposable incomes are fueling the growth of the Bread segment within the Food Leavening Agent market. As consumers seek higher-quality and diverse bread options, manufacturers are focusing on enhancing their product offerings with efficient leavening solutions to meet evolving market demands.
Food Leavening Agent Market Segmentation
By Form
Physical Leaving Agent
Chemical Leaving Agent
Biological Leaving Agent
By Application
Bread
Biscuits and Cookies
Cakes and Pastries
Rolls and Pies
Others
By Type
Yeast
Baking Powder
Baking Soda
Others
Countries Analyzed
North America (US, Canada, Mexico)
Europe (Germany, UK, France, Spain, Italy, Russia, Rest of Europe)
Asia Pacific (China, India, Japan, South Korea, Australia, South East Asia, Rest of Asia)
South America (Brazil, Argentina, Rest of South America)
Middle East and Africa (Saudi Arabia, UAE, Rest of Middle East, South Africa, Egypt, Rest of Africa)
Food Leavening Agent Companies Profiled in the Study
Archer Daniels Midland Company (ADM)
Associated British Foods PLC
Cargill, Incorporated
Corbion N.V.
Kerry Group PLC
Novozymes A/S
Puratos Group NV
Koninklijke DSM N.V.
Stern-Wywiol Gruppe GmbH & Co. KG
*- List Not Exhaustive
Chapter 1. TABLE OF CONTENTS
Chapter 2. Introduction to Food Leavening Agent Market
2.1. Market Overview
2.2. Key Statistics and Report Highlights
2.3. Scope of the Comprehensive Study
2.3.1. Market Definition
2.3.2 Countries and Regions Covered
2.3.3 Research Objective
2.3.4 Units, Currency, and Conversions
2.3.5 Industry Value Chain
2.4. Key Market Segments
2.5. Key Companies
2.6. Study Period
Chapter 3. Strategic Analysis Review
3.1. Food Leavening Agent Pricing Analysis and Forecast
3.2. Porter’s Five Forces
3.3. Market Ecosystem
3.4. SWOT Analysis
3.5. Regulatory Scenario
3.3. Effects of Inflation, Russia-Ukraine War, moderating economic growth, and other macroeconomic factors
Chapter 4. Competitive Landscape
4.1. Market Share Analysis
4.1.1. Global Food Leavening Agent Market Share by Company, 2023
4.1.2. Product Offerings of Leading Food Leavening Agent Companies
4.2. Market Entropy
4.2.1. New Product Launches in the Industry
4.2.2. Mergers, Acquisitions, Joint ventures, and Partnerships
4.3. Key Strategies and Best Practices
Chapter 5. Global Market Projections: Best, Reference, and Low Case Scenarios
5.1. Growth Analysis- Case Scenario Definitions
5.2. Low Growth Case Scenario Forecasts
5.3. Reference Growth Case Scenario Forecasts
5.4. High Growth Case Scenario Forecasts
Chapter 6. Market Dynamics
6.1. Food Leavening Agent Market Drivers
6.2. Food Leavening Agent Market Challenges
6.6. Food Leavening Agent Market Opportunities
6.4. Food Leavening Agent Market Trends
Chapter 7. Global Food Leavening Agent Market Outlook Trends
7.1. Global Food Leavening Agent Revenue (USD Million) and CAGR (%) by Type (2021-2032)
7.2. Global Food Leavening Agent Revenue (USD Million) and CAGR (%) by Application (2021-2032)
7.3. Global Food Leavening Agent Revenue (USD Million) and CAGR (%) by Product (2021-2032)
By Form
Physical Leaving Agent
Chemical Leaving Agent
Biological Leaving Agent
By Application
Bread
Biscuits and Cookies
Cakes and Pastries
Rolls and Pies
Others
By Type
Yeast
Baking Powder
Baking Soda
Others
Chapter 8. Global Food Leavening Agent Regional Analysis and Outlook
8.1. Global Food Leavening Agent Revenue (USD Million) By Regions (2021- 2032)
8.2. North America Food Leavening Agent Revenue (USD Million) by Country (2021-2032)
8.2.1. United States Food Leavening Agent Regional Analysis and Outlook
8.2.2. Canada Food Leavening Agent Regional Analysis and Outlook
8.2.3. Mexico Food Leavening Agent Regional Analysis and Outlook
8.3. Europe Food Leavening Agent Revenue (USD Million), by Country (2021-2032)
8.3.1. Germany Food Leavening Agent Regional Analysis and Outlook
8.3.2. France Food Leavening Agent Regional Analysis and Outlook
8.3.3. United Kingdom Food Leavening Agent Regional Analysis and Outlook
8.3.4. Spain Food Leavening Agent Regional Analysis and Outlook
8.3.5. Italy Food Leavening Agent Regional Analysis and Outlook
8.3.6. Russia Food Leavening Agent Regional Analysis and Outlook
8.3.7. Rest of Europe Food Leavening Agent Regional Analysis and Outlook
8.4. Asia Pacific Food Leavening Agent Revenue (USD Million) by Country (2021-2032)
8.4.1. China Food Leavening Agent Regional Analysis and Outlook
8.4.2. Japan Food Leavening Agent Regional Analysis and Outlook
8.4.3. India Food Leavening Agent Regional Analysis and Outlook
8.4.4. South Korea Food Leavening Agent Regional Analysis and Outlook
8.4.5. Australia Food Leavening Agent Regional Analysis and Outlook
8.4.6. South East Asia Food Leavening Agent Regional Analysis and Outlook
8.4.7. Rest of Asia Pacific Food Leavening Agent Regional Analysis and Outlook
8.5. South America Food Leavening Agent Revenue (USD Million), by Country (2021-2032)
8.5.1. Brazil Food Leavening Agent Regional Analysis and Outlook
8.5.2. Argentina Food Leavening Agent Regional Analysis and Outlook
8.5.3. Rest of South America Food Leavening Agent Regional Analysis and Outlook
8.6. Middle East and Africa Food Leavening Agent Revenue (USD Million) by Country (2021-2032)
8.6.1. Middle East Food Leavening Agent Regional Analysis and Outlook
8.6.2. Africa Food Leavening Agent Regional Analysis and Outlook
Chapter 9. North America Food Leavening Agent Analysis and Outlook
9.1. North America Food Leavening Agent Revenue (USD Million) by Segments (2021-2032)
9.1.1. North America Food Leavening Agent Revenue (USD Million) by Type (2021-2032)
9.1.2. North America Food Leavening Agent Revenue (USD Million) by Application (2021-2032)
9.1.3. North America Food Leavening Agent Revenue (USD Million) by Product (2021-2032)
By Form
Physical Leaving Agent
Chemical Leaving Agent
Biological Leaving Agent
By Application
Bread
Biscuits and Cookies
Cakes and Pastries
Rolls and Pies
Others
By Type
Yeast
Baking Powder
Baking Soda
Others
Chapter 10. Europe Food Leavening Agent Analysis and Outlook
10.1. Europe Food Leavening Agent Revenue (USD Million), by Segments (USD Million) (2021-2032)
10.1.1. Europe Food Leavening Agent Revenue (USD Million) by Type (2021-2032)
10.1.2. Europe Food Leavening Agent Revenue (USD Million) by Application (2021-2032)
10.1.3. Europe Food Leavening Agent Revenue (USD Million) by Product (2021-2032)
By Form
Physical Leaving Agent
Chemical Leaving Agent
Biological Leaving Agent
By Application
Bread
Biscuits and Cookies
Cakes and Pastries
Rolls and Pies
Others
By Type
Yeast
Baking Powder
Baking Soda
Others
Chapter 11. Asia Pacific Food Leavening Agent Analysis and Outlook
11.1. Asia Pacific Food Leavening Agent Revenue (USD Million), and Revenue (USD Million) by Segments (2021-2032)
11.1.1. Asia Pacific Food Leavening Agent Revenue (USD Million) by Type (2021-2032)
11.1.2. Asia Pacific Food Leavening Agent Revenue (USD Million) by Application (2021-2032)
11.1.3. Asia Pacific Food Leavening Agent Revenue (USD Million) by Product (2021-2032)
By Form
Physical Leaving Agent
Chemical Leaving Agent
Biological Leaving Agent
By Application
Bread
Biscuits and Cookies
Cakes and Pastries
Rolls and Pies
Others
By Type
Yeast
Baking Powder
Baking Soda
Others
Chapter 12. South America Food Leavening Agent Analysis and Outlook
12.1. South America Food Leavening Agent Revenue (USD Million), by Segments (2021-2032)
12.1.1. South America Food Leavening Agent Revenue (USD Million) by Type (2021-2032)
12.1.2. South America Food Leavening Agent Revenue (USD Million) by Application (2021-2032)
12.1.3. South America Food Leavening Agent Revenue (USD Million) by Product (2021-2032)
By Form
Physical Leaving Agent
Chemical Leaving Agent
Biological Leaving Agent
By Application
Bread
Biscuits and Cookies
Cakes and Pastries
Rolls and Pies
Others
By Type
Yeast
Baking Powder
Baking Soda
Others
Chapter 13. Middle East and Africa Food Leavening Agent Analysis and Outlook
13.1. Middle East and Africa Food Leavening Agent Revenue (USD Million), by Segments (2021-2032)
13.1.1. Middle East and Africa Food Leavening Agent Revenue (USD Million) by Type (2021-2032)
13.1.2. Middle East and Africa Food Leavening Agent Revenue (USD Million) by Application (2021-2032)
13.1.3. Middle East and Africa Food Leavening Agent Revenue (USD Million) by Product (2021-2032)
By Form
Physical Leaving Agent
Chemical Leaving Agent
Biological Leaving Agent
By Application
Bread
Biscuits and Cookies
Cakes and Pastries
Rolls and Pies
Others
By Type
Yeast
Baking Powder
Baking Soda
Others
Chapter 14. Food Leavening Agent Company Profiles
14.1 Business Overview
14.2 Product Profiles
14.3 SWOT Profiles
14.5 Recent Developments
14.6 Financial Profile
List of Companies
Archer Daniels Midland Company (ADM)
Associated British Foods PLC
Cargill, Incorporated
Corbion N.V.
Kerry Group PLC
Novozymes A/S
Puratos Group NV
Koninklijke DSM N.V.
Stern-Wywiol Gruppe GmbH & Co. KG
15. Methodology and Data Sources
15.1 Customization Offerings
15.2 Subscription Services
15.3 Related Reports
15.4 Publisher Expertise
LIST OF TABLES
Table 1 Market Segmentation Analysis
Table 2 Global Food Leavening Agent Market Share of Leading Companies, 2023
Table 3 Product Offerings of Leading Companies
Table 4 Low Growth Scenario Forecasts
Table 5 Reference Case Growth Scenario
Table 6 High Growth Case Scenario
Table 7 Global Food Leavening Agent Revenue (USD Million) And CAGR (%) By Type (2021-2032)
Table 8 Global Food Leavening Agent Revenue (USD Million) And CAGR (%) By Application (2021-2032)
Table 9 Global Food Leavening Agent Revenue (USD Million) And CAGR (%) By Product (2021-2032)
Table 10 Global Food Leavening Agent Market Revenue (USD Million) By Regions (2021-2032)
Table 11 Global Food Leavening Agent Market Share (%) By Regions (2021-2032)
Table 12 North America Food Leavening Agent Revenue (USD Million) By Country (2021-2032)
Table 13 Europe Food Leavening Agent Revenue (USD Million) By Country (2021-2032)
Table 14 Asia Pacific Food Leavening Agent Revenue (USD Million) By Country (2021-2032)
Table 15 South America Food Leavening Agent Revenue (USD Million) By Country (2021-2032)
Table 16 Middle East and Africa Food Leavening Agent Revenue (USD Million) By Region (2021-2032)
Table 17 North America Food Leavening Agent Revenue (USD Million) By Type (2021-2032)
Table 18 North America Food Leavening Agent Revenue (USD Million) By Application (2021-2032)
Table 19 North America Food Leavening Agent Revenue (USD Million) By Product (2021-2032)
Table 20 Europe Food Leavening Agent Revenue (USD Million) By Type (2021-2032)
Table 21 Europe Food Leavening Agent Revenue (USD Million) By Application (2021-2032)
Table 22 Europe Food Leavening Agent Revenue (USD Million) By Product (2021-2032)
Table 23 Asia Pacific Food Leavening Agent Revenue (USD Million) By Type (2021-2032)
Table 24 Asia Pacific Food Leavening Agent Revenue (USD Million) By Application (2021-2032)
Table 25 Asia Pacific Food Leavening Agent Revenue (USD Million) By Product (2021-2032)
Table 26 South America Food Leavening Agent Revenue (USD Million) By Type (2021-2032)
Table 27 South America Food Leavening Agent Revenue (USD Million) By Application (2021-2032)
Table 28 South America Food Leavening Agent Revenue (USD Million) By Product (2021-2032)
Table 29 Middle East and Africa Food Leavening Agent Revenue (USD Million) By Type (2021-2032)
Table 30 Middle East and Africa Food Leavening Agent Revenue (USD Million) By Application (2021-2032)
Table 31 Middle East and Africa Food Leavening Agent Revenue (USD Million) By Product (2021-2032)
LIST OF FIGURES
Figure 1. Market Scope
Figure 2. Pricing Forecasts Per Unit, 2023- 2032
Figure 3. Porter’s Five Forces
Figure 4. Global Food Leavening Agent Market Revenue (USD Million) By Regions (2021-2032)
Figure 5. Global Food Leavening Agent Market Share (%) By Regions (2023)
Figure 6. North America Food Leavening Agent Revenue (USD Million) By Country (2021-2032)
Figure 7. United States Food Leavening Agent Revenue (USD Million) By Country (2021-2032)
Figure 8. Canada Food Leavening Agent Revenue (USD Million) By Country (2021-2032)
Figure 9. Mexico Food Leavening Agent Revenue (USD Million) By Country (2021-2032)
Figure 10. Europe Food Leavening Agent Revenue (USD Million) By Country (2021-2032)
Figure 11. Germany Food Leavening Agent Revenue (USD Million) By Country (2021-2032)
Figure 12. France Food Leavening Agent Revenue (USD Million) By Country (2021-2032)
Figure 13. United Kingdom Food Leavening Agent Revenue (USD Million) By Country (2021-2032)
Figure 14. Spain Food Leavening Agent Revenue (USD Million) By Country (2021-2032)
Figure 15. Italy Food Leavening Agent Revenue (USD Million) By Country (2021-2032)
Figure 16. Russia Food Leavening Agent Revenue (USD Million) By Country (2021-2032)
Figure 17. Rest of Europe Food Leavening Agent Revenue (USD Million) By Country (2021-2032)
Figure 11. Asia Pacific Food Leavening Agent Revenue (USD Million) By Country (2021-2032)
Figure 12. China Food Leavening Agent Revenue (USD Million) By Country (2021-2032)
Figure 13. Japan Food Leavening Agent Revenue (USD Million) By Country (2021-2032)
Figure 14. India Food Leavening Agent Revenue (USD Million) By Country (2021-2032)
Figure 15. South Korea Food Leavening Agent Revenue (USD Million) By Country (2021-2032)
Figure 16. Australia Food Leavening Agent Revenue (USD Million) By Country (2021-2032)
Figure 17. South East Asia Food Leavening Agent Revenue (USD Million) By Country (2021-2032)
Figure 18. South America Food Leavening Agent Revenue (USD Million) By Country (2021-2032)
Figure 19. Brazil Food Leavening Agent Revenue (USD Million) By Country (2021-2032)
Figure 20. Argentina Food Leavening Agent Revenue (USD Million) By Country (2021-2032)
Figure 21. Rest of Asia Pacific Food Leavening Agent Revenue (USD Million) By Country (2021-2032)
Figure 22. Middle East and Africa Food Leavening Agent Revenue (USD Million) By Region (2021-2032)
Figure 23. Saudi Arabia Food Leavening Agent Revenue (USD Million) By Region (2021-2032)
Figure 24. The UAE Food Leavening Agent Revenue (USD Million) By Region (2021-2032)
Figure 25. Rest of Middle East Food Leavening Agent Revenue (USD Million) By Region (2021-2032)
Figure 26. South Africa Food Leavening Agent Revenue (USD Million) By Region (2021-2032)
Figure 27. Africa Food Leavening Agent Revenue (USD Million) By Region (2021-2032)
Figure 28. North America Food Leavening Agent Revenue (USD Million) By Type (2021-2032)
Figure 29. North America Food Leavening Agent Revenue (USD Million) By Application (2021-2032)
Figure 30. North America Food Leavening Agent Revenue (USD Million) By Product (2021-2032)
Figure 31. Europe Food Leavening Agent Revenue (USD Million) By Type (2021-2032)
Figure 32. Europe Food Leavening Agent Revenue (USD Million) By Application (2021-2032)
Figure 33. Europe Food Leavening Agent Revenue (USD Million) By Product (2021-2032)
Figure 34. Asia Pacific Food Leavening Agent Revenue (USD Million) By Type (2021-2032)
Figure 35. Asia Pacific Food Leavening Agent Revenue (USD Million) By Application (2021-2032)
Figure 36. Asia Pacific Food Leavening Agent Revenue (USD Million) By Product (2021-2032)
Figure 37. South America Food Leavening Agent Revenue (USD Million) By Type (2021-2032)
Figure 38. South America Food Leavening Agent Revenue (USD Million) By Application (2021-2032)
Figure 39. South America Food Leavening Agent Revenue (USD Million) By Product (2021-2032)
Figure 40. Middle East and Africa Food Leavening Agent Revenue (USD Million) By Type (2021-2032)
Figure 41. Middle East and Africa Food Leavening Agent Revenue (USD Million) By Application (2021-2032)
Figure 42. Middle East and Africa Food Leavening Agent Revenue (USD Million) By Product (2021-2032)
By Form
Physical Leaving Agent
Chemical Leaving Agent
Biological Leaving Agent
By Application
Bread
Biscuits and Cookies
Cakes and Pastries
Rolls and Pies
Others
By Type
Yeast
Baking Powder
Baking Soda
Others
Countries Analyzed
North America (US, Canada, Mexico)
Europe (Germany, UK, France, Spain, Italy, Russia, Rest of Europe)
Asia Pacific (China, India, Japan, South Korea, Australia, South East Asia, Rest of Asia)
South America (Brazil, Argentina, Rest of South America)
Middle East and Africa (Saudi Arabia, UAE, Rest of Middle East, South Africa, Egypt, Rest of Africa)
