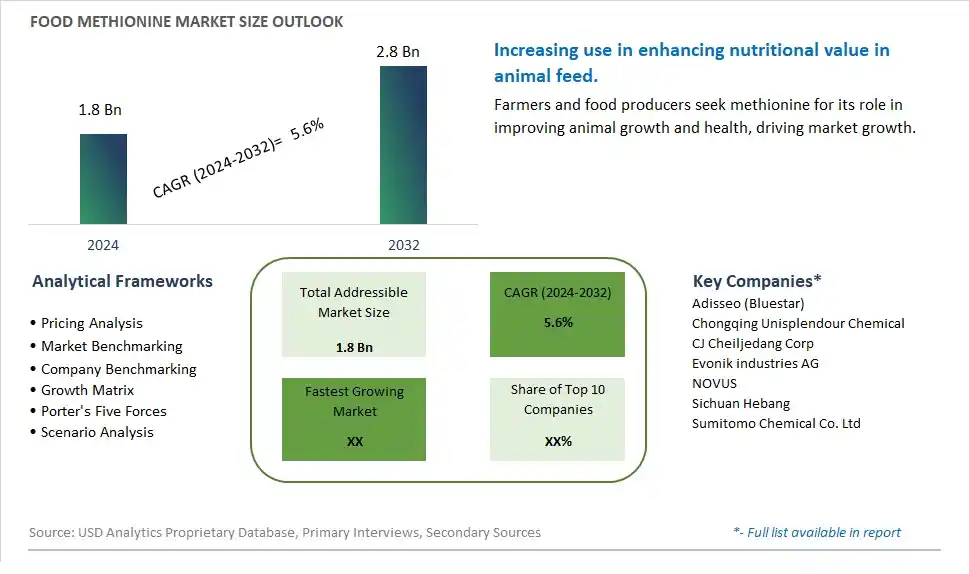
Global Food Methionine Market Size is valued at $1.8 Billion in 2024 and is forecast to register a growth rate (CAGR) of 5.6% to reach $2.8 Billion by 2032.
The global Food Methionine Market Comprehensive Study analyzes and forecasts the market size across 6 regions and 24 countries for diverse segments -By Type (Liquid, Solid), By Application (Adults, Children)
An Introduction to Food Methionine Market
The Food Methionine market in 2024 is experiencing significant growth, driven by the increasing demand for essential amino acids in animal feed and human nutrition. Methionine, an essential amino acid, is crucial for protein synthesis and overall health. The market benefits from advancements in amino acid production technologies, the growing trend of health and wellness, and the expansion of the animal nutrition sector. Additionally, the rising awareness of the benefits of methionine supplementation for growth and development is contributing to market growth.
Food Methionine Competitive Landscape
The market report analyses the leading companies in the industry including Adisseo (Bluestar), Chongqing Unisplendour Chemical, CJ Cheiljedang Corp, Evonik industries AG, NOVUS, Sichuan Hebang, Sumitomo Chemical Co. Ltd, and Others.
Food Methionine Market Dynamics
Food Methionine Market Trend: Increasing Use in Nutritional Supplements
The most prominent trend in the Food Methionine Market is the increasing use of methionine in nutritional supplements. As consumers seek ways to enhance their health and wellness through diet, the demand for supplements that provide essential amino acids, like methionine, is on the rise. This trend is driven by the growing awareness of the benefits of amino acids for muscle growth, liver function, and overall health.
Food Methionine Market Driver: Rising Health and Fitness Consciousness
The key driver of the Food Methionine Market is the rising health and fitness consciousness among consumers. As more people engage in physical activities and adopt fitness regimes, there is a higher demand for dietary supplements that support muscle recovery and performance. Methionine, being a vital amino acid, is increasingly incorporated into sports nutrition products, driving its market growth.
Food Methionine Market Opportunity: Expansion into Functional Foods and Beverages
A significant opportunity in the Food Methionine Market lies in the expansion into functional foods and beverages. By incorporating methionine into a variety of food and beverage products, such as protein bars, fortified snacks, and health drinks, companies can cater to the growing demand for functional foods that offer specific health benefits. This approach can help manufacturers capture a larger share of the health-conscious consumer market.
Food Methionine Market Share Analysis: Solid segment generated the highest revenue share in the industry
In the Food Methionine market, the Solid type emerges as the largest segment. Solid methionine is commonly used in food and dietary supplements due to its stability and ease of handling in manufacturing processes. Methionine is an essential amino acid crucial for protein synthesis and various metabolic functions in the body. It is particularly valued for its role in maintaining tissue integrity and supporting immune function. The solid form of methionine is preferred for its shelf stability and versatility in formulation across different food products, including beverages, snacks, and dietary supplements.
Food Methionine Market Share Analysis: Adults is the fastest growing segment over the forecast period to 2032
The Adults segment is experiencing significant growth in the Food Methionine market leading up to 2032. Methionine plays a vital role in adult nutrition, supporting overall health and wellness. It is essential for the synthesis of proteins and other important molecules in the body, contributing to muscle maintenance, metabolism, and cellular function. With increasing awareness of nutritional health and wellness among adults, there is a rising demand for dietary supplements and functional foods fortified with methionine. Manufacturers are responding by incorporating methionine into products targeted at adult consumers seeking to enhance their nutritional intake and support healthy aging. This trend is driving innovation in methionine formulations tailored for adult health, thereby propelling growth in the Adults application segment within the Food Methionine market.
Food Methionine Market Segmentation
By Type
Liquid
Solid
By Application
Adults
Children
Countries Analyzed
North America (US, Canada, Mexico)
Europe (Germany, UK, France, Spain, Italy, Russia, Rest of Europe)
Asia Pacific (China, India, Japan, South Korea, Australia, South East Asia, Rest of Asia)
South America (Brazil, Argentina, Rest of South America)
Middle East and Africa (Saudi Arabia, UAE, Rest of Middle East, South Africa, Egypt, Rest of Africa)
Food Methionine Companies Profiled in the Study
Adisseo (Bluestar)
Chongqing Unisplendour Chemical
CJ Cheiljedang Corp
Evonik industries AG
NOVUS
Sichuan Hebang
Sumitomo Chemical Co. Ltd
*- List Not Exhaustive
Chapter 1. TABLE OF CONTENTS
Chapter 2. Introduction to Food Methionine Market
2.1. Market Overview
2.2. Key Statistics and Report Highlights
2.3. Scope of the Comprehensive Study
2.3.1. Market Definition
2.3.2 Countries and Regions Covered
2.3.3 Research Objective
2.3.4 Units, Currency, and Conversions
2.3.5 Industry Value Chain
2.4. Key Market Segments
2.5. Key Companies
2.6. Study Period
Chapter 3. Strategic Analysis Review
3.1. Food Methionine Pricing Analysis and Forecast
3.2. Porter’s Five Forces
3.3. Market Ecosystem
3.4. SWOT Analysis
3.5. Regulatory Scenario
3.3. Effects of Inflation, Russia-Ukraine War, moderating economic growth, and other macroeconomic factors
Chapter 4. Competitive Landscape
4.1. Market Share Analysis
4.1.1. Global Food Methionine Market Share by Company, 2023
4.1.2. Product Offerings of Leading Food Methionine Companies
4.2. Market Entropy
4.2.1. New Product Launches in the Industry
4.2.2. Mergers, Acquisitions, Joint ventures, and Partnerships
4.3. Key Strategies and Best Practices
Chapter 5. Global Market Projections: Best, Reference, and Low Case Scenarios
5.1. Growth Analysis- Case Scenario Definitions
5.2. Low Growth Case Scenario Forecasts
5.3. Reference Growth Case Scenario Forecasts
5.4. High Growth Case Scenario Forecasts
Chapter 6. Market Dynamics
6.1. Food Methionine Market Drivers
6.2. Food Methionine Market Challenges
6.6. Food Methionine Market Opportunities
6.4. Food Methionine Market Trends
Chapter 7. Global Food Methionine Market Outlook Trends
7.1. Global Food Methionine Revenue (USD Million) and CAGR (%) by Type (2021-2032)
7.2. Global Food Methionine Revenue (USD Million) and CAGR (%) by Application (2021-2032)
7.3. Global Food Methionine Revenue (USD Million) and CAGR (%) by Product (2021-2032)
By Type
Liquid
Solid
By Application
Adults
Children
Chapter 8. Global Food Methionine Regional Analysis and Outlook
8.1. Global Food Methionine Revenue (USD Million) By Regions (2021- 2032)
8.2. North America Food Methionine Revenue (USD Million) by Country (2021-2032)
8.2.1. United States Food Methionine Regional Analysis and Outlook
8.2.2. Canada Food Methionine Regional Analysis and Outlook
8.2.3. Mexico Food Methionine Regional Analysis and Outlook
8.3. Europe Food Methionine Revenue (USD Million), by Country (2021-2032)
8.3.1. Germany Food Methionine Regional Analysis and Outlook
8.3.2. France Food Methionine Regional Analysis and Outlook
8.3.3. United Kingdom Food Methionine Regional Analysis and Outlook
8.3.4. Spain Food Methionine Regional Analysis and Outlook
8.3.5. Italy Food Methionine Regional Analysis and Outlook
8.3.6. Russia Food Methionine Regional Analysis and Outlook
8.3.7. Rest of Europe Food Methionine Regional Analysis and Outlook
8.4. Asia Pacific Food Methionine Revenue (USD Million) by Country (2021-2032)
8.4.1. China Food Methionine Regional Analysis and Outlook
8.4.2. Japan Food Methionine Regional Analysis and Outlook
8.4.3. India Food Methionine Regional Analysis and Outlook
8.4.4. South Korea Food Methionine Regional Analysis and Outlook
8.4.5. Australia Food Methionine Regional Analysis and Outlook
8.4.6. South East Asia Food Methionine Regional Analysis and Outlook
8.4.7. Rest of Asia Pacific Food Methionine Regional Analysis and Outlook
8.5. South America Food Methionine Revenue (USD Million), by Country (2021-2032)
8.5.1. Brazil Food Methionine Regional Analysis and Outlook
8.5.2. Argentina Food Methionine Regional Analysis and Outlook
8.5.3. Rest of South America Food Methionine Regional Analysis and Outlook
8.6. Middle East and Africa Food Methionine Revenue (USD Million) by Country (2021-2032)
8.6.1. Middle East Food Methionine Regional Analysis and Outlook
8.6.2. Africa Food Methionine Regional Analysis and Outlook
Chapter 9. North America Food Methionine Analysis and Outlook
9.1. North America Food Methionine Revenue (USD Million) by Segments (2021-2032)
9.1.1. North America Food Methionine Revenue (USD Million) by Type (2021-2032)
9.1.2. North America Food Methionine Revenue (USD Million) by Application (2021-2032)
9.1.3. North America Food Methionine Revenue (USD Million) by Product (2021-2032)
By Type
Liquid
Solid
By Application
Adults
Children
Chapter 10. Europe Food Methionine Analysis and Outlook
10.1. Europe Food Methionine Revenue (USD Million), by Segments (USD Million) (2021-2032)
10.1.1. Europe Food Methionine Revenue (USD Million) by Type (2021-2032)
10.1.2. Europe Food Methionine Revenue (USD Million) by Application (2021-2032)
10.1.3. Europe Food Methionine Revenue (USD Million) by Product (2021-2032)
By Type
Liquid
Solid
By Application
Adults
Children
Chapter 11. Asia Pacific Food Methionine Analysis and Outlook
11.1. Asia Pacific Food Methionine Revenue (USD Million), and Revenue (USD Million) by Segments (2021-2032)
11.1.1. Asia Pacific Food Methionine Revenue (USD Million) by Type (2021-2032)
11.1.2. Asia Pacific Food Methionine Revenue (USD Million) by Application (2021-2032)
11.1.3. Asia Pacific Food Methionine Revenue (USD Million) by Product (2021-2032)
By Type
Liquid
Solid
By Application
Adults
Children
Chapter 12. South America Food Methionine Analysis and Outlook
12.1. South America Food Methionine Revenue (USD Million), by Segments (2021-2032)
12.1.1. South America Food Methionine Revenue (USD Million) by Type (2021-2032)
12.1.2. South America Food Methionine Revenue (USD Million) by Application (2021-2032)
12.1.3. South America Food Methionine Revenue (USD Million) by Product (2021-2032)
By Type
Liquid
Solid
By Application
Adults
Children
Chapter 13. Middle East and Africa Food Methionine Analysis and Outlook
13.1. Middle East and Africa Food Methionine Revenue (USD Million), by Segments (2021-2032)
13.1.1. Middle East and Africa Food Methionine Revenue (USD Million) by Type (2021-2032)
13.1.2. Middle East and Africa Food Methionine Revenue (USD Million) by Application (2021-2032)
13.1.3. Middle East and Africa Food Methionine Revenue (USD Million) by Product (2021-2032)
By Type
Liquid
Solid
By Application
Adults
Children
Chapter 14. Food Methionine Company Profiles
14.1 Business Overview
14.2 Product Profiles
14.3 SWOT Profiles
14.5 Recent Developments
14.6 Financial Profile
List of Companies
Adisseo (Bluestar)
Chongqing Unisplendour Chemical
CJ Cheiljedang Corp
Evonik industries AG
NOVUS
Sichuan Hebang
Sumitomo Chemical Co. Ltd
15. Methodology and Data Sources
15.1 Customization Offerings
15.2 Subscription Services
15.3 Related Reports
15.4 Publisher Expertise
LIST OF TABLES
Table 1 Market Segmentation Analysis
Table 2 Global Food Methionine Market Share of Leading Companies, 2023
Table 3 Product Offerings of Leading Companies
Table 4 Low Growth Scenario Forecasts
Table 5 Reference Case Growth Scenario
Table 6 High Growth Case Scenario
Table 7 Global Food Methionine Revenue (USD Million) And CAGR (%) By Type (2021-2032)
Table 8 Global Food Methionine Revenue (USD Million) And CAGR (%) By Application (2021-2032)
Table 9 Global Food Methionine Revenue (USD Million) And CAGR (%) By Product (2021-2032)
Table 10 Global Food Methionine Market Revenue (USD Million) By Regions (2021-2032)
Table 11 Global Food Methionine Market Share (%) By Regions (2021-2032)
Table 12 North America Food Methionine Revenue (USD Million) By Country (2021-2032)
Table 13 Europe Food Methionine Revenue (USD Million) By Country (2021-2032)
Table 14 Asia Pacific Food Methionine Revenue (USD Million) By Country (2021-2032)
Table 15 South America Food Methionine Revenue (USD Million) By Country (2021-2032)
Table 16 Middle East and Africa Food Methionine Revenue (USD Million) By Region (2021-2032)
Table 17 North America Food Methionine Revenue (USD Million) By Type (2021-2032)
Table 18 North America Food Methionine Revenue (USD Million) By Application (2021-2032)
Table 19 North America Food Methionine Revenue (USD Million) By Product (2021-2032)
Table 20 Europe Food Methionine Revenue (USD Million) By Type (2021-2032)
Table 21 Europe Food Methionine Revenue (USD Million) By Application (2021-2032)
Table 22 Europe Food Methionine Revenue (USD Million) By Product (2021-2032)
Table 23 Asia Pacific Food Methionine Revenue (USD Million) By Type (2021-2032)
Table 24 Asia Pacific Food Methionine Revenue (USD Million) By Application (2021-2032)
Table 25 Asia Pacific Food Methionine Revenue (USD Million) By Product (2021-2032)
Table 26 South America Food Methionine Revenue (USD Million) By Type (2021-2032)
Table 27 South America Food Methionine Revenue (USD Million) By Application (2021-2032)
Table 28 South America Food Methionine Revenue (USD Million) By Product (2021-2032)
Table 29 Middle East and Africa Food Methionine Revenue (USD Million) By Type (2021-2032)
Table 30 Middle East and Africa Food Methionine Revenue (USD Million) By Application (2021-2032)
Table 31 Middle East and Africa Food Methionine Revenue (USD Million) By Product (2021-2032)
LIST OF FIGURES
Figure 1. Market Scope
Figure 2. Pricing Forecasts Per Unit, 2023- 2032
Figure 3. Porter’s Five Forces
Figure 4. Global Food Methionine Market Revenue (USD Million) By Regions (2021-2032)
Figure 5. Global Food Methionine Market Share (%) By Regions (2023)
Figure 6. North America Food Methionine Revenue (USD Million) By Country (2021-2032)
Figure 7. United States Food Methionine Revenue (USD Million) By Country (2021-2032)
Figure 8. Canada Food Methionine Revenue (USD Million) By Country (2021-2032)
Figure 9. Mexico Food Methionine Revenue (USD Million) By Country (2021-2032)
Figure 10. Europe Food Methionine Revenue (USD Million) By Country (2021-2032)
Figure 11. Germany Food Methionine Revenue (USD Million) By Country (2021-2032)
Figure 12. France Food Methionine Revenue (USD Million) By Country (2021-2032)
Figure 13. United Kingdom Food Methionine Revenue (USD Million) By Country (2021-2032)
Figure 14. Spain Food Methionine Revenue (USD Million) By Country (2021-2032)
Figure 15. Italy Food Methionine Revenue (USD Million) By Country (2021-2032)
Figure 16. Russia Food Methionine Revenue (USD Million) By Country (2021-2032)
Figure 17. Rest of Europe Food Methionine Revenue (USD Million) By Country (2021-2032)
Figure 11. Asia Pacific Food Methionine Revenue (USD Million) By Country (2021-2032)
Figure 12. China Food Methionine Revenue (USD Million) By Country (2021-2032)
Figure 13. Japan Food Methionine Revenue (USD Million) By Country (2021-2032)
Figure 14. India Food Methionine Revenue (USD Million) By Country (2021-2032)
Figure 15. South Korea Food Methionine Revenue (USD Million) By Country (2021-2032)
Figure 16. Australia Food Methionine Revenue (USD Million) By Country (2021-2032)
Figure 17. South East Asia Food Methionine Revenue (USD Million) By Country (2021-2032)
Figure 18. South America Food Methionine Revenue (USD Million) By Country (2021-2032)
Figure 19. Brazil Food Methionine Revenue (USD Million) By Country (2021-2032)
Figure 20. Argentina Food Methionine Revenue (USD Million) By Country (2021-2032)
Figure 21. Rest of Asia Pacific Food Methionine Revenue (USD Million) By Country (2021-2032)
Figure 22. Middle East and Africa Food Methionine Revenue (USD Million) By Region (2021-2032)
Figure 23. Saudi Arabia Food Methionine Revenue (USD Million) By Region (2021-2032)
Figure 24. The UAE Food Methionine Revenue (USD Million) By Region (2021-2032)
Figure 25. Rest of Middle East Food Methionine Revenue (USD Million) By Region (2021-2032)
Figure 26. South Africa Food Methionine Revenue (USD Million) By Region (2021-2032)
Figure 27. Africa Food Methionine Revenue (USD Million) By Region (2021-2032)
Figure 28. North America Food Methionine Revenue (USD Million) By Type (2021-2032)
Figure 29. North America Food Methionine Revenue (USD Million) By Application (2021-2032)
Figure 30. North America Food Methionine Revenue (USD Million) By Product (2021-2032)
Figure 31. Europe Food Methionine Revenue (USD Million) By Type (2021-2032)
Figure 32. Europe Food Methionine Revenue (USD Million) By Application (2021-2032)
Figure 33. Europe Food Methionine Revenue (USD Million) By Product (2021-2032)
Figure 34. Asia Pacific Food Methionine Revenue (USD Million) By Type (2021-2032)
Figure 35. Asia Pacific Food Methionine Revenue (USD Million) By Application (2021-2032)
Figure 36. Asia Pacific Food Methionine Revenue (USD Million) By Product (2021-2032)
Figure 37. South America Food Methionine Revenue (USD Million) By Type (2021-2032)
Figure 38. South America Food Methionine Revenue (USD Million) By Application (2021-2032)
Figure 39. South America Food Methionine Revenue (USD Million) By Product (2021-2032)
Figure 40. Middle East and Africa Food Methionine Revenue (USD Million) By Type (2021-2032)
Figure 41. Middle East and Africa Food Methionine Revenue (USD Million) By Application (2021-2032)
Figure 42. Middle East and Africa Food Methionine Revenue (USD Million) By Product (2021-2032)
By Type
Liquid
Solid
By Application
Adults
Children
Countries Analyzed
North America (US, Canada, Mexico)
Europe (Germany, UK, France, Spain, Italy, Russia, Rest of Europe)
Asia Pacific (China, India, Japan, South Korea, Australia, South East Asia, Rest of Asia)
South America (Brazil, Argentina, Rest of South America)
Middle East and Africa (Saudi Arabia, UAE, Rest of Middle East, South Africa, Egypt, Rest of Africa)
