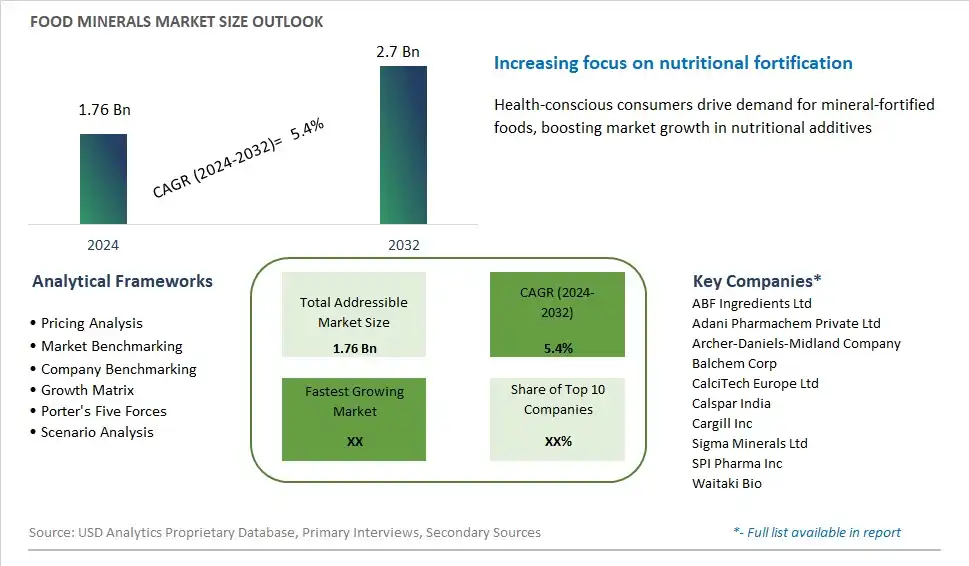
Global Food Minerals Market Size is valued at $1.76 Billion in 2024 and is forecast to register a growth rate (CAGR) of 5.4% to reach $2.7 Billion by 2032.
The global Food Minerals Market Comprehensive Study analyzes and forecasts the market size across 6 regions and 24 countries for diverse segments -By Product (Zinc, Magnesium, Calcium, Iron, Others), By Application (Food and Beverages, Nutraceuticals, Pharmaceuticals)
An Introduction to Food Minerals Market
The food minerals market in 2024 is growing steadily, driven by the increasing awareness of the importance of minerals in human nutrition. Essential minerals such as calcium, iron, magnesium, and zinc play vital roles in maintaining health and preventing deficiencies. The market benefits from the rising demand for fortified foods and dietary supplements, as consumers seek to enhance their nutritional intake. Innovations in food processing and fortification techniques have enabled the incorporation of minerals into a wide range of food products, including beverages, cereals, and dairy items. Additionally, the trend towards plant-based and organic foods has spurred interest in natural mineral sources. Regulatory support for nutrient fortification and the growing focus on health and wellness further drive the market. As consumers prioritize balanced diets and preventive health, the demand for food minerals is set to increase, driving market growth.
Food Minerals Competitive Landscape
The market report analyses the leading companies in the industry including ABF Ingredients Ltd, Adani Pharmachem Private Ltd, Archer-Daniels-Midland Company, Balchem Corp, CalciTech Europe Ltd, Calspar India, Cargill Inc, Sigma Minerals Ltd, SPI Pharma Inc, Waitaki Bio, and Others.
Food Minerals Market Dynamics
Food Minerals Market Trend: Rising Consumer Demand for Functional and Nutrient-Rich Foods
A prominent trend in the food minerals market is the rising consumer demand for functional and nutrient-rich foods. As health-conscious consumers seek to optimize their diets and address nutritional deficiencies, there's a growing interest in foods fortified with essential minerals such as calcium, iron, zinc, and magnesium. This trend is driven by increasing awareness of the role minerals play in supporting overall health and well-being, as well as growing concerns about inadequate mineral intake due to dietary imbalances and modern food processing practices. Manufacturers are responding to consumer demand by fortifying a wide range of food and beverage products with minerals, including dairy alternatives, breakfast cereals, snacks, and beverages, to offer functional benefits and cater to evolving dietary preferences.
Market Driver: Growing Focus on Preventive Healthcare and Wellness
An essential driver fueling the food minerals market is the growing focus on preventive healthcare and wellness. With rising healthcare costs and the burden of chronic diseases such as osteoporosis, anemia, and cardiovascular disorders, there's a shift towards proactive approaches to health management through nutrition and lifestyle interventions. Minerals play a critical role in various physiological functions, including bone health, immune function, and energy metabolism, making them essential for overall health and disease prevention. This driver is further amplified by increasing consumer awareness of the importance of micronutrients in supporting optimal health outcomes and reducing the risk of nutrient deficiencies. As consumers seek out foods and beverages that offer functional benefits and nutritional value, the demand for mineral-fortified products is expected to continue growing, driving innovation and investment in the food minerals market.
Market Opportunity: Expansion into Functional Food and Nutraceutical Segments
A significant opportunity within the food minerals market lies in expansion into the functional food and nutraceutical segments. Beyond traditional applications in fortified foods and beverages, minerals have the potential to add value to a range of functional food and nutraceutical products aimed at addressing specific health concerns and supporting wellness goals. For example, calcium and magnesium can be incorporated into bone health supplements, while iron and zinc may be used in immune support formulations. Additionally, minerals such as potassium and sodium can play a role in electrolyte-replenishing sports drinks and hydration solutions. By leveraging the functional properties and health benefits of minerals, manufacturers can capitalize on the growing market for functional foods, dietary supplements, and nutraceuticals, offering consumers targeted solutions to optimize their health and well-being.
Food Minerals Market Share Analysis: Calcium held the dominant market share in 2024
In the Food Minerals Market, the Calcium segment is the largest, driven by the essential role of calcium in various physiological functions and its widespread use in food fortification and supplementation. Calcium is a vital mineral required for bone health, muscle function, and nerve transmission, making it indispensable for maintaining overall health and well-being. As calcium deficiency is prevalent worldwide, particularly among certain demographics such as children, pregnant women, and the elderly, the fortification of foods with calcium has become increasingly common. Calcium carbonate, calcium chloride, and other calcium compounds are added to a wide range of food products, including dairy alternatives, baked goods, cereals, and beverages, to enhance their nutritional content and meet dietary recommendations. Further, the growing consumer awareness of the importance of calcium in supporting bone health and preventing osteoporosis further drives the demand for calcium-fortified foods and supplements. With its critical nutritional benefits and widespread application in food manufacturing, the Calcium segment remains the largest in the Food Minerals Market.
Food Minerals Market Share Analysis: Nutraceuticals market is poised to register the fastest growth rae over the forecast period to 2032
In the Food Minerals Market, the Nutraceuticals segment is the fastest-growing, driven by the increasing consumer interest in health and wellness products and the rising demand for dietary supplements fortified with essential minerals. Nutraceuticals encompass a broad category of products that provide health benefits beyond basic nutrition, including supplements, functional foods, and beverages. Minerals such as calcium, magnesium, and zinc play crucial roles in supporting various bodily functions, and consumers are increasingly turning to nutraceuticals to meet their dietary needs and address specific health concerns. Additionally, with growing awareness of the importance of preventive healthcare and lifestyle-related diseases, there is a rising preference for natural and organic supplements containing essential minerals. Further, advancements in formulation techniques and product innovation are expanding the availability and diversity of mineral-enriched nutraceuticals, catering to a wide range of consumer preferences and health goals. With the evolving consumer landscape and the growing demand for personalized nutrition solutions, the Nutraceuticals segment in the Food Minerals Market is poised for rapid growth in the foreseeable future.
Food Minerals Market Segmentation
By Product
Zinc
-Zinc Oxide
-Zinc Sulfate
-Others
Magnesium
-Magnesium Citrate
-Magnesium Chloride
-Magnesium Oxide
-Others
Calcium
-Calcium Carbonate
-Calcium Chloride
-Others
Iron
Others
By Application
Food and Beverages
Nutraceuticals
Pharmaceuticals
Countries Analyzed
North America (US, Canada, Mexico)
Europe (Germany, UK, France, Spain, Italy, Russia, Rest of Europe)
Asia Pacific (China, India, Japan, South Korea, Australia, South East Asia, Rest of Asia)
South America (Brazil, Argentina, Rest of South America)
Middle East and Africa (Saudi Arabia, UAE, Rest of Middle East, South Africa, Egypt, Rest of Africa)
Food Minerals Companies Profiled in the Study
ABF Ingredients Ltd
Adani Pharmachem Private Ltd
Archer-Daniels-Midland Company
Balchem Corp
CalciTech Europe Ltd
Calspar India
Cargill Inc
Sigma Minerals Ltd
SPI Pharma Inc
Waitaki Bio
*- List Not Exhaustive
Chapter 1. TABLE OF CONTENTS
Chapter 2. Introduction to Food Minerals Market
2.1. Market Overview
2.2. Key Statistics and Report Highlights
2.3. Scope of the Comprehensive Study
2.3.1. Market Definition
2.3.2 Countries and Regions Covered
2.3.3 Research Objective
2.3.4 Units, Currency, and Conversions
2.3.5 Industry Value Chain
2.4. Key Market Segments
2.5. Key Companies
2.6. Study Period
Chapter 3. Strategic Analysis Review
3.1. Food Minerals Pricing Analysis and Forecast
3.2. Porter’s Five Forces
3.3. Market Ecosystem
3.4. SWOT Analysis
3.5. Regulatory Scenario
3.3. Effects of Inflation, Russia-Ukraine War, moderating economic growth, and other macroeconomic factors
Chapter 4. Competitive Landscape
4.1. Market Share Analysis
4.1.1. Global Food Minerals Market Share by Company, 2023
4.1.2. Product Offerings of Leading Food Minerals Companies
4.2. Market Entropy
4.2.1. New Product Launches in the Industry
4.2.2. Mergers, Acquisitions, Joint ventures, and Partnerships
4.3. Key Strategies and Best Practices
Chapter 5. Global Market Projections: Best, Reference, and Low Case Scenarios
5.1. Growth Analysis- Case Scenario Definitions
5.2. Low Growth Case Scenario Forecasts
5.3. Reference Growth Case Scenario Forecasts
5.4. High Growth Case Scenario Forecasts
Chapter 6. Market Dynamics
6.1. Food Minerals Market Drivers
6.2. Food Minerals Market Challenges
6.6. Food Minerals Market Opportunities
6.4. Food Minerals Market Trends
Chapter 7. Global Food Minerals Market Outlook Trends
7.1. Global Food Minerals Revenue (USD Million) and CAGR (%) by Type (2021-2032)
7.2. Global Food Minerals Revenue (USD Million) and CAGR (%) by Application (2021-2032)
7.3. Global Food Minerals Revenue (USD Million) and CAGR (%) by Product (2021-2032)
By Product
Zinc
-Zinc Oxide
-Zinc Sulfate
-Others
Magnesium
-Magnesium Citrate
-Magnesium Chloride
-Magnesium Oxide
-Others
Calcium
-Calcium Carbonate
-Calcium Chloride
-Others
Iron
Others
By Application
Food and Beverages
Nutraceuticals
Pharmaceuticals
Chapter 8. Global Food Minerals Regional Analysis and Outlook
8.1. Global Food Minerals Revenue (USD Million) By Regions (2021- 2032)
8.2. North America Food Minerals Revenue (USD Million) by Country (2021-2032)
8.2.1. United States Food Minerals Regional Analysis and Outlook
8.2.2. Canada Food Minerals Regional Analysis and Outlook
8.2.3. Mexico Food Minerals Regional Analysis and Outlook
8.3. Europe Food Minerals Revenue (USD Million), by Country (2021-2032)
8.3.1. Germany Food Minerals Regional Analysis and Outlook
8.3.2. France Food Minerals Regional Analysis and Outlook
8.3.3. United Kingdom Food Minerals Regional Analysis and Outlook
8.3.4. Spain Food Minerals Regional Analysis and Outlook
8.3.5. Italy Food Minerals Regional Analysis and Outlook
8.3.6. Russia Food Minerals Regional Analysis and Outlook
8.3.7. Rest of Europe Food Minerals Regional Analysis and Outlook
8.4. Asia Pacific Food Minerals Revenue (USD Million) by Country (2021-2032)
8.4.1. China Food Minerals Regional Analysis and Outlook
8.4.2. Japan Food Minerals Regional Analysis and Outlook
8.4.3. India Food Minerals Regional Analysis and Outlook
8.4.4. South Korea Food Minerals Regional Analysis and Outlook
8.4.5. Australia Food Minerals Regional Analysis and Outlook
8.4.6. South East Asia Food Minerals Regional Analysis and Outlook
8.4.7. Rest of Asia Pacific Food Minerals Regional Analysis and Outlook
8.5. South America Food Minerals Revenue (USD Million), by Country (2021-2032)
8.5.1. Brazil Food Minerals Regional Analysis and Outlook
8.5.2. Argentina Food Minerals Regional Analysis and Outlook
8.5.3. Rest of South America Food Minerals Regional Analysis and Outlook
8.6. Middle East and Africa Food Minerals Revenue (USD Million) by Country (2021-2032)
8.6.1. Middle East Food Minerals Regional Analysis and Outlook
8.6.2. Africa Food Minerals Regional Analysis and Outlook
Chapter 9. North America Food Minerals Analysis and Outlook
9.1. North America Food Minerals Revenue (USD Million) by Segments (2021-2032)
9.1.1. North America Food Minerals Revenue (USD Million) by Type (2021-2032)
9.1.2. North America Food Minerals Revenue (USD Million) by Application (2021-2032)
9.1.3. North America Food Minerals Revenue (USD Million) by Product (2021-2032)
By Product
Zinc
-Zinc Oxide
-Zinc Sulfate
-Others
Magnesium
-Magnesium Citrate
-Magnesium Chloride
-Magnesium Oxide
-Others
Calcium
-Calcium Carbonate
-Calcium Chloride
-Others
Iron
Others
By Application
Food and Beverages
Nutraceuticals
Pharmaceuticals
Chapter 10. Europe Food Minerals Analysis and Outlook
10.1. Europe Food Minerals Revenue (USD Million), by Segments (USD Million) (2021-2032)
10.1.1. Europe Food Minerals Revenue (USD Million) by Type (2021-2032)
10.1.2. Europe Food Minerals Revenue (USD Million) by Application (2021-2032)
10.1.3. Europe Food Minerals Revenue (USD Million) by Product (2021-2032)
By Product
Zinc
-Zinc Oxide
-Zinc Sulfate
-Others
Magnesium
-Magnesium Citrate
-Magnesium Chloride
-Magnesium Oxide
-Others
Calcium
-Calcium Carbonate
-Calcium Chloride
-Others
Iron
Others
By Application
Food and Beverages
Nutraceuticals
Pharmaceuticals
Chapter 11. Asia Pacific Food Minerals Analysis and Outlook
11.1. Asia Pacific Food Minerals Revenue (USD Million), and Revenue (USD Million) by Segments (2021-2032)
11.1.1. Asia Pacific Food Minerals Revenue (USD Million) by Type (2021-2032)
11.1.2. Asia Pacific Food Minerals Revenue (USD Million) by Application (2021-2032)
11.1.3. Asia Pacific Food Minerals Revenue (USD Million) by Product (2021-2032)
By Product
Zinc
-Zinc Oxide
-Zinc Sulfate
-Others
Magnesium
-Magnesium Citrate
-Magnesium Chloride
-Magnesium Oxide
-Others
Calcium
-Calcium Carbonate
-Calcium Chloride
-Others
Iron
Others
By Application
Food and Beverages
Nutraceuticals
Pharmaceuticals
Chapter 12. South America Food Minerals Analysis and Outlook
12.1. South America Food Minerals Revenue (USD Million), by Segments (2021-2032)
12.1.1. South America Food Minerals Revenue (USD Million) by Type (2021-2032)
12.1.2. South America Food Minerals Revenue (USD Million) by Application (2021-2032)
12.1.3. South America Food Minerals Revenue (USD Million) by Product (2021-2032)
By Product
Zinc
-Zinc Oxide
-Zinc Sulfate
-Others
Magnesium
-Magnesium Citrate
-Magnesium Chloride
-Magnesium Oxide
-Others
Calcium
-Calcium Carbonate
-Calcium Chloride
-Others
Iron
Others
By Application
Food and Beverages
Nutraceuticals
Pharmaceuticals
Chapter 13. Middle East and Africa Food Minerals Analysis and Outlook
13.1. Middle East and Africa Food Minerals Revenue (USD Million), by Segments (2021-2032)
13.1.1. Middle East and Africa Food Minerals Revenue (USD Million) by Type (2021-2032)
13.1.2. Middle East and Africa Food Minerals Revenue (USD Million) by Application (2021-2032)
13.1.3. Middle East and Africa Food Minerals Revenue (USD Million) by Product (2021-2032)
By Product
Zinc
-Zinc Oxide
-Zinc Sulfate
-Others
Magnesium
-Magnesium Citrate
-Magnesium Chloride
-Magnesium Oxide
-Others
Calcium
-Calcium Carbonate
-Calcium Chloride
-Others
Iron
Others
By Application
Food and Beverages
Nutraceuticals
Pharmaceuticals
Chapter 14. Food Minerals Company Profiles
14.1 Business Overview
14.2 Product Profiles
14.3 SWOT Profiles
14.5 Recent Developments
14.6 Financial Profile
List of Companies
ABF Ingredients Ltd
Adani Pharmachem Private Ltd
Archer-Daniels-Midland Company
Balchem Corp
CalciTech Europe Ltd
Calspar India
Cargill Inc
Sigma Minerals Ltd
SPI Pharma Inc
Waitaki Bio
15. Methodology and Data Sources
15.1 Customization Offerings
15.2 Subscription Services
15.3 Related Reports
15.4 Publisher Expertise
LIST OF TABLES
Table 1 Market Segmentation Analysis
Table 2 Global Food Minerals Market Share of Leading Companies, 2023
Table 3 Product Offerings of Leading Companies
Table 4 Low Growth Scenario Forecasts
Table 5 Reference Case Growth Scenario
Table 6 High Growth Case Scenario
Table 7 Global Food Minerals Revenue (USD Million) And CAGR (%) By Type (2021-2032)
Table 8 Global Food Minerals Revenue (USD Million) And CAGR (%) By Application (2021-2032)
Table 9 Global Food Minerals Revenue (USD Million) And CAGR (%) By Product (2021-2032)
Table 10 Global Food Minerals Market Revenue (USD Million) By Regions (2021-2032)
Table 11 Global Food Minerals Market Share (%) By Regions (2021-2032)
Table 12 North America Food Minerals Revenue (USD Million) By Country (2021-2032)
Table 13 Europe Food Minerals Revenue (USD Million) By Country (2021-2032)
Table 14 Asia Pacific Food Minerals Revenue (USD Million) By Country (2021-2032)
Table 15 South America Food Minerals Revenue (USD Million) By Country (2021-2032)
Table 16 Middle East and Africa Food Minerals Revenue (USD Million) By Region (2021-2032)
Table 17 North America Food Minerals Revenue (USD Million) By Type (2021-2032)
Table 18 North America Food Minerals Revenue (USD Million) By Application (2021-2032)
Table 19 North America Food Minerals Revenue (USD Million) By Product (2021-2032)
Table 20 Europe Food Minerals Revenue (USD Million) By Type (2021-2032)
Table 21 Europe Food Minerals Revenue (USD Million) By Application (2021-2032)
Table 22 Europe Food Minerals Revenue (USD Million) By Product (2021-2032)
Table 23 Asia Pacific Food Minerals Revenue (USD Million) By Type (2021-2032)
Table 24 Asia Pacific Food Minerals Revenue (USD Million) By Application (2021-2032)
Table 25 Asia Pacific Food Minerals Revenue (USD Million) By Product (2021-2032)
Table 26 South America Food Minerals Revenue (USD Million) By Type (2021-2032)
Table 27 South America Food Minerals Revenue (USD Million) By Application (2021-2032)
Table 28 South America Food Minerals Revenue (USD Million) By Product (2021-2032)
Table 29 Middle East and Africa Food Minerals Revenue (USD Million) By Type (2021-2032)
Table 30 Middle East and Africa Food Minerals Revenue (USD Million) By Application (2021-2032)
Table 31 Middle East and Africa Food Minerals Revenue (USD Million) By Product (2021-2032)
LIST OF FIGURES
Figure 1. Market Scope
Figure 2. Pricing Forecasts Per Unit, 2023- 2032
Figure 3. Porter’s Five Forces
Figure 4. Global Food Minerals Market Revenue (USD Million) By Regions (2021-2032)
Figure 5. Global Food Minerals Market Share (%) By Regions (2023)
Figure 6. North America Food Minerals Revenue (USD Million) By Country (2021-2032)
Figure 7. United States Food Minerals Revenue (USD Million) By Country (2021-2032)
Figure 8. Canada Food Minerals Revenue (USD Million) By Country (2021-2032)
Figure 9. Mexico Food Minerals Revenue (USD Million) By Country (2021-2032)
Figure 10. Europe Food Minerals Revenue (USD Million) By Country (2021-2032)
Figure 11. Germany Food Minerals Revenue (USD Million) By Country (2021-2032)
Figure 12. France Food Minerals Revenue (USD Million) By Country (2021-2032)
Figure 13. United Kingdom Food Minerals Revenue (USD Million) By Country (2021-2032)
Figure 14. Spain Food Minerals Revenue (USD Million) By Country (2021-2032)
Figure 15. Italy Food Minerals Revenue (USD Million) By Country (2021-2032)
Figure 16. Russia Food Minerals Revenue (USD Million) By Country (2021-2032)
Figure 17. Rest of Europe Food Minerals Revenue (USD Million) By Country (2021-2032)
Figure 11. Asia Pacific Food Minerals Revenue (USD Million) By Country (2021-2032)
Figure 12. China Food Minerals Revenue (USD Million) By Country (2021-2032)
Figure 13. Japan Food Minerals Revenue (USD Million) By Country (2021-2032)
Figure 14. India Food Minerals Revenue (USD Million) By Country (2021-2032)
Figure 15. South Korea Food Minerals Revenue (USD Million) By Country (2021-2032)
Figure 16. Australia Food Minerals Revenue (USD Million) By Country (2021-2032)
Figure 17. South East Asia Food Minerals Revenue (USD Million) By Country (2021-2032)
Figure 18. South America Food Minerals Revenue (USD Million) By Country (2021-2032)
Figure 19. Brazil Food Minerals Revenue (USD Million) By Country (2021-2032)
Figure 20. Argentina Food Minerals Revenue (USD Million) By Country (2021-2032)
Figure 21. Rest of Asia Pacific Food Minerals Revenue (USD Million) By Country (2021-2032)
Figure 22. Middle East and Africa Food Minerals Revenue (USD Million) By Region (2021-2032)
Figure 23. Saudi Arabia Food Minerals Revenue (USD Million) By Region (2021-2032)
Figure 24. The UAE Food Minerals Revenue (USD Million) By Region (2021-2032)
Figure 25. Rest of Middle East Food Minerals Revenue (USD Million) By Region (2021-2032)
Figure 26. South Africa Food Minerals Revenue (USD Million) By Region (2021-2032)
Figure 27. Africa Food Minerals Revenue (USD Million) By Region (2021-2032)
Figure 28. North America Food Minerals Revenue (USD Million) By Type (2021-2032)
Figure 29. North America Food Minerals Revenue (USD Million) By Application (2021-2032)
Figure 30. North America Food Minerals Revenue (USD Million) By Product (2021-2032)
Figure 31. Europe Food Minerals Revenue (USD Million) By Type (2021-2032)
Figure 32. Europe Food Minerals Revenue (USD Million) By Application (2021-2032)
Figure 33. Europe Food Minerals Revenue (USD Million) By Product (2021-2032)
Figure 34. Asia Pacific Food Minerals Revenue (USD Million) By Type (2021-2032)
Figure 35. Asia Pacific Food Minerals Revenue (USD Million) By Application (2021-2032)
Figure 36. Asia Pacific Food Minerals Revenue (USD Million) By Product (2021-2032)
Figure 37. South America Food Minerals Revenue (USD Million) By Type (2021-2032)
Figure 38. South America Food Minerals Revenue (USD Million) By Application (2021-2032)
Figure 39. South America Food Minerals Revenue (USD Million) By Product (2021-2032)
Figure 40. Middle East and Africa Food Minerals Revenue (USD Million) By Type (2021-2032)
Figure 41. Middle East and Africa Food Minerals Revenue (USD Million) By Application (2021-2032)
Figure 42. Middle East and Africa Food Minerals Revenue (USD Million) By Product (2021-2032)
By Product
Zinc
-Zinc Oxide
-Zinc Sulfate
-Others
Magnesium
-Magnesium Citrate
-Magnesium Chloride
-Magnesium Oxide
-Others
Calcium
-Calcium Carbonate
-Calcium Chloride
-Others
Iron
Others
By Application
Food and Beverages
Nutraceuticals
Pharmaceuticals
Countries Analyzed
North America (US, Canada, Mexico)
Europe (Germany, UK, France, Spain, Italy, Russia, Rest of Europe)
Asia Pacific (China, India, Japan, South Korea, Australia, South East Asia, Rest of Asia)
South America (Brazil, Argentina, Rest of South America)
Middle East and Africa (Saudi Arabia, UAE, Rest of Middle East, South Africa, Egypt, Rest of Africa)
