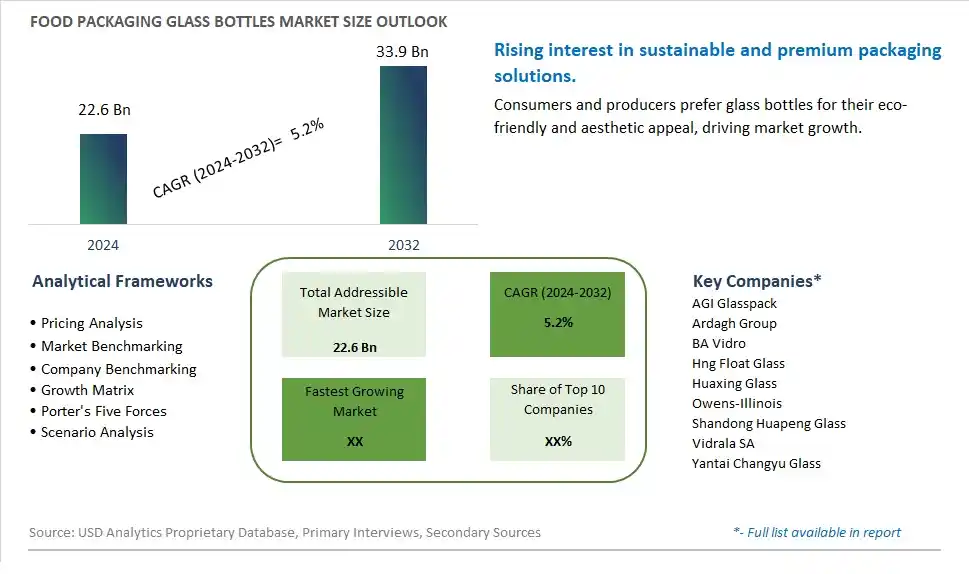
Global Food Packaging Glass Bottles Market Size is valued at $22.6 Billion in 2024 and is forecast to register a growth rate (CAGR) of 5.2% to reach $33.9 Billion by 2032.
The global Food Packaging Glass Bottles Market Comprehensive Study analyzes and forecasts the market size across 6 regions and 24 countries for diverse segments -By Type (Color, Colorless), By Application (Soy sauce, Vinegar, Sauce, Others)
An Introduction to Food Packaging Glass Bottles Market
In 2024, the Food Packaging Glass Bottles market is thriving, fueled by the rising demand for sustainable and premium packaging solutions. Glass bottles, known for their recyclability and ability to preserve the quality and taste of food and beverages, are popular among manufacturers and consumers. The market benefits from advancements in glass manufacturing technologies, the growing trend of sustainability and eco-friendly packaging, and the expansion of the premium beverage sector. Additionally, the increasing focus on reducing plastic waste is driving market growth.
Food Packaging Glass Bottles Competitive Landscape
The market report analyses the leading companies in the industry including AGI Glasspack, Ardagh Group, BA Vidro, Hng Float Glass, Huaxing Glass, Owens-Illinois, Shandong Huapeng Glass, Vidrala SA, Yantai Changyu Glass, and Others.
Food Packaging Glass Bottles Market Dynamics
Food Packaging Glass Bottles Market Trend: Rising Preference for Eco-Friendly Packaging
The most prominent trend in the Food Packaging Glass Bottles Market is the rising preference for eco-friendly packaging. As environmental concerns become more prominent, consumers and manufacturers are increasingly opting for sustainable packaging solutions. Glass bottles, being recyclable and non-toxic, align with this trend by offering a sustainable alternative to plastic packaging. This trend is driven by the desire to reduce plastic waste and promote environmental sustainability.
Food Packaging Glass Bottles Market Driver: Increase in Demand for Premium and Organic Products
The key driver of the Food Packaging Glass Bottles Market is the increase in demand for premium and organic products. As consumers become more health-conscious and willing to invest in high-quality and organic food products, there is a growing preference for packaging that reflects the premium nature of these items. Glass bottles, with their aesthetic appeal and ability to preserve product quality, are favored for packaging premium and organic foods and beverages.
Food Packaging Glass Bottles Market Opportunity: Innovation in Glass Bottle Designs
A significant opportunity in the Food Packaging Glass Bottles Market lies in innovation in glass bottle designs. By developing unique and attractive glass bottle designs that enhance brand identity and consumer appeal, companies can differentiate their products in the competitive market. Additionally, incorporating functional features, such as resealable caps and ergonomic shapes, can further enhance the consumer experience and drive demand for glass-packaged products.
Food Packaging Glass Bottles Market Share Analysis: Colorless segment generated the highest revenue share in the industry
In the Food Packaging Glass Bottles market, the Colorless type stands out as the largest segment. Colorless glass bottles are widely preferred for packaging various food products due to their versatility and aesthetic appeal. They offer excellent visibility, allowing consumers to see the contents clearly, which is particularly advantageous for products where visual presentation is important, such as premium sauces, vinegars, and specialty food items. Colorless glass also enhances product shelf life by providing superior protection against UV light, thereby maintaining the quality and freshness of the packaged food products.
Food Packaging Glass Bottles Market Share Analysis: Soy Sauce is the fastest growing segment over the forecast period to 2032
The Soy Sauce application emerges as the fastest growing segment in the Food Packaging Glass Bottles market through 2032. Soy sauce is a staple condiment in many cuisines worldwide, known for its rich umami flavor and versatile use in cooking, marinades, and dipping sauces. As consumer preferences shift towards healthier eating habits and gourmet cooking at home, the demand for high-quality soy sauce packaged in glass bottles is on the rise. Glass bottles offer several advantages for soy sauce packaging, including preserving flavor integrity, preventing contamination, and enhancing product shelf appeal on retail shelves. The combination of consumer preference for premium quality sauces and the packaging industry's focus on sustainable and aesthetically pleasing solutions is driving significant growth in the Soy Sauce application segment within the Food Packaging Glass Bottles market.
Food Packaging Glass Bottles Market Segmentation
By Type
Color
Colorless
By Application
Soy sauce
Vinegar
Sauce
Others
Countries Analyzed
North America (US, Canada, Mexico)
Europe (Germany, UK, France, Spain, Italy, Russia, Rest of Europe)
Asia Pacific (China, India, Japan, South Korea, Australia, South East Asia, Rest of Asia)
South America (Brazil, Argentina, Rest of South America)
Middle East and Africa (Saudi Arabia, UAE, Rest of Middle East, South Africa, Egypt, Rest of Africa)
Food Packaging Glass Bottles Companies Profiled in the Study
AGI Glasspack
Ardagh Group
BA Vidro
Hng Float Glass
Huaxing Glass
Owens-Illinois
Shandong Huapeng Glass
Vidrala SA
Yantai Changyu Glass
*- List Not Exhaustive
Chapter 1. TABLE OF CONTENTS
Chapter 2. Introduction to Food Packaging Glass Bottles Market
2.1. Market Overview
2.2. Key Statistics and Report Highlights
2.3. Scope of the Comprehensive Study
2.3.1. Market Definition
2.3.2 Countries and Regions Covered
2.3.3 Research Objective
2.3.4 Units, Currency, and Conversions
2.3.5 Industry Value Chain
2.4. Key Market Segments
2.5. Key Companies
2.6. Study Period
Chapter 3. Strategic Analysis Review
3.1. Food Packaging Glass Bottles Pricing Analysis and Forecast
3.2. Porter’s Five Forces
3.3. Market Ecosystem
3.4. SWOT Analysis
3.5. Regulatory Scenario
3.3. Effects of Inflation, Russia-Ukraine War, moderating economic growth, and other macroeconomic factors
Chapter 4. Competitive Landscape
4.1. Market Share Analysis
4.1.1. Global Food Packaging Glass Bottles Market Share by Company, 2023
4.1.2. Product Offerings of Leading Food Packaging Glass Bottles Companies
4.2. Market Entropy
4.2.1. New Product Launches in the Industry
4.2.2. Mergers, Acquisitions, Joint ventures, and Partnerships
4.3. Key Strategies and Best Practices
Chapter 5. Global Market Projections: Best, Reference, and Low Case Scenarios
5.1. Growth Analysis- Case Scenario Definitions
5.2. Low Growth Case Scenario Forecasts
5.3. Reference Growth Case Scenario Forecasts
5.4. High Growth Case Scenario Forecasts
Chapter 6. Market Dynamics
6.1. Food Packaging Glass Bottles Market Drivers
6.2. Food Packaging Glass Bottles Market Challenges
6.6. Food Packaging Glass Bottles Market Opportunities
6.4. Food Packaging Glass Bottles Market Trends
Chapter 7. Global Food Packaging Glass Bottles Market Outlook Trends
7.1. Global Food Packaging Glass Bottles Revenue (USD Million) and CAGR (%) by Type (2021-2032)
7.2. Global Food Packaging Glass Bottles Revenue (USD Million) and CAGR (%) by Application (2021-2032)
7.3. Global Food Packaging Glass Bottles Revenue (USD Million) and CAGR (%) by Product (2021-2032)
By Type
Color
Colorless
By Application
Soy sauce
Vinegar
Sauce
Others
Chapter 8. Global Food Packaging Glass Bottles Regional Analysis and Outlook
8.1. Global Food Packaging Glass Bottles Revenue (USD Million) By Regions (2021- 2032)
8.2. North America Food Packaging Glass Bottles Revenue (USD Million) by Country (2021-2032)
8.2.1. United States Food Packaging Glass Bottles Regional Analysis and Outlook
8.2.2. Canada Food Packaging Glass Bottles Regional Analysis and Outlook
8.2.3. Mexico Food Packaging Glass Bottles Regional Analysis and Outlook
8.3. Europe Food Packaging Glass Bottles Revenue (USD Million), by Country (2021-2032)
8.3.1. Germany Food Packaging Glass Bottles Regional Analysis and Outlook
8.3.2. France Food Packaging Glass Bottles Regional Analysis and Outlook
8.3.3. United Kingdom Food Packaging Glass Bottles Regional Analysis and Outlook
8.3.4. Spain Food Packaging Glass Bottles Regional Analysis and Outlook
8.3.5. Italy Food Packaging Glass Bottles Regional Analysis and Outlook
8.3.6. Russia Food Packaging Glass Bottles Regional Analysis and Outlook
8.3.7. Rest of Europe Food Packaging Glass Bottles Regional Analysis and Outlook
8.4. Asia Pacific Food Packaging Glass Bottles Revenue (USD Million) by Country (2021-2032)
8.4.1. China Food Packaging Glass Bottles Regional Analysis and Outlook
8.4.2. Japan Food Packaging Glass Bottles Regional Analysis and Outlook
8.4.3. India Food Packaging Glass Bottles Regional Analysis and Outlook
8.4.4. South Korea Food Packaging Glass Bottles Regional Analysis and Outlook
8.4.5. Australia Food Packaging Glass Bottles Regional Analysis and Outlook
8.4.6. South East Asia Food Packaging Glass Bottles Regional Analysis and Outlook
8.4.7. Rest of Asia Pacific Food Packaging Glass Bottles Regional Analysis and Outlook
8.5. South America Food Packaging Glass Bottles Revenue (USD Million), by Country (2021-2032)
8.5.1. Brazil Food Packaging Glass Bottles Regional Analysis and Outlook
8.5.2. Argentina Food Packaging Glass Bottles Regional Analysis and Outlook
8.5.3. Rest of South America Food Packaging Glass Bottles Regional Analysis and Outlook
8.6. Middle East and Africa Food Packaging Glass Bottles Revenue (USD Million) by Country (2021-2032)
8.6.1. Middle East Food Packaging Glass Bottles Regional Analysis and Outlook
8.6.2. Africa Food Packaging Glass Bottles Regional Analysis and Outlook
Chapter 9. North America Food Packaging Glass Bottles Analysis and Outlook
9.1. North America Food Packaging Glass Bottles Revenue (USD Million) by Segments (2021-2032)
9.1.1. North America Food Packaging Glass Bottles Revenue (USD Million) by Type (2021-2032)
9.1.2. North America Food Packaging Glass Bottles Revenue (USD Million) by Application (2021-2032)
9.1.3. North America Food Packaging Glass Bottles Revenue (USD Million) by Product (2021-2032)
By Type
Color
Colorless
By Application
Soy sauce
Vinegar
Sauce
Others
Chapter 10. Europe Food Packaging Glass Bottles Analysis and Outlook
10.1. Europe Food Packaging Glass Bottles Revenue (USD Million), by Segments (USD Million) (2021-2032)
10.1.1. Europe Food Packaging Glass Bottles Revenue (USD Million) by Type (2021-2032)
10.1.2. Europe Food Packaging Glass Bottles Revenue (USD Million) by Application (2021-2032)
10.1.3. Europe Food Packaging Glass Bottles Revenue (USD Million) by Product (2021-2032)
By Type
Color
Colorless
By Application
Soy sauce
Vinegar
Sauce
Others
Chapter 11. Asia Pacific Food Packaging Glass Bottles Analysis and Outlook
11.1. Asia Pacific Food Packaging Glass Bottles Revenue (USD Million), and Revenue (USD Million) by Segments (2021-2032)
11.1.1. Asia Pacific Food Packaging Glass Bottles Revenue (USD Million) by Type (2021-2032)
11.1.2. Asia Pacific Food Packaging Glass Bottles Revenue (USD Million) by Application (2021-2032)
11.1.3. Asia Pacific Food Packaging Glass Bottles Revenue (USD Million) by Product (2021-2032)
By Type
Color
Colorless
By Application
Soy sauce
Vinegar
Sauce
Others
Chapter 12. South America Food Packaging Glass Bottles Analysis and Outlook
12.1. South America Food Packaging Glass Bottles Revenue (USD Million), by Segments (2021-2032)
12.1.1. South America Food Packaging Glass Bottles Revenue (USD Million) by Type (2021-2032)
12.1.2. South America Food Packaging Glass Bottles Revenue (USD Million) by Application (2021-2032)
12.1.3. South America Food Packaging Glass Bottles Revenue (USD Million) by Product (2021-2032)
By Type
Color
Colorless
By Application
Soy sauce
Vinegar
Sauce
Others
Chapter 13. Middle East and Africa Food Packaging Glass Bottles Analysis and Outlook
13.1. Middle East and Africa Food Packaging Glass Bottles Revenue (USD Million), by Segments (2021-2032)
13.1.1. Middle East and Africa Food Packaging Glass Bottles Revenue (USD Million) by Type (2021-2032)
13.1.2. Middle East and Africa Food Packaging Glass Bottles Revenue (USD Million) by Application (2021-2032)
13.1.3. Middle East and Africa Food Packaging Glass Bottles Revenue (USD Million) by Product (2021-2032)
By Type
Color
Colorless
By Application
Soy sauce
Vinegar
Sauce
Others
Chapter 14. Food Packaging Glass Bottles Company Profiles
14.1 Business Overview
14.2 Product Profiles
14.3 SWOT Profiles
14.5 Recent Developments
14.6 Financial Profile
List of Companies
AGI Glasspack
Ardagh Group
BA Vidro
Hng Float Glass
Huaxing Glass
Owens-Illinois
Shandong Huapeng Glass
Vidrala SA
Yantai Changyu Glass
15. Methodology and Data Sources
15.1 Customization Offerings
15.2 Subscription Services
15.3 Related Reports
15.4 Publisher Expertise
LIST OF TABLES
Table 1 Market Segmentation Analysis
Table 2 Global Food Packaging Glass Bottles Market Share of Leading Companies, 2023
Table 3 Product Offerings of Leading Companies
Table 4 Low Growth Scenario Forecasts
Table 5 Reference Case Growth Scenario
Table 6 High Growth Case Scenario
Table 7 Global Food Packaging Glass Bottles Revenue (USD Million) And CAGR (%) By Type (2021-2032)
Table 8 Global Food Packaging Glass Bottles Revenue (USD Million) And CAGR (%) By Application (2021-2032)
Table 9 Global Food Packaging Glass Bottles Revenue (USD Million) And CAGR (%) By Product (2021-2032)
Table 10 Global Food Packaging Glass Bottles Market Revenue (USD Million) By Regions (2021-2032)
Table 11 Global Food Packaging Glass Bottles Market Share (%) By Regions (2021-2032)
Table 12 North America Food Packaging Glass Bottles Revenue (USD Million) By Country (2021-2032)
Table 13 Europe Food Packaging Glass Bottles Revenue (USD Million) By Country (2021-2032)
Table 14 Asia Pacific Food Packaging Glass Bottles Revenue (USD Million) By Country (2021-2032)
Table 15 South America Food Packaging Glass Bottles Revenue (USD Million) By Country (2021-2032)
Table 16 Middle East and Africa Food Packaging Glass Bottles Revenue (USD Million) By Region (2021-2032)
Table 17 North America Food Packaging Glass Bottles Revenue (USD Million) By Type (2021-2032)
Table 18 North America Food Packaging Glass Bottles Revenue (USD Million) By Application (2021-2032)
Table 19 North America Food Packaging Glass Bottles Revenue (USD Million) By Product (2021-2032)
Table 20 Europe Food Packaging Glass Bottles Revenue (USD Million) By Type (2021-2032)
Table 21 Europe Food Packaging Glass Bottles Revenue (USD Million) By Application (2021-2032)
Table 22 Europe Food Packaging Glass Bottles Revenue (USD Million) By Product (2021-2032)
Table 23 Asia Pacific Food Packaging Glass Bottles Revenue (USD Million) By Type (2021-2032)
Table 24 Asia Pacific Food Packaging Glass Bottles Revenue (USD Million) By Application (2021-2032)
Table 25 Asia Pacific Food Packaging Glass Bottles Revenue (USD Million) By Product (2021-2032)
Table 26 South America Food Packaging Glass Bottles Revenue (USD Million) By Type (2021-2032)
Table 27 South America Food Packaging Glass Bottles Revenue (USD Million) By Application (2021-2032)
Table 28 South America Food Packaging Glass Bottles Revenue (USD Million) By Product (2021-2032)
Table 29 Middle East and Africa Food Packaging Glass Bottles Revenue (USD Million) By Type (2021-2032)
Table 30 Middle East and Africa Food Packaging Glass Bottles Revenue (USD Million) By Application (2021-2032)
Table 31 Middle East and Africa Food Packaging Glass Bottles Revenue (USD Million) By Product (2021-2032)
LIST OF FIGURES
Figure 1. Market Scope
Figure 2. Pricing Forecasts Per Unit, 2023- 2032
Figure 3. Porter’s Five Forces
Figure 4. Global Food Packaging Glass Bottles Market Revenue (USD Million) By Regions (2021-2032)
Figure 5. Global Food Packaging Glass Bottles Market Share (%) By Regions (2023)
Figure 6. North America Food Packaging Glass Bottles Revenue (USD Million) By Country (2021-2032)
Figure 7. United States Food Packaging Glass Bottles Revenue (USD Million) By Country (2021-2032)
Figure 8. Canada Food Packaging Glass Bottles Revenue (USD Million) By Country (2021-2032)
Figure 9. Mexico Food Packaging Glass Bottles Revenue (USD Million) By Country (2021-2032)
Figure 10. Europe Food Packaging Glass Bottles Revenue (USD Million) By Country (2021-2032)
Figure 11. Germany Food Packaging Glass Bottles Revenue (USD Million) By Country (2021-2032)
Figure 12. France Food Packaging Glass Bottles Revenue (USD Million) By Country (2021-2032)
Figure 13. United Kingdom Food Packaging Glass Bottles Revenue (USD Million) By Country (2021-2032)
Figure 14. Spain Food Packaging Glass Bottles Revenue (USD Million) By Country (2021-2032)
Figure 15. Italy Food Packaging Glass Bottles Revenue (USD Million) By Country (2021-2032)
Figure 16. Russia Food Packaging Glass Bottles Revenue (USD Million) By Country (2021-2032)
Figure 17. Rest of Europe Food Packaging Glass Bottles Revenue (USD Million) By Country (2021-2032)
Figure 11. Asia Pacific Food Packaging Glass Bottles Revenue (USD Million) By Country (2021-2032)
Figure 12. China Food Packaging Glass Bottles Revenue (USD Million) By Country (2021-2032)
Figure 13. Japan Food Packaging Glass Bottles Revenue (USD Million) By Country (2021-2032)
Figure 14. India Food Packaging Glass Bottles Revenue (USD Million) By Country (2021-2032)
Figure 15. South Korea Food Packaging Glass Bottles Revenue (USD Million) By Country (2021-2032)
Figure 16. Australia Food Packaging Glass Bottles Revenue (USD Million) By Country (2021-2032)
Figure 17. South East Asia Food Packaging Glass Bottles Revenue (USD Million) By Country (2021-2032)
Figure 18. South America Food Packaging Glass Bottles Revenue (USD Million) By Country (2021-2032)
Figure 19. Brazil Food Packaging Glass Bottles Revenue (USD Million) By Country (2021-2032)
Figure 20. Argentina Food Packaging Glass Bottles Revenue (USD Million) By Country (2021-2032)
Figure 21. Rest of Asia Pacific Food Packaging Glass Bottles Revenue (USD Million) By Country (2021-2032)
Figure 22. Middle East and Africa Food Packaging Glass Bottles Revenue (USD Million) By Region (2021-2032)
Figure 23. Saudi Arabia Food Packaging Glass Bottles Revenue (USD Million) By Region (2021-2032)
Figure 24. The UAE Food Packaging Glass Bottles Revenue (USD Million) By Region (2021-2032)
Figure 25. Rest of Middle East Food Packaging Glass Bottles Revenue (USD Million) By Region (2021-2032)
Figure 26. South Africa Food Packaging Glass Bottles Revenue (USD Million) By Region (2021-2032)
Figure 27. Africa Food Packaging Glass Bottles Revenue (USD Million) By Region (2021-2032)
Figure 28. North America Food Packaging Glass Bottles Revenue (USD Million) By Type (2021-2032)
Figure 29. North America Food Packaging Glass Bottles Revenue (USD Million) By Application (2021-2032)
Figure 30. North America Food Packaging Glass Bottles Revenue (USD Million) By Product (2021-2032)
Figure 31. Europe Food Packaging Glass Bottles Revenue (USD Million) By Type (2021-2032)
Figure 32. Europe Food Packaging Glass Bottles Revenue (USD Million) By Application (2021-2032)
Figure 33. Europe Food Packaging Glass Bottles Revenue (USD Million) By Product (2021-2032)
Figure 34. Asia Pacific Food Packaging Glass Bottles Revenue (USD Million) By Type (2021-2032)
Figure 35. Asia Pacific Food Packaging Glass Bottles Revenue (USD Million) By Application (2021-2032)
Figure 36. Asia Pacific Food Packaging Glass Bottles Revenue (USD Million) By Product (2021-2032)
Figure 37. South America Food Packaging Glass Bottles Revenue (USD Million) By Type (2021-2032)
Figure 38. South America Food Packaging Glass Bottles Revenue (USD Million) By Application (2021-2032)
Figure 39. South America Food Packaging Glass Bottles Revenue (USD Million) By Product (2021-2032)
Figure 40. Middle East and Africa Food Packaging Glass Bottles Revenue (USD Million) By Type (2021-2032)
Figure 41. Middle East and Africa Food Packaging Glass Bottles Revenue (USD Million) By Application (2021-2032)
Figure 42. Middle East and Africa Food Packaging Glass Bottles Revenue (USD Million) By Product (2021-2032)
By Type
Color
Colorless
By Application
Soy sauce
Vinegar
Sauce
Others
Countries Analyzed
North America (US, Canada, Mexico)
Europe (Germany, UK, France, Spain, Italy, Russia, Rest of Europe)
Asia Pacific (China, India, Japan, South Korea, Australia, South East Asia, Rest of Asia)
South America (Brazil, Argentina, Rest of South America)
Middle East and Africa (Saudi Arabia, UAE, Rest of Middle East, South Africa, Egypt, Rest of Africa)
