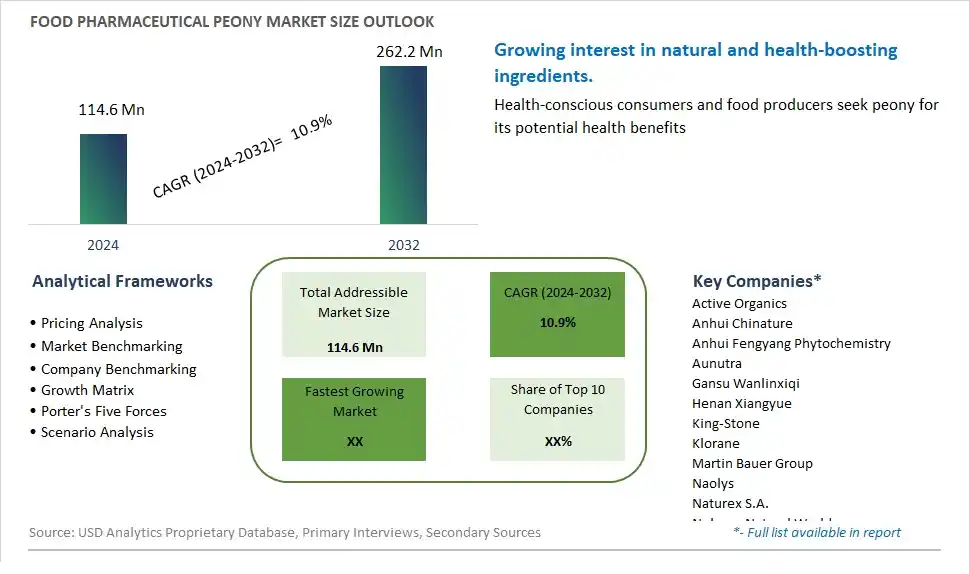
Global Food Pharmaceutical Peony Market Size is valued at $114.6 Million in 2024 and is forecast to register a growth rate (CAGR) of 10.9% to reach $262.2 Million by 2032.
The global Food Pharmaceutical Peony Market Comprehensive Study analyzes and forecasts the market size across 6 regions and 24 countries for diverse segments -By Type (Paeonia Ostii, Paeonia Rockii), By Application (Food industry, Pharmaceutical industry)
An Introduction to Food Pharmaceutical Peony Market
The Food Pharmaceutical Peony market in 2024 is witnessing robust growth, driven by the increasing demand for natural and herbal ingredients in food and pharmaceutical products. Peony extracts, known for their medicinal properties, are used in various applications, including dietary supplements, functional foods, and traditional medicine. The market benefits from advancements in extraction and formulation technologies, the growing trend of natural and holistic health remedies, and the expansion of the nutraceutical and functional food sectors. Additionally, the rising awareness of the health benefits of peony is contributing to market growth.
Food Pharmaceutical Peony Competitive Landscape
The market report analyses the leading companies in the industry including Active Organics, Anhui Chinature, Anhui Fengyang Phytochemistry, Aunutra, Gansu Wanlinxiqi, Henan Xiangyue, King-Stone, Klorane, Martin Bauer Group, Naolys, Naturex S.A., Nelsons Natural World, Novoherb, Nutra Green, Peony Love, Pioneer Herb, Ruipu mudan, Weizhen Guose Agriculture, Xi'an Changyue Phytochemistry, Xi'an Shenyuan, and Others.
Food Pharmaceutical Peony Market Dynamics
Food Pharmaceutical Peony Market Trend: Growing Interest in Botanical Ingredients
The most prominent trend in the Food Pharmaceutical Peony Market is the growing interest in botanical ingredients. As consumers seek natural and plant-based solutions for health and wellness, there is an increasing demand for ingredients like peony, known for its medicinal and therapeutic properties. This trend is driven by the shift towards holistic and natural health products that offer multiple benefits beyond basic nutrition.
Food Pharmaceutical Peony Market Driver: Rising Awareness of Health Benefits
The key driver of the Food Pharmaceutical Peony Market is the rising awareness of the health benefits associated with peony. Known for its anti-inflammatory, antioxidant, and immune-boosting properties, peony is gaining popularity as a functional ingredient in dietary supplements, herbal teas, and health foods. This growing awareness is driving consumer interest and demand for peony-based products.
Food Pharmaceutical Peony Market Opportunity: Development of Functional Food and Beverage Applications
A significant opportunity in the Food Pharmaceutical Peony Market lies in the development of functional food and beverage applications. By incorporating peony into a variety of products, such as energy drinks, fortified waters, and functional snacks, companies can cater to the health-conscious consumer market. Offering innovative and convenient ways to consume peony can help attract a broader audience and drive market growth.
Food Pharmaceutical Peony Market Share Analysis: Paeonia Ostii segment generated the highest revenue share in the industry
In the Food Pharmaceutical Peony market, Paeonia Ostii emerges as the largest segment. Known for its medicinal properties and ornamental value, Paeonia Ostii is a species of peony highly valued in traditional Chinese medicine (TCM) and increasingly recognized in Western herbal medicine. It is favored for its robust growth and the high concentration of active compounds beneficial for health applications. Paeonia Ostii is cultivated extensively for its roots and flowers, which are used in various pharmaceutical and nutraceutical formulations due to their anti-inflammatory, antioxidant, and immune-boosting properties. The demand for Paeonia Ostii in the food pharmaceutical sector is driven by its rich bioactive content, making it a versatile ingredient in dietary supplements, herbal teas, and functional foods aimed at promoting overall health and well-being.
Food Pharmaceutical Peony Market Share Analysis: Pharmaceutical Industry is the fastest growing segment over the forecast period to 2032
The Pharmaceutical industry application segment is poised for the fastest growth in the Food Pharmaceutical Peony market up to 2032. As pharmaceutical research continues to explore natural remedies and botanical extracts for therapeutic purposes, peony species like Paeonia Ostii are gaining traction for their potential health benefits. The Pharmaceutical industry values Paeonia Ostii for its bioactive compounds, which show promise in treating various ailments such as inflammation-related disorders, cardiovascular diseases, and even neurodegenerative conditions. Further, the growing consumer preference for natural and plant-based remedies further propels the demand for peony-derived pharmaceutical products. This trend underscores a shift towards integrating traditional herbal knowledge with modern pharmaceutical advancements, driving significant growth opportunities in the Pharmaceutical industry segment of the Food Pharmaceutical Peony market.
Food Pharmaceutical Peony Market Share Analysis: Dairy segment generated the highest revenue share in the industry
In the Food Phosphate market, the Dairy application emerges as the largest segment. Phosphates play a crucial role in the dairy industry, particularly in enhancing texture, improving water retention, and stabilizing pH levels in dairy products. Calcium phosphates, for instance, are commonly used in cheese production to aid in curd formation and to prevent coagulation issues. Phosphates also contribute to the texture and creaminess of yogurt and other dairy desserts. Their ability to improve product consistency and shelf-life makes phosphates indispensable in dairy processing, catering to both industrial-scale and artisanal dairy producers worldwide.
Food Pharmaceutical Peony Market Share Analysis: Ammonium Phosphate is the fastest growing segment over the forecast period to 2032
Among the types of phosphates in the Food Phosphate market, Ammonium Phosphate stands out as the fastest growing to 2032. Ammonium phosphates are widely used in food processing, particularly in baking applications, as leavening agents. They react with baking soda to release carbon dioxide gas, which helps dough rise and gives baked goods their light and fluffy texture. The increasing demand for convenience foods and baked products globally is driving the growth of Ammonium Phosphate usage in food processing. Further, its versatility in various food applications, coupled with its cost-effectiveness and regulatory approval for use in food products, positions Ammonium Phosphate as a pivotal ingredient in the food phosphate segment. As consumer preferences shift towards bakery products and ready-to-eat meals, the demand for Ammonium Phosphate is expected to continue its upward trajectory, reflecting robust growth opportunities in the Food Phosphate market.
Food Pharmaceutical Peony Market Segmentation
By Type
Paeonia Ostii
Paeonia Rockii
By Application
Food industry
Pharmaceutical industry
Countries Analyzed
North America (US, Canada, Mexico)
Europe (Germany, UK, France, Spain, Italy, Russia, Rest of Europe)
Asia Pacific (China, India, Japan, South Korea, Australia, South East Asia, Rest of Asia)
South America (Brazil, Argentina, Rest of South America)
Middle East and Africa (Saudi Arabia, UAE, Rest of Middle East, South Africa, Egypt, Rest of Africa)
Food Pharmaceutical Peony Companies Profiled in the Study
Active Organics
Anhui Chinature
Anhui Fengyang Phytochemistry
Aunutra
Gansu Wanlinxiqi
Henan Xiangyue
King-Stone
Klorane
Martin Bauer Group
Naolys
Naturex S.A.
Nelsons Natural World
Novoherb
Nutra Green
Peony Love
Pioneer Herb
Ruipu mudan
Weizhen Guose Agriculture
Xi'an Changyue Phytochemistry
Xi'an Shenyuan
*- List Not Exhaustive
Chapter 1. TABLE OF CONTENTS
Chapter 2. Introduction to Food Pharmaceutical Peony Market
2.1. Market Overview
2.2. Key Statistics and Report Highlights
2.3. Scope of the Comprehensive Study
2.3.1. Market Definition
2.3.2 Countries and Regions Covered
2.3.3 Research Objective
2.3.4 Units, Currency, and Conversions
2.3.5 Industry Value Chain
2.4. Key Market Segments
2.5. Key Companies
2.6. Study Period
Chapter 3. Strategic Analysis Review
3.1. Food Pharmaceutical Peony Pricing Analysis and Forecast
3.2. Porter’s Five Forces
3.3. Market Ecosystem
3.4. SWOT Analysis
3.5. Regulatory Scenario
3.3. Effects of Inflation, Russia-Ukraine War, moderating economic growth, and other macroeconomic factors
Chapter 4. Competitive Landscape
4.1. Market Share Analysis
4.1.1. Global Food Pharmaceutical Peony Market Share by Company, 2023
4.1.2. Product Offerings of Leading Food Pharmaceutical Peony Companies
4.2. Market Entropy
4.2.1. New Product Launches in the Industry
4.2.2. Mergers, Acquisitions, Joint ventures, and Partnerships
4.3. Key Strategies and Best Practices
Chapter 5. Global Market Projections: Best, Reference, and Low Case Scenarios
5.1. Growth Analysis- Case Scenario Definitions
5.2. Low Growth Case Scenario Forecasts
5.3. Reference Growth Case Scenario Forecasts
5.4. High Growth Case Scenario Forecasts
Chapter 6. Market Dynamics
6.1. Food Pharmaceutical Peony Market Drivers
6.2. Food Pharmaceutical Peony Market Challenges
6.6. Food Pharmaceutical Peony Market Opportunities
6.4. Food Pharmaceutical Peony Market Trends
Chapter 7. Global Food Pharmaceutical Peony Market Outlook Trends
7.1. Global Food Pharmaceutical Peony Revenue (USD Million) and CAGR (%) by Type (2021-2032)
7.2. Global Food Pharmaceutical Peony Revenue (USD Million) and CAGR (%) by Application (2021-2032)
7.3. Global Food Pharmaceutical Peony Revenue (USD Million) and CAGR (%) by Product (2021-2032)
By Type
Paeonia Ostii
Paeonia Rockii
By Application
Food industry
Pharmaceutical industry
Chapter 8. Global Food Pharmaceutical Peony Regional Analysis and Outlook
8.1. Global Food Pharmaceutical Peony Revenue (USD Million) By Regions (2021- 2032)
8.2. North America Food Pharmaceutical Peony Revenue (USD Million) by Country (2021-2032)
8.2.1. United States Food Pharmaceutical Peony Regional Analysis and Outlook
8.2.2. Canada Food Pharmaceutical Peony Regional Analysis and Outlook
8.2.3. Mexico Food Pharmaceutical Peony Regional Analysis and Outlook
8.3. Europe Food Pharmaceutical Peony Revenue (USD Million), by Country (2021-2032)
8.3.1. Germany Food Pharmaceutical Peony Regional Analysis and Outlook
8.3.2. France Food Pharmaceutical Peony Regional Analysis and Outlook
8.3.3. United Kingdom Food Pharmaceutical Peony Regional Analysis and Outlook
8.3.4. Spain Food Pharmaceutical Peony Regional Analysis and Outlook
8.3.5. Italy Food Pharmaceutical Peony Regional Analysis and Outlook
8.3.6. Russia Food Pharmaceutical Peony Regional Analysis and Outlook
8.3.7. Rest of Europe Food Pharmaceutical Peony Regional Analysis and Outlook
8.4. Asia Pacific Food Pharmaceutical Peony Revenue (USD Million) by Country (2021-2032)
8.4.1. China Food Pharmaceutical Peony Regional Analysis and Outlook
8.4.2. Japan Food Pharmaceutical Peony Regional Analysis and Outlook
8.4.3. India Food Pharmaceutical Peony Regional Analysis and Outlook
8.4.4. South Korea Food Pharmaceutical Peony Regional Analysis and Outlook
8.4.5. Australia Food Pharmaceutical Peony Regional Analysis and Outlook
8.4.6. South East Asia Food Pharmaceutical Peony Regional Analysis and Outlook
8.4.7. Rest of Asia Pacific Food Pharmaceutical Peony Regional Analysis and Outlook
8.5. South America Food Pharmaceutical Peony Revenue (USD Million), by Country (2021-2032)
8.5.1. Brazil Food Pharmaceutical Peony Regional Analysis and Outlook
8.5.2. Argentina Food Pharmaceutical Peony Regional Analysis and Outlook
8.5.3. Rest of South America Food Pharmaceutical Peony Regional Analysis and Outlook
8.6. Middle East and Africa Food Pharmaceutical Peony Revenue (USD Million) by Country (2021-2032)
8.6.1. Middle East Food Pharmaceutical Peony Regional Analysis and Outlook
8.6.2. Africa Food Pharmaceutical Peony Regional Analysis and Outlook
Chapter 9. North America Food Pharmaceutical Peony Analysis and Outlook
9.1. North America Food Pharmaceutical Peony Revenue (USD Million) by Segments (2021-2032)
9.1.1. North America Food Pharmaceutical Peony Revenue (USD Million) by Type (2021-2032)
9.1.2. North America Food Pharmaceutical Peony Revenue (USD Million) by Application (2021-2032)
9.1.3. North America Food Pharmaceutical Peony Revenue (USD Million) by Product (2021-2032)
By Type
Paeonia Ostii
Paeonia Rockii
By Application
Food industry
Pharmaceutical industry
Chapter 10. Europe Food Pharmaceutical Peony Analysis and Outlook
10.1. Europe Food Pharmaceutical Peony Revenue (USD Million), by Segments (USD Million) (2021-2032)
10.1.1. Europe Food Pharmaceutical Peony Revenue (USD Million) by Type (2021-2032)
10.1.2. Europe Food Pharmaceutical Peony Revenue (USD Million) by Application (2021-2032)
10.1.3. Europe Food Pharmaceutical Peony Revenue (USD Million) by Product (2021-2032)
By Type
Paeonia Ostii
Paeonia Rockii
By Application
Food industry
Pharmaceutical industry
Chapter 11. Asia Pacific Food Pharmaceutical Peony Analysis and Outlook
11.1. Asia Pacific Food Pharmaceutical Peony Revenue (USD Million), and Revenue (USD Million) by Segments (2021-2032)
11.1.1. Asia Pacific Food Pharmaceutical Peony Revenue (USD Million) by Type (2021-2032)
11.1.2. Asia Pacific Food Pharmaceutical Peony Revenue (USD Million) by Application (2021-2032)
11.1.3. Asia Pacific Food Pharmaceutical Peony Revenue (USD Million) by Product (2021-2032)
By Type
Paeonia Ostii
Paeonia Rockii
By Application
Food industry
Pharmaceutical industry
Chapter 12. South America Food Pharmaceutical Peony Analysis and Outlook
12.1. South America Food Pharmaceutical Peony Revenue (USD Million), by Segments (2021-2032)
12.1.1. South America Food Pharmaceutical Peony Revenue (USD Million) by Type (2021-2032)
12.1.2. South America Food Pharmaceutical Peony Revenue (USD Million) by Application (2021-2032)
12.1.3. South America Food Pharmaceutical Peony Revenue (USD Million) by Product (2021-2032)
By Type
Paeonia Ostii
Paeonia Rockii
By Application
Food industry
Pharmaceutical industry
Chapter 13. Middle East and Africa Food Pharmaceutical Peony Analysis and Outlook
13.1. Middle East and Africa Food Pharmaceutical Peony Revenue (USD Million), by Segments (2021-2032)
13.1.1. Middle East and Africa Food Pharmaceutical Peony Revenue (USD Million) by Type (2021-2032)
13.1.2. Middle East and Africa Food Pharmaceutical Peony Revenue (USD Million) by Application (2021-2032)
13.1.3. Middle East and Africa Food Pharmaceutical Peony Revenue (USD Million) by Product (2021-2032)
By Type
Paeonia Ostii
Paeonia Rockii
By Application
Food industry
Pharmaceutical industry
Chapter 14. Food Pharmaceutical Peony Company Profiles
14.1 Business Overview
14.2 Product Profiles
14.3 SWOT Profiles
14.5 Recent Developments
14.6 Financial Profile
List of Companies
Active Organics
Anhui Chinature
Anhui Fengyang Phytochemistry
Aunutra
Gansu Wanlinxiqi
Henan Xiangyue
King-Stone
Klorane
Martin Bauer Group
Naolys
Naturex S.A.
Nelsons Natural World
Novoherb
Nutra Green
Peony Love
Pioneer Herb
Ruipu mudan
Weizhen Guose Agriculture
Xi'an Changyue Phytochemistry
Xi'an Shenyuan
15. Methodology and Data Sources
15.1 Customization Offerings
15.2 Subscription Services
15.3 Related Reports
15.4 Publisher Expertise
LIST OF TABLES
Table 1 Market Segmentation Analysis
Table 2 Global Food Pharmaceutical Peony Market Share of Leading Companies, 2023
Table 3 Product Offerings of Leading Companies
Table 4 Low Growth Scenario Forecasts
Table 5 Reference Case Growth Scenario
Table 6 High Growth Case Scenario
Table 7 Global Food Pharmaceutical Peony Revenue (USD Million) And CAGR (%) By Type (2021-2032)
Table 8 Global Food Pharmaceutical Peony Revenue (USD Million) And CAGR (%) By Application (2021-2032)
Table 9 Global Food Pharmaceutical Peony Revenue (USD Million) And CAGR (%) By Product (2021-2032)
Table 10 Global Food Pharmaceutical Peony Market Revenue (USD Million) By Regions (2021-2032)
Table 11 Global Food Pharmaceutical Peony Market Share (%) By Regions (2021-2032)
Table 12 North America Food Pharmaceutical Peony Revenue (USD Million) By Country (2021-2032)
Table 13 Europe Food Pharmaceutical Peony Revenue (USD Million) By Country (2021-2032)
Table 14 Asia Pacific Food Pharmaceutical Peony Revenue (USD Million) By Country (2021-2032)
Table 15 South America Food Pharmaceutical Peony Revenue (USD Million) By Country (2021-2032)
Table 16 Middle East and Africa Food Pharmaceutical Peony Revenue (USD Million) By Region (2021-2032)
Table 17 North America Food Pharmaceutical Peony Revenue (USD Million) By Type (2021-2032)
Table 18 North America Food Pharmaceutical Peony Revenue (USD Million) By Application (2021-2032)
Table 19 North America Food Pharmaceutical Peony Revenue (USD Million) By Product (2021-2032)
Table 20 Europe Food Pharmaceutical Peony Revenue (USD Million) By Type (2021-2032)
Table 21 Europe Food Pharmaceutical Peony Revenue (USD Million) By Application (2021-2032)
Table 22 Europe Food Pharmaceutical Peony Revenue (USD Million) By Product (2021-2032)
Table 23 Asia Pacific Food Pharmaceutical Peony Revenue (USD Million) By Type (2021-2032)
Table 24 Asia Pacific Food Pharmaceutical Peony Revenue (USD Million) By Application (2021-2032)
Table 25 Asia Pacific Food Pharmaceutical Peony Revenue (USD Million) By Product (2021-2032)
Table 26 South America Food Pharmaceutical Peony Revenue (USD Million) By Type (2021-2032)
Table 27 South America Food Pharmaceutical Peony Revenue (USD Million) By Application (2021-2032)
Table 28 South America Food Pharmaceutical Peony Revenue (USD Million) By Product (2021-2032)
Table 29 Middle East and Africa Food Pharmaceutical Peony Revenue (USD Million) By Type (2021-2032)
Table 30 Middle East and Africa Food Pharmaceutical Peony Revenue (USD Million) By Application (2021-2032)
Table 31 Middle East and Africa Food Pharmaceutical Peony Revenue (USD Million) By Product (2021-2032)
LIST OF FIGURES
Figure 1. Market Scope
Figure 2. Pricing Forecasts Per Unit, 2023- 2032
Figure 3. Porter’s Five Forces
Figure 4. Global Food Pharmaceutical Peony Market Revenue (USD Million) By Regions (2021-2032)
Figure 5. Global Food Pharmaceutical Peony Market Share (%) By Regions (2023)
Figure 6. North America Food Pharmaceutical Peony Revenue (USD Million) By Country (2021-2032)
Figure 7. United States Food Pharmaceutical Peony Revenue (USD Million) By Country (2021-2032)
Figure 8. Canada Food Pharmaceutical Peony Revenue (USD Million) By Country (2021-2032)
Figure 9. Mexico Food Pharmaceutical Peony Revenue (USD Million) By Country (2021-2032)
Figure 10. Europe Food Pharmaceutical Peony Revenue (USD Million) By Country (2021-2032)
Figure 11. Germany Food Pharmaceutical Peony Revenue (USD Million) By Country (2021-2032)
Figure 12. France Food Pharmaceutical Peony Revenue (USD Million) By Country (2021-2032)
Figure 13. United Kingdom Food Pharmaceutical Peony Revenue (USD Million) By Country (2021-2032)
Figure 14. Spain Food Pharmaceutical Peony Revenue (USD Million) By Country (2021-2032)
Figure 15. Italy Food Pharmaceutical Peony Revenue (USD Million) By Country (2021-2032)
Figure 16. Russia Food Pharmaceutical Peony Revenue (USD Million) By Country (2021-2032)
Figure 17. Rest of Europe Food Pharmaceutical Peony Revenue (USD Million) By Country (2021-2032)
Figure 11. Asia Pacific Food Pharmaceutical Peony Revenue (USD Million) By Country (2021-2032)
Figure 12. China Food Pharmaceutical Peony Revenue (USD Million) By Country (2021-2032)
Figure 13. Japan Food Pharmaceutical Peony Revenue (USD Million) By Country (2021-2032)
Figure 14. India Food Pharmaceutical Peony Revenue (USD Million) By Country (2021-2032)
Figure 15. South Korea Food Pharmaceutical Peony Revenue (USD Million) By Country (2021-2032)
Figure 16. Australia Food Pharmaceutical Peony Revenue (USD Million) By Country (2021-2032)
Figure 17. South East Asia Food Pharmaceutical Peony Revenue (USD Million) By Country (2021-2032)
Figure 18. South America Food Pharmaceutical Peony Revenue (USD Million) By Country (2021-2032)
Figure 19. Brazil Food Pharmaceutical Peony Revenue (USD Million) By Country (2021-2032)
Figure 20. Argentina Food Pharmaceutical Peony Revenue (USD Million) By Country (2021-2032)
Figure 21. Rest of Asia Pacific Food Pharmaceutical Peony Revenue (USD Million) By Country (2021-2032)
Figure 22. Middle East and Africa Food Pharmaceutical Peony Revenue (USD Million) By Region (2021-2032)
Figure 23. Saudi Arabia Food Pharmaceutical Peony Revenue (USD Million) By Region (2021-2032)
Figure 24. The UAE Food Pharmaceutical Peony Revenue (USD Million) By Region (2021-2032)
Figure 25. Rest of Middle East Food Pharmaceutical Peony Revenue (USD Million) By Region (2021-2032)
Figure 26. South Africa Food Pharmaceutical Peony Revenue (USD Million) By Region (2021-2032)
Figure 27. Africa Food Pharmaceutical Peony Revenue (USD Million) By Region (2021-2032)
Figure 28. North America Food Pharmaceutical Peony Revenue (USD Million) By Type (2021-2032)
Figure 29. North America Food Pharmaceutical Peony Revenue (USD Million) By Application (2021-2032)
Figure 30. North America Food Pharmaceutical Peony Revenue (USD Million) By Product (2021-2032)
Figure 31. Europe Food Pharmaceutical Peony Revenue (USD Million) By Type (2021-2032)
Figure 32. Europe Food Pharmaceutical Peony Revenue (USD Million) By Application (2021-2032)
Figure 33. Europe Food Pharmaceutical Peony Revenue (USD Million) By Product (2021-2032)
Figure 34. Asia Pacific Food Pharmaceutical Peony Revenue (USD Million) By Type (2021-2032)
Figure 35. Asia Pacific Food Pharmaceutical Peony Revenue (USD Million) By Application (2021-2032)
Figure 36. Asia Pacific Food Pharmaceutical Peony Revenue (USD Million) By Product (2021-2032)
Figure 37. South America Food Pharmaceutical Peony Revenue (USD Million) By Type (2021-2032)
Figure 38. South America Food Pharmaceutical Peony Revenue (USD Million) By Application (2021-2032)
Figure 39. South America Food Pharmaceutical Peony Revenue (USD Million) By Product (2021-2032)
Figure 40. Middle East and Africa Food Pharmaceutical Peony Revenue (USD Million) By Type (2021-2032)
Figure 41. Middle East and Africa Food Pharmaceutical Peony Revenue (USD Million) By Application (2021-2032)
Figure 42. Middle East and Africa Food Pharmaceutical Peony Revenue (USD Million) By Product (2021-2032)
By Type
Paeonia Ostii
Paeonia Rockii
By Application
Food industry
Pharmaceutical industry
Countries Analyzed
North America (US, Canada, Mexico)
Europe (Germany, UK, France, Spain, Italy, Russia, Rest of Europe)
Asia Pacific (China, India, Japan, South Korea, Australia, South East Asia, Rest of Asia)
South America (Brazil, Argentina, Rest of South America)
Middle East and Africa (Saudi Arabia, UAE, Rest of Middle East, South Africa, Egypt, Rest of Africa)
