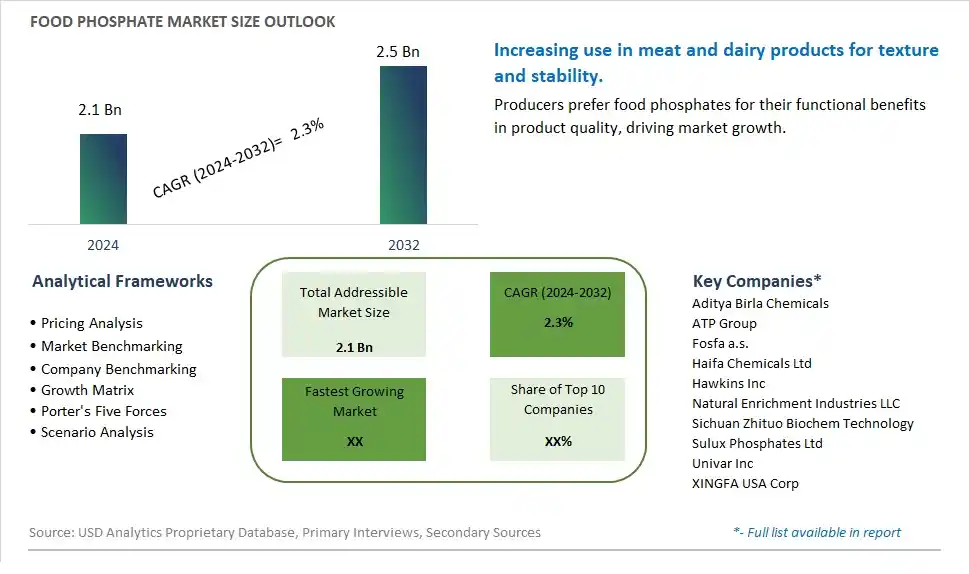
Global Food Phosphate Market Size is valued at $2.1 Billion in 2024 and is forecast to register a growth rate (CAGR) of 2.3% to reach $2.5 Billion by 2032.
The global Food Phosphate Market Comprehensive Study analyzes and forecasts the market size across 6 regions and 24 countries for diverse segments -By Application (Dairy, Bakery Products, Meat & Seafood Processing, Beverages), By Type (Ammonium Phosphate, Sodium Phosphate, Potassium Phosphate, Calcium Phosphate, Others)
An Introduction to Food Phosphate Market
The Food Phosphate market in 2024 is experiencing significant growth, driven by the increasing demand for phosphates as essential additives in food processing. Food phosphates are used as leavening agents, emulsifiers, and stabilizers in various food applications, including bakery, dairy, and meat products. The market benefits from advancements in phosphate production and application technologies, the growing trend of convenience and processed foods, and the expansion of the global food processing sector. Additionally, the rising focus on food quality and safety is contributing to market growth.
Food Phosphate Competitive Landscape
The market report analyses the leading companies in the industry including Aditya Birla Chemicals, ATP Group, Fosfa a.s., Haifa Chemicals Ltd, Hawkins Inc, Natural Enrichment Industries LLC, Sichuan Zhituo Biochem Technology, Sulux Phosphates Ltd, Univar Inc, XINGFA USA Corp, and Others.
Food Phosphate Market Dynamics
Food Phosphate Market Trend: Increasing Use in Processed and Convenience Foods
The most prominent trend in the Food Phosphate Market is the increasing use of phosphates in processed and convenience foods. Phosphates are essential ingredients in various food applications, such as improving texture, maintaining moisture, and enhancing flavor. This trend is driven by the growing consumption of ready-to-eat and convenience foods, which require effective additives to ensure product quality and shelf life.
Food Phosphate Market Driver: Growth in the Food Processing Industry
The key driver of the Food Phosphate Market is the growth in the food processing industry. As urbanization and busy lifestyles lead to higher demand for processed foods, there is a corresponding increase in the need for food phosphates that enhance the functionality and stability of these products. Phosphates play a crucial role in the manufacturing of processed meats, dairy products, and baked goods, driving their demand in the industry.
Food Phosphate Market Opportunity: Innovation in Phosphate-Free Alternatives
A significant opportunity in the Food Phosphate Market lies in innovation in phosphate-free alternatives. As consumers become more health-conscious and seek to reduce phosphate intake due to potential health concerns, there is potential for developing alternative ingredients that offer similar benefits without the use of phosphates. By investing in research and development to create these alternatives, companies can meet consumer demand for healthier and safer food products while maintaining product performance.
Food Phosphate Market Share Analysis- Largest Segment by Application
The Meat & Seafood Processing segment is the largest in the Food Phosphate Market by application. This dominance is driven by the extensive use of food phosphates as essential additives in meat and seafood processing to improve texture, retain moisture, and enhance flavor. Phosphates play a crucial role in preventing spoilage and extending the shelf life of processed meat and seafood products, which is critical for ensuring food safety and quality. The high demand for processed meat and seafood products, such as sausages, deli meats, and seafood snacks, supports the significant market share of this segment. Additionally, the continuous innovation in phosphate formulations and the development of new processing techniques enhance the performance and effectiveness of phosphates in meat and seafood applications. The strong consumer demand for convenient and ready-to-eat meat and seafood products, coupled with the growing emphasis on food safety and quality standards, reinforces the dominant position of the meat and seafood processing segment in the food phosphate market.
Food Phosphate Market Share Analysis- Fastest Growing Segment by Type
The Sodium Phosphate segment is poised to grow the fastest in the Food Phosphate Market by type over the next five years. This rapid growth is driven by the versatile applications of sodium phosphate in various food products, including dairy, bakery, and meat processing. Sodium phosphates are widely used as emulsifiers, stabilizers, and leavening agents, making them essential in the production of processed foods. The increasing demand for convenience foods and the growing trend of clean-label products support the adoption of sodium phosphate due to its multifunctional properties and effectiveness. Additionally, the continuous innovation in sodium phosphate formulations, including those catering to specific dietary needs such as reduced sodium content, further drives the growth of this segment. The expanding processed food industry, coupled with the rising consumer preference for high-quality and safe food products, contributes to the fast growth of the sodium phosphate segment.
Food Phosphate Market Segmentation
By Application
Dairy
Bakery Products
Meat & Seafood Processing
Beverages
By Type
Ammonium Phosphate
Sodium Phosphate
Potassium Phosphate
Calcium Phosphate
Others
Countries Analyzed
North America (US, Canada, Mexico)
Europe (Germany, UK, France, Spain, Italy, Russia, Rest of Europe)
Asia Pacific (China, India, Japan, South Korea, Australia, South East Asia, Rest of Asia)
South America (Brazil, Argentina, Rest of South America)
Middle East and Africa (Saudi Arabia, UAE, Rest of Middle East, South Africa, Egypt, Rest of Africa)
Food Phosphate Companies Profiled in the Study
Aditya Birla Chemicals
ATP Group
Fosfa a.s.
Haifa Chemicals Ltd
Hawkins Inc
Natural Enrichment Industries LLC
Sichuan Zhituo Biochem Technology
Sulux Phosphates Ltd
Univar Inc
XINGFA USA Corp
*- List Not Exhaustive
Chapter 1. TABLE OF CONTENTS
Chapter 2. Introduction to Food Phosphate Market
2.1. Market Overview
2.2. Key Statistics and Report Highlights
2.3. Scope of the Comprehensive Study
2.3.1. Market Definition
2.3.2 Countries and Regions Covered
2.3.3 Research Objective
2.3.4 Units, Currency, and Conversions
2.3.5 Industry Value Chain
2.4. Key Market Segments
2.5. Key Companies
2.6. Study Period
Chapter 3. Strategic Analysis Review
3.1. Food Phosphate Pricing Analysis and Forecast
3.2. Porter’s Five Forces
3.3. Market Ecosystem
3.4. SWOT Analysis
3.5. Regulatory Scenario
3.3. Effects of Inflation, Russia-Ukraine War, moderating economic growth, and other macroeconomic factors
Chapter 4. Competitive Landscape
4.1. Market Share Analysis
4.1.1. Global Food Phosphate Market Share by Company, 2023
4.1.2. Product Offerings of Leading Food Phosphate Companies
4.2. Market Entropy
4.2.1. New Product Launches in the Industry
4.2.2. Mergers, Acquisitions, Joint ventures, and Partnerships
4.3. Key Strategies and Best Practices
Chapter 5. Global Market Projections: Best, Reference, and Low Case Scenarios
5.1. Growth Analysis- Case Scenario Definitions
5.2. Low Growth Case Scenario Forecasts
5.3. Reference Growth Case Scenario Forecasts
5.4. High Growth Case Scenario Forecasts
Chapter 6. Market Dynamics
6.1. Food Phosphate Market Drivers
6.2. Food Phosphate Market Challenges
6.6. Food Phosphate Market Opportunities
6.4. Food Phosphate Market Trends
Chapter 7. Global Food Phosphate Market Outlook Trends
7.1. Global Food Phosphate Revenue (USD Million) and CAGR (%) by Type (2021-2032)
7.2. Global Food Phosphate Revenue (USD Million) and CAGR (%) by Application (2021-2032)
7.3. Global Food Phosphate Revenue (USD Million) and CAGR (%) by Product (2021-2032)
By Application
Dairy
Bakery Products
Meat & Seafood Processing
Beverages
By Type
Ammonium Phosphate
Sodium Phosphate
Potassium Phosphate
Calcium Phosphate
Others
Chapter 8. Global Food Phosphate Regional Analysis and Outlook
8.1. Global Food Phosphate Revenue (USD Million) By Regions (2021- 2032)
8.2. North America Food Phosphate Revenue (USD Million) by Country (2021-2032)
8.2.1. United States Food Phosphate Regional Analysis and Outlook
8.2.2. Canada Food Phosphate Regional Analysis and Outlook
8.2.3. Mexico Food Phosphate Regional Analysis and Outlook
8.3. Europe Food Phosphate Revenue (USD Million), by Country (2021-2032)
8.3.1. Germany Food Phosphate Regional Analysis and Outlook
8.3.2. France Food Phosphate Regional Analysis and Outlook
8.3.3. United Kingdom Food Phosphate Regional Analysis and Outlook
8.3.4. Spain Food Phosphate Regional Analysis and Outlook
8.3.5. Italy Food Phosphate Regional Analysis and Outlook
8.3.6. Russia Food Phosphate Regional Analysis and Outlook
8.3.7. Rest of Europe Food Phosphate Regional Analysis and Outlook
8.4. Asia Pacific Food Phosphate Revenue (USD Million) by Country (2021-2032)
8.4.1. China Food Phosphate Regional Analysis and Outlook
8.4.2. Japan Food Phosphate Regional Analysis and Outlook
8.4.3. India Food Phosphate Regional Analysis and Outlook
8.4.4. South Korea Food Phosphate Regional Analysis and Outlook
8.4.5. Australia Food Phosphate Regional Analysis and Outlook
8.4.6. South East Asia Food Phosphate Regional Analysis and Outlook
8.4.7. Rest of Asia Pacific Food Phosphate Regional Analysis and Outlook
8.5. South America Food Phosphate Revenue (USD Million), by Country (2021-2032)
8.5.1. Brazil Food Phosphate Regional Analysis and Outlook
8.5.2. Argentina Food Phosphate Regional Analysis and Outlook
8.5.3. Rest of South America Food Phosphate Regional Analysis and Outlook
8.6. Middle East and Africa Food Phosphate Revenue (USD Million) by Country (2021-2032)
8.6.1. Middle East Food Phosphate Regional Analysis and Outlook
8.6.2. Africa Food Phosphate Regional Analysis and Outlook
Chapter 9. North America Food Phosphate Analysis and Outlook
9.1. North America Food Phosphate Revenue (USD Million) by Segments (2021-2032)
9.1.1. North America Food Phosphate Revenue (USD Million) by Type (2021-2032)
9.1.2. North America Food Phosphate Revenue (USD Million) by Application (2021-2032)
9.1.3. North America Food Phosphate Revenue (USD Million) by Product (2021-2032)
By Application
Dairy
Bakery Products
Meat & Seafood Processing
Beverages
By Type
Ammonium Phosphate
Sodium Phosphate
Potassium Phosphate
Calcium Phosphate
Others
Chapter 10. Europe Food Phosphate Analysis and Outlook
10.1. Europe Food Phosphate Revenue (USD Million), by Segments (USD Million) (2021-2032)
10.1.1. Europe Food Phosphate Revenue (USD Million) by Type (2021-2032)
10.1.2. Europe Food Phosphate Revenue (USD Million) by Application (2021-2032)
10.1.3. Europe Food Phosphate Revenue (USD Million) by Product (2021-2032)
By Application
Dairy
Bakery Products
Meat & Seafood Processing
Beverages
By Type
Ammonium Phosphate
Sodium Phosphate
Potassium Phosphate
Calcium Phosphate
Others
Chapter 11. Asia Pacific Food Phosphate Analysis and Outlook
11.1. Asia Pacific Food Phosphate Revenue (USD Million), and Revenue (USD Million) by Segments (2021-2032)
11.1.1. Asia Pacific Food Phosphate Revenue (USD Million) by Type (2021-2032)
11.1.2. Asia Pacific Food Phosphate Revenue (USD Million) by Application (2021-2032)
11.1.3. Asia Pacific Food Phosphate Revenue (USD Million) by Product (2021-2032)
By Application
Dairy
Bakery Products
Meat & Seafood Processing
Beverages
By Type
Ammonium Phosphate
Sodium Phosphate
Potassium Phosphate
Calcium Phosphate
Others
Chapter 12. South America Food Phosphate Analysis and Outlook
12.1. South America Food Phosphate Revenue (USD Million), by Segments (2021-2032)
12.1.1. South America Food Phosphate Revenue (USD Million) by Type (2021-2032)
12.1.2. South America Food Phosphate Revenue (USD Million) by Application (2021-2032)
12.1.3. South America Food Phosphate Revenue (USD Million) by Product (2021-2032)
By Application
Dairy
Bakery Products
Meat & Seafood Processing
Beverages
By Type
Ammonium Phosphate
Sodium Phosphate
Potassium Phosphate
Calcium Phosphate
Others
Chapter 13. Middle East and Africa Food Phosphate Analysis and Outlook
13.1. Middle East and Africa Food Phosphate Revenue (USD Million), by Segments (2021-2032)
13.1.1. Middle East and Africa Food Phosphate Revenue (USD Million) by Type (2021-2032)
13.1.2. Middle East and Africa Food Phosphate Revenue (USD Million) by Application (2021-2032)
13.1.3. Middle East and Africa Food Phosphate Revenue (USD Million) by Product (2021-2032)
By Application
Dairy
Bakery Products
Meat & Seafood Processing
Beverages
By Type
Ammonium Phosphate
Sodium Phosphate
Potassium Phosphate
Calcium Phosphate
Others
Chapter 14. Food Phosphate Company Profiles
14.1 Business Overview
14.2 Product Profiles
14.3 SWOT Profiles
14.5 Recent Developments
14.6 Financial Profile
List of Companies
Aditya Birla Chemicals
ATP Group
Fosfa a.s.
Haifa Chemicals Ltd
Hawkins Inc
Natural Enrichment Industries LLC
Sichuan Zhituo Biochem Technology
Sulux Phosphates Ltd
Univar Inc
XINGFA USA Corp
15. Methodology and Data Sources
15.1 Customization Offerings
15.2 Subscription Services
15.3 Related Reports
15.4 Publisher Expertise
LIST OF TABLES
Table 1 Market Segmentation Analysis
Table 2 Global Food Phosphate Market Share of Leading Companies, 2023
Table 3 Product Offerings of Leading Companies
Table 4 Low Growth Scenario Forecasts
Table 5 Reference Case Growth Scenario
Table 6 High Growth Case Scenario
Table 7 Global Food Phosphate Revenue (USD Million) And CAGR (%) By Type (2021-2032)
Table 8 Global Food Phosphate Revenue (USD Million) And CAGR (%) By Application (2021-2032)
Table 9 Global Food Phosphate Revenue (USD Million) And CAGR (%) By Product (2021-2032)
Table 10 Global Food Phosphate Market Revenue (USD Million) By Regions (2021-2032)
Table 11 Global Food Phosphate Market Share (%) By Regions (2021-2032)
Table 12 North America Food Phosphate Revenue (USD Million) By Country (2021-2032)
Table 13 Europe Food Phosphate Revenue (USD Million) By Country (2021-2032)
Table 14 Asia Pacific Food Phosphate Revenue (USD Million) By Country (2021-2032)
Table 15 South America Food Phosphate Revenue (USD Million) By Country (2021-2032)
Table 16 Middle East and Africa Food Phosphate Revenue (USD Million) By Region (2021-2032)
Table 17 North America Food Phosphate Revenue (USD Million) By Type (2021-2032)
Table 18 North America Food Phosphate Revenue (USD Million) By Application (2021-2032)
Table 19 North America Food Phosphate Revenue (USD Million) By Product (2021-2032)
Table 20 Europe Food Phosphate Revenue (USD Million) By Type (2021-2032)
Table 21 Europe Food Phosphate Revenue (USD Million) By Application (2021-2032)
Table 22 Europe Food Phosphate Revenue (USD Million) By Product (2021-2032)
Table 23 Asia Pacific Food Phosphate Revenue (USD Million) By Type (2021-2032)
Table 24 Asia Pacific Food Phosphate Revenue (USD Million) By Application (2021-2032)
Table 25 Asia Pacific Food Phosphate Revenue (USD Million) By Product (2021-2032)
Table 26 South America Food Phosphate Revenue (USD Million) By Type (2021-2032)
Table 27 South America Food Phosphate Revenue (USD Million) By Application (2021-2032)
Table 28 South America Food Phosphate Revenue (USD Million) By Product (2021-2032)
Table 29 Middle East and Africa Food Phosphate Revenue (USD Million) By Type (2021-2032)
Table 30 Middle East and Africa Food Phosphate Revenue (USD Million) By Application (2021-2032)
Table 31 Middle East and Africa Food Phosphate Revenue (USD Million) By Product (2021-2032)
LIST OF FIGURES
Figure 1. Market Scope
Figure 2. Pricing Forecasts Per Unit, 2023- 2032
Figure 3. Porter’s Five Forces
Figure 4. Global Food Phosphate Market Revenue (USD Million) By Regions (2021-2032)
Figure 5. Global Food Phosphate Market Share (%) By Regions (2023)
Figure 6. North America Food Phosphate Revenue (USD Million) By Country (2021-2032)
Figure 7. United States Food Phosphate Revenue (USD Million) By Country (2021-2032)
Figure 8. Canada Food Phosphate Revenue (USD Million) By Country (2021-2032)
Figure 9. Mexico Food Phosphate Revenue (USD Million) By Country (2021-2032)
Figure 10. Europe Food Phosphate Revenue (USD Million) By Country (2021-2032)
Figure 11. Germany Food Phosphate Revenue (USD Million) By Country (2021-2032)
Figure 12. France Food Phosphate Revenue (USD Million) By Country (2021-2032)
Figure 13. United Kingdom Food Phosphate Revenue (USD Million) By Country (2021-2032)
Figure 14. Spain Food Phosphate Revenue (USD Million) By Country (2021-2032)
Figure 15. Italy Food Phosphate Revenue (USD Million) By Country (2021-2032)
Figure 16. Russia Food Phosphate Revenue (USD Million) By Country (2021-2032)
Figure 17. Rest of Europe Food Phosphate Revenue (USD Million) By Country (2021-2032)
Figure 11. Asia Pacific Food Phosphate Revenue (USD Million) By Country (2021-2032)
Figure 12. China Food Phosphate Revenue (USD Million) By Country (2021-2032)
Figure 13. Japan Food Phosphate Revenue (USD Million) By Country (2021-2032)
Figure 14. India Food Phosphate Revenue (USD Million) By Country (2021-2032)
Figure 15. South Korea Food Phosphate Revenue (USD Million) By Country (2021-2032)
Figure 16. Australia Food Phosphate Revenue (USD Million) By Country (2021-2032)
Figure 17. South East Asia Food Phosphate Revenue (USD Million) By Country (2021-2032)
Figure 18. South America Food Phosphate Revenue (USD Million) By Country (2021-2032)
Figure 19. Brazil Food Phosphate Revenue (USD Million) By Country (2021-2032)
Figure 20. Argentina Food Phosphate Revenue (USD Million) By Country (2021-2032)
Figure 21. Rest of Asia Pacific Food Phosphate Revenue (USD Million) By Country (2021-2032)
Figure 22. Middle East and Africa Food Phosphate Revenue (USD Million) By Region (2021-2032)
Figure 23. Saudi Arabia Food Phosphate Revenue (USD Million) By Region (2021-2032)
Figure 24. The UAE Food Phosphate Revenue (USD Million) By Region (2021-2032)
Figure 25. Rest of Middle East Food Phosphate Revenue (USD Million) By Region (2021-2032)
Figure 26. South Africa Food Phosphate Revenue (USD Million) By Region (2021-2032)
Figure 27. Africa Food Phosphate Revenue (USD Million) By Region (2021-2032)
Figure 28. North America Food Phosphate Revenue (USD Million) By Type (2021-2032)
Figure 29. North America Food Phosphate Revenue (USD Million) By Application (2021-2032)
Figure 30. North America Food Phosphate Revenue (USD Million) By Product (2021-2032)
Figure 31. Europe Food Phosphate Revenue (USD Million) By Type (2021-2032)
Figure 32. Europe Food Phosphate Revenue (USD Million) By Application (2021-2032)
Figure 33. Europe Food Phosphate Revenue (USD Million) By Product (2021-2032)
Figure 34. Asia Pacific Food Phosphate Revenue (USD Million) By Type (2021-2032)
Figure 35. Asia Pacific Food Phosphate Revenue (USD Million) By Application (2021-2032)
Figure 36. Asia Pacific Food Phosphate Revenue (USD Million) By Product (2021-2032)
Figure 37. South America Food Phosphate Revenue (USD Million) By Type (2021-2032)
Figure 38. South America Food Phosphate Revenue (USD Million) By Application (2021-2032)
Figure 39. South America Food Phosphate Revenue (USD Million) By Product (2021-2032)
Figure 40. Middle East and Africa Food Phosphate Revenue (USD Million) By Type (2021-2032)
Figure 41. Middle East and Africa Food Phosphate Revenue (USD Million) By Application (2021-2032)
Figure 42. Middle East and Africa Food Phosphate Revenue (USD Million) By Product (2021-2032)
By Application
Dairy
Bakery Products
Meat & Seafood Processing
Beverages
By Type
Ammonium Phosphate
Sodium Phosphate
Potassium Phosphate
Calcium Phosphate
Others
Countries Analyzed
North America (US, Canada, Mexico)
Europe (Germany, UK, France, Spain, Italy, Russia, Rest of Europe)
Asia Pacific (China, India, Japan, South Korea, Australia, South East Asia, Rest of Asia)
South America (Brazil, Argentina, Rest of South America)
Middle East and Africa (Saudi Arabia, UAE, Rest of Middle East, South Africa, Egypt, Rest of Africa)
