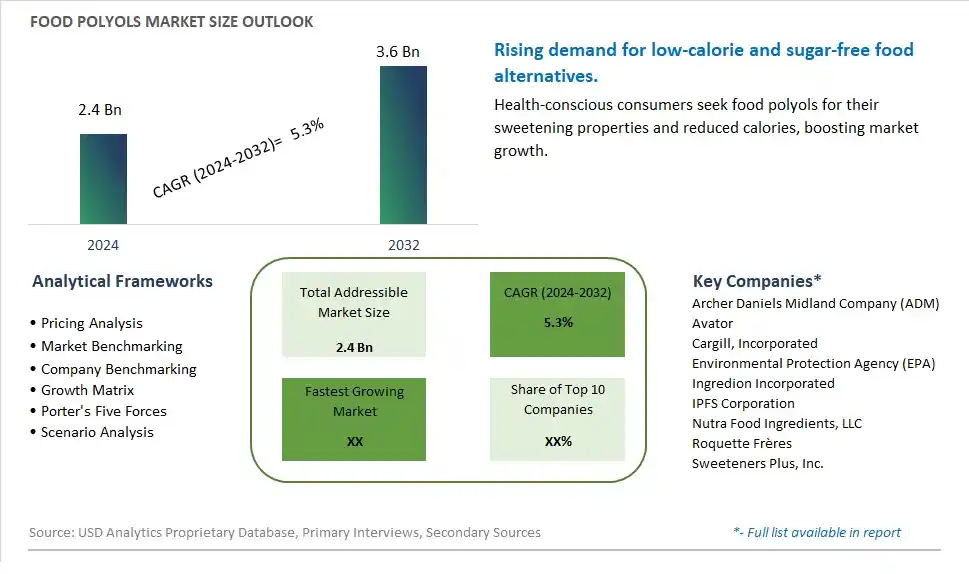
Global Food Polyols Market Size is valued at $2.4 Billion in 2024 and is forecast to register a growth rate (CAGR) of 5.3% to reach $3.6 Billion by 2032.
The global Food Polyols Market Comprehensive Study analyzes and forecasts the market size across 6 regions and 24 countries for diverse segments -By Type (From Vegetables, From Fruits, From Fermentation Product), By Application (Food, Beverage)
An Introduction to Food Polyols Market
In 2024, the Food Polyols market is thriving, fueled by the rising demand for sugar alternatives in food and beverage products. Polyols, such as sorbitol, mannitol, and xylitol, are used as low-calorie sweeteners and humectants in various applications. The market benefits from advancements in polyol production and formulation technologies, the growing trend of health-conscious and diabetic-friendly products, and the expansion of the functional and specialty food sectors. Additionally, the increasing awareness of the benefits of polyols for dental health and weight management is driving market growth.
Food Polyols Competitive Landscape
The market report analyses the leading companies in the industry including Archer Daniels Midland Company (ADM), Avator, Cargill, Incorporated, Environmental Protection Agency (EPA), Ingredion Incorporated, IPFS Corporation, Nutra Food Ingredients, LLC, Roquette Frères, Sweeteners Plus, Inc., and Others.
Food Polyols Market Dynamics
Food Polyols Market Trend: Rising Demand for Sugar Substitutes
The most prominent trend in the Food Polyols Market is the rising demand for sugar substitutes. As consumers become more health-conscious and seek to reduce sugar intake, polyols, such as erythritol, sorbitol, and xylitol, are gaining popularity as low-calorie sweeteners. This trend is driven by the increasing prevalence of diabetes, obesity, and other lifestyle-related health issues, which are prompting consumers to opt for healthier alternatives to sugar.
Food Polyols Market Driver: Increase in Functional and Low-Calorie Foods
The key driver of the Food Polyols Market is the increase in demand for functional and low-calorie foods. As more consumers focus on managing their weight and improving their overall health, there is a higher demand for foods and beverages that offer health benefits without compromising on taste. Polyols, with their low-calorie content and functional properties, are widely used in the production of sugar-free, reduced-calorie, and functional food products, driving their market growth.
Food Polyols Market Opportunity: Expansion into Natural Polyol Products
A significant opportunity in the Food Polyols Market lies in the expansion into natural polyol products. As consumer preferences shift towards natural and clean label ingredients, there is potential for developing polyols derived from natural sources. By offering natural polyols that align with clean label trends, companies can attract health-conscious consumers and differentiate their products in the competitive market for sugar substitutes.
Food Polyols Market Share Analysis: Food segment generated the highest revenue share in the industry
In the Food Polyols market, the Food application stands out as the largest segment. Polyols, also known as sugar alcohols, are widely used as sweeteners and bulking agents in various food products. They provide sweetness without the same caloric impact as sugar and are often used in sugar-free and reduced-sugar formulations. Polyols from vegetables, fruits, and fermentation products offer different profiles of sweetness and functional properties, making them suitable for a wide range of food applications. They are commonly found in products such as chewing gum, confectionery, baked goods, dairy products, and beverages. Their ability to provide bulk, texture, and sweetness makes them indispensable in food manufacturing, catering to consumer demand for healthier and lower-calorie alternatives in the food industry.
Food Polyols Market Share Analysis: Beverage is the fastest growing segment over the forecast period to 2032
Among the applications of Polyols in the Food Polyols market, Beverages emerge as the fastest growing to 2032. Polyols are increasingly being used in beverages as sugar substitutes to reduce calorie content and improve the nutritional profile of drinks. Beverages such as soft drinks, flavored water, sports drinks, and ready-to-drink teas benefit from the sweetness and functional properties of polyols. Consumers are increasingly opting for beverages that offer sweetness without the negative health effects associated with sugar consumption, driving the demand for Polyols in this segment. Additionally, technological advancements in formulation and flavor masking have expanded the use of Polyols in a broader range of beverage applications, supporting their rapid growth in the Food Polyols market over the forecast period.
Food Polyols Market Segmentation
By Type
From Vegetables
From Fruits
From Fermentation Product
By Application
Food
Beverage
Countries Analyzed
North America (US, Canada, Mexico)
Europe (Germany, UK, France, Spain, Italy, Russia, Rest of Europe)
Asia Pacific (China, India, Japan, South Korea, Australia, South East Asia, Rest of Asia)
South America (Brazil, Argentina, Rest of South America)
Middle East and Africa (Saudi Arabia, UAE, Rest of Middle East, South Africa, Egypt, Rest of Africa)
Food Polyols Companies Profiled in the Study
Archer Daniels Midland Company (ADM)
Avator
Cargill, Incorporated
Environmental Protection Agency (EPA)
Ingredion Incorporated
IPFS Corporation
Nutra Food Ingredients, LLC
Roquette Frères
Sweeteners Plus, Inc.
*- List Not Exhaustive
Chapter 1. TABLE OF CONTENTS
Chapter 2. Introduction to Food Polyols Market
2.1. Market Overview
2.2. Key Statistics and Report Highlights
2.3. Scope of the Comprehensive Study
2.3.1. Market Definition
2.3.2 Countries and Regions Covered
2.3.3 Research Objective
2.3.4 Units, Currency, and Conversions
2.3.5 Industry Value Chain
2.4. Key Market Segments
2.5. Key Companies
2.6. Study Period
Chapter 3. Strategic Analysis Review
3.1. Food Polyols Pricing Analysis and Forecast
3.2. Porter’s Five Forces
3.3. Market Ecosystem
3.4. SWOT Analysis
3.5. Regulatory Scenario
3.3. Effects of Inflation, Russia-Ukraine War, moderating economic growth, and other macroeconomic factors
Chapter 4. Competitive Landscape
4.1. Market Share Analysis
4.1.1. Global Food Polyols Market Share by Company, 2023
4.1.2. Product Offerings of Leading Food Polyols Companies
4.2. Market Entropy
4.2.1. New Product Launches in the Industry
4.2.2. Mergers, Acquisitions, Joint ventures, and Partnerships
4.3. Key Strategies and Best Practices
Chapter 5. Global Market Projections: Best, Reference, and Low Case Scenarios
5.1. Growth Analysis- Case Scenario Definitions
5.2. Low Growth Case Scenario Forecasts
5.3. Reference Growth Case Scenario Forecasts
5.4. High Growth Case Scenario Forecasts
Chapter 6. Market Dynamics
6.1. Food Polyols Market Drivers
6.2. Food Polyols Market Challenges
6.6. Food Polyols Market Opportunities
6.4. Food Polyols Market Trends
Chapter 7. Global Food Polyols Market Outlook Trends
7.1. Global Food Polyols Revenue (USD Million) and CAGR (%) by Type (2021-2032)
7.2. Global Food Polyols Revenue (USD Million) and CAGR (%) by Application (2021-2032)
7.3. Global Food Polyols Revenue (USD Million) and CAGR (%) by Product (2021-2032)
By Type
From Vegetables
From Fruits
From Fermentation Product
By Application
Food
Beverage
Chapter 8. Global Food Polyols Regional Analysis and Outlook
8.1. Global Food Polyols Revenue (USD Million) By Regions (2021- 2032)
8.2. North America Food Polyols Revenue (USD Million) by Country (2021-2032)
8.2.1. United States Food Polyols Regional Analysis and Outlook
8.2.2. Canada Food Polyols Regional Analysis and Outlook
8.2.3. Mexico Food Polyols Regional Analysis and Outlook
8.3. Europe Food Polyols Revenue (USD Million), by Country (2021-2032)
8.3.1. Germany Food Polyols Regional Analysis and Outlook
8.3.2. France Food Polyols Regional Analysis and Outlook
8.3.3. United Kingdom Food Polyols Regional Analysis and Outlook
8.3.4. Spain Food Polyols Regional Analysis and Outlook
8.3.5. Italy Food Polyols Regional Analysis and Outlook
8.3.6. Russia Food Polyols Regional Analysis and Outlook
8.3.7. Rest of Europe Food Polyols Regional Analysis and Outlook
8.4. Asia Pacific Food Polyols Revenue (USD Million) by Country (2021-2032)
8.4.1. China Food Polyols Regional Analysis and Outlook
8.4.2. Japan Food Polyols Regional Analysis and Outlook
8.4.3. India Food Polyols Regional Analysis and Outlook
8.4.4. South Korea Food Polyols Regional Analysis and Outlook
8.4.5. Australia Food Polyols Regional Analysis and Outlook
8.4.6. South East Asia Food Polyols Regional Analysis and Outlook
8.4.7. Rest of Asia Pacific Food Polyols Regional Analysis and Outlook
8.5. South America Food Polyols Revenue (USD Million), by Country (2021-2032)
8.5.1. Brazil Food Polyols Regional Analysis and Outlook
8.5.2. Argentina Food Polyols Regional Analysis and Outlook
8.5.3. Rest of South America Food Polyols Regional Analysis and Outlook
8.6. Middle East and Africa Food Polyols Revenue (USD Million) by Country (2021-2032)
8.6.1. Middle East Food Polyols Regional Analysis and Outlook
8.6.2. Africa Food Polyols Regional Analysis and Outlook
Chapter 9. North America Food Polyols Analysis and Outlook
9.1. North America Food Polyols Revenue (USD Million) by Segments (2021-2032)
9.1.1. North America Food Polyols Revenue (USD Million) by Type (2021-2032)
9.1.2. North America Food Polyols Revenue (USD Million) by Application (2021-2032)
9.1.3. North America Food Polyols Revenue (USD Million) by Product (2021-2032)
By Type
From Vegetables
From Fruits
From Fermentation Product
By Application
Food
Beverage
Chapter 10. Europe Food Polyols Analysis and Outlook
10.1. Europe Food Polyols Revenue (USD Million), by Segments (USD Million) (2021-2032)
10.1.1. Europe Food Polyols Revenue (USD Million) by Type (2021-2032)
10.1.2. Europe Food Polyols Revenue (USD Million) by Application (2021-2032)
10.1.3. Europe Food Polyols Revenue (USD Million) by Product (2021-2032)
By Type
From Vegetables
From Fruits
From Fermentation Product
By Application
Food
Beverage
Chapter 11. Asia Pacific Food Polyols Analysis and Outlook
11.1. Asia Pacific Food Polyols Revenue (USD Million), and Revenue (USD Million) by Segments (2021-2032)
11.1.1. Asia Pacific Food Polyols Revenue (USD Million) by Type (2021-2032)
11.1.2. Asia Pacific Food Polyols Revenue (USD Million) by Application (2021-2032)
11.1.3. Asia Pacific Food Polyols Revenue (USD Million) by Product (2021-2032)
By Type
From Vegetables
From Fruits
From Fermentation Product
By Application
Food
Beverage
Chapter 12. South America Food Polyols Analysis and Outlook
12.1. South America Food Polyols Revenue (USD Million), by Segments (2021-2032)
12.1.1. South America Food Polyols Revenue (USD Million) by Type (2021-2032)
12.1.2. South America Food Polyols Revenue (USD Million) by Application (2021-2032)
12.1.3. South America Food Polyols Revenue (USD Million) by Product (2021-2032)
By Type
From Vegetables
From Fruits
From Fermentation Product
By Application
Food
Beverage
Chapter 13. Middle East and Africa Food Polyols Analysis and Outlook
13.1. Middle East and Africa Food Polyols Revenue (USD Million), by Segments (2021-2032)
13.1.1. Middle East and Africa Food Polyols Revenue (USD Million) by Type (2021-2032)
13.1.2. Middle East and Africa Food Polyols Revenue (USD Million) by Application (2021-2032)
13.1.3. Middle East and Africa Food Polyols Revenue (USD Million) by Product (2021-2032)
By Type
From Vegetables
From Fruits
From Fermentation Product
By Application
Food
Beverage
Chapter 14. Food Polyols Company Profiles
14.1 Business Overview
14.2 Product Profiles
14.3 SWOT Profiles
14.5 Recent Developments
14.6 Financial Profile
List of Companies
Archer Daniels Midland Company (ADM)
Avator
Cargill, Incorporated
Environmental Protection Agency (EPA)
Ingredion Incorporated
IPFS Corporation
Nutra Food Ingredients, LLC
Roquette Frères
Sweeteners Plus, Inc.
15. Methodology and Data Sources
15.1 Customization Offerings
15.2 Subscription Services
15.3 Related Reports
15.4 Publisher Expertise
LIST OF TABLES
Table 1 Market Segmentation Analysis
Table 2 Global Food Polyols Market Share of Leading Companies, 2023
Table 3 Product Offerings of Leading Companies
Table 4 Low Growth Scenario Forecasts
Table 5 Reference Case Growth Scenario
Table 6 High Growth Case Scenario
Table 7 Global Food Polyols Revenue (USD Million) And CAGR (%) By Type (2021-2032)
Table 8 Global Food Polyols Revenue (USD Million) And CAGR (%) By Application (2021-2032)
Table 9 Global Food Polyols Revenue (USD Million) And CAGR (%) By Product (2021-2032)
Table 10 Global Food Polyols Market Revenue (USD Million) By Regions (2021-2032)
Table 11 Global Food Polyols Market Share (%) By Regions (2021-2032)
Table 12 North America Food Polyols Revenue (USD Million) By Country (2021-2032)
Table 13 Europe Food Polyols Revenue (USD Million) By Country (2021-2032)
Table 14 Asia Pacific Food Polyols Revenue (USD Million) By Country (2021-2032)
Table 15 South America Food Polyols Revenue (USD Million) By Country (2021-2032)
Table 16 Middle East and Africa Food Polyols Revenue (USD Million) By Region (2021-2032)
Table 17 North America Food Polyols Revenue (USD Million) By Type (2021-2032)
Table 18 North America Food Polyols Revenue (USD Million) By Application (2021-2032)
Table 19 North America Food Polyols Revenue (USD Million) By Product (2021-2032)
Table 20 Europe Food Polyols Revenue (USD Million) By Type (2021-2032)
Table 21 Europe Food Polyols Revenue (USD Million) By Application (2021-2032)
Table 22 Europe Food Polyols Revenue (USD Million) By Product (2021-2032)
Table 23 Asia Pacific Food Polyols Revenue (USD Million) By Type (2021-2032)
Table 24 Asia Pacific Food Polyols Revenue (USD Million) By Application (2021-2032)
Table 25 Asia Pacific Food Polyols Revenue (USD Million) By Product (2021-2032)
Table 26 South America Food Polyols Revenue (USD Million) By Type (2021-2032)
Table 27 South America Food Polyols Revenue (USD Million) By Application (2021-2032)
Table 28 South America Food Polyols Revenue (USD Million) By Product (2021-2032)
Table 29 Middle East and Africa Food Polyols Revenue (USD Million) By Type (2021-2032)
Table 30 Middle East and Africa Food Polyols Revenue (USD Million) By Application (2021-2032)
Table 31 Middle East and Africa Food Polyols Revenue (USD Million) By Product (2021-2032)
LIST OF FIGURES
Figure 1. Market Scope
Figure 2. Pricing Forecasts Per Unit, 2023- 2032
Figure 3. Porter’s Five Forces
Figure 4. Global Food Polyols Market Revenue (USD Million) By Regions (2021-2032)
Figure 5. Global Food Polyols Market Share (%) By Regions (2023)
Figure 6. North America Food Polyols Revenue (USD Million) By Country (2021-2032)
Figure 7. United States Food Polyols Revenue (USD Million) By Country (2021-2032)
Figure 8. Canada Food Polyols Revenue (USD Million) By Country (2021-2032)
Figure 9. Mexico Food Polyols Revenue (USD Million) By Country (2021-2032)
Figure 10. Europe Food Polyols Revenue (USD Million) By Country (2021-2032)
Figure 11. Germany Food Polyols Revenue (USD Million) By Country (2021-2032)
Figure 12. France Food Polyols Revenue (USD Million) By Country (2021-2032)
Figure 13. United Kingdom Food Polyols Revenue (USD Million) By Country (2021-2032)
Figure 14. Spain Food Polyols Revenue (USD Million) By Country (2021-2032)
Figure 15. Italy Food Polyols Revenue (USD Million) By Country (2021-2032)
Figure 16. Russia Food Polyols Revenue (USD Million) By Country (2021-2032)
Figure 17. Rest of Europe Food Polyols Revenue (USD Million) By Country (2021-2032)
Figure 11. Asia Pacific Food Polyols Revenue (USD Million) By Country (2021-2032)
Figure 12. China Food Polyols Revenue (USD Million) By Country (2021-2032)
Figure 13. Japan Food Polyols Revenue (USD Million) By Country (2021-2032)
Figure 14. India Food Polyols Revenue (USD Million) By Country (2021-2032)
Figure 15. South Korea Food Polyols Revenue (USD Million) By Country (2021-2032)
Figure 16. Australia Food Polyols Revenue (USD Million) By Country (2021-2032)
Figure 17. South East Asia Food Polyols Revenue (USD Million) By Country (2021-2032)
Figure 18. South America Food Polyols Revenue (USD Million) By Country (2021-2032)
Figure 19. Brazil Food Polyols Revenue (USD Million) By Country (2021-2032)
Figure 20. Argentina Food Polyols Revenue (USD Million) By Country (2021-2032)
Figure 21. Rest of Asia Pacific Food Polyols Revenue (USD Million) By Country (2021-2032)
Figure 22. Middle East and Africa Food Polyols Revenue (USD Million) By Region (2021-2032)
Figure 23. Saudi Arabia Food Polyols Revenue (USD Million) By Region (2021-2032)
Figure 24. The UAE Food Polyols Revenue (USD Million) By Region (2021-2032)
Figure 25. Rest of Middle East Food Polyols Revenue (USD Million) By Region (2021-2032)
Figure 26. South Africa Food Polyols Revenue (USD Million) By Region (2021-2032)
Figure 27. Africa Food Polyols Revenue (USD Million) By Region (2021-2032)
Figure 28. North America Food Polyols Revenue (USD Million) By Type (2021-2032)
Figure 29. North America Food Polyols Revenue (USD Million) By Application (2021-2032)
Figure 30. North America Food Polyols Revenue (USD Million) By Product (2021-2032)
Figure 31. Europe Food Polyols Revenue (USD Million) By Type (2021-2032)
Figure 32. Europe Food Polyols Revenue (USD Million) By Application (2021-2032)
Figure 33. Europe Food Polyols Revenue (USD Million) By Product (2021-2032)
Figure 34. Asia Pacific Food Polyols Revenue (USD Million) By Type (2021-2032)
Figure 35. Asia Pacific Food Polyols Revenue (USD Million) By Application (2021-2032)
Figure 36. Asia Pacific Food Polyols Revenue (USD Million) By Product (2021-2032)
Figure 37. South America Food Polyols Revenue (USD Million) By Type (2021-2032)
Figure 38. South America Food Polyols Revenue (USD Million) By Application (2021-2032)
Figure 39. South America Food Polyols Revenue (USD Million) By Product (2021-2032)
Figure 40. Middle East and Africa Food Polyols Revenue (USD Million) By Type (2021-2032)
Figure 41. Middle East and Africa Food Polyols Revenue (USD Million) By Application (2021-2032)
Figure 42. Middle East and Africa Food Polyols Revenue (USD Million) By Product (2021-2032)
By Type
From Vegetables
From Fruits
From Fermentation Product
By Application
Food
Beverage
Countries Analyzed
North America (US, Canada, Mexico)
Europe (Germany, UK, France, Spain, Italy, Russia, Rest of Europe)
Asia Pacific (China, India, Japan, South Korea, Australia, South East Asia, Rest of Asia)
South America (Brazil, Argentina, Rest of South America)
Middle East and Africa (Saudi Arabia, UAE, Rest of Middle East, South Africa, Egypt, Rest of Africa)
