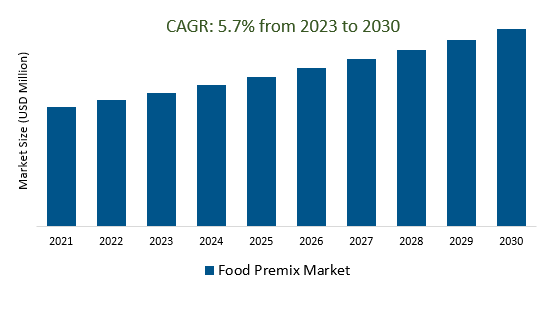
The global Food Premix Market Size is estimated to register 5.7% growth over the forecast period from 2023 to 2030.
The market growth is driven predominantly by the increasing health consciousness among consumers is pushing them to seek out foods that offer added nutritional benefits. This drives the demand for premixes that can enhance the nutritional profile of various food products. Leading companies are focusing on, Functional Ingredients, Clean Label Solutions, Targeted Health Solutions, Focus on Mental Health, and others to boost market shares in the industry.
Market Overview
The Food Premix Market involves the creation and distribution of nutrient-rich mixtures containing vitamins, minerals, amino acids, and functional ingredients to enhance the nutritional content of various foods, addressing deficiencies and health concerns. Driven by health-conscious consumers, regulatory support, and urbanization, this dynamic market is expanding globally, catering to trends like personalized nutrition, fortification of plant-based products, and healthy aging. Challenges include formulation complexity and maintaining nutrient stability, while ongoing innovation and research contribute to the market's growth and the improvement of global nutrition and well-being.
Market Dynamics
Market Trends- Companies are launching Focus on Specific Health Benefits to attract a consumer base
The Food Premix Market is witnessing a significant shift towards addressing specific health benefits through tailored formulations. As consumer awareness of nutrition's impact on well-being grows, food premixes are being designed to target precise health concerns. From immune support and cognitive function to heart health and digestive wellness, these specialized premixes combine essential nutrients, functional ingredients, and bioactive compounds to provide targeted solutions. This trend is driven by the desire for proactive approaches to health and the demand for convenient, ready-to-consumer products that offer tangible benefits.
Market Driver- Global Population Growth demand for efficient Food Premix Market
The global population growth is a pivotal driver influencing the Food Premix Market. As the world's population continues to expand, the demand for efficient and accessible nutritional solutions intensifies. Food premixes, enriched with essential vitamins, minerals, and nutrients, serve as a practical way to address widespread nutritional deficiencies and cater to the nutritional needs of a larger populace. This growth trajectory prompts manufacturers to innovate and diversify premix offerings to accommodate various dietary preferences, demographic groups, and geographic regions, thereby playing a critical role in nourishing an increasingly populous planet.
Market Opportunity-Introduction of Food Processing Industry Growth
The growth of the food processing industry has a direct and symbiotic relationship with the Food Premix Market. As the food processing sector expands to meet the demands of a growing global population, the demand for efficient ways to fortify and enhance the nutritional content of processed foods also increases. Food premixes play a pivotal role in this synergy by providing a convenient and effective means to incorporate essential nutrients into processed products while maintaining their taste and texture. This dynamic drives innovation in premix formulation and application methods, ensuring that the food processing industry can deliver nutritionally enriched products that align with evolving consumer preferences for health and convenience.
Market Share Analysis- Amino Acids Food Premix Market will register the fastest growth
The global Food Premix Market is analyzed across Amino Acids, Vitamin, Minerals, and others. Of these, Amino Acids is poised to register the fastest growth. Amino acids are playing a pivotal role in the Food Premix Market, driving its growth and innovation. These essential building blocks of proteins are being strategically integrated into premix formulations to target specific health needs, ranging from muscle development to immune support. With applications in sports nutrition, functional beverages, and infant formulas, amino acid-enriched premixes reflect the market's responsiveness to personalized health goals and its ability to deliver functional foods that align with consumer demands.
Market Share Analysis- Food and Beverages held a significant market share in 2023
The global Food Premix Market is analyzed across a wide range of Products including Food and Beverages, and others. Of these, Food and Beverages held a significant market share in 2023. The Food Premix Market significantly impacts the food and beverage industry by fortifying a wide array of products with nutrient-rich blends, responding to consumer demand for healthier choices. Across categories like cereals, bakery goods, dairy, and beverages, food premixes enhance nutritional profiles, effectively addressing deficiencies and accommodating health-conscious lifestyles, shaping the trajectory of functional consumption in the modern market.
By Ingredients
• Vitamin
• Minerals
• Amino Acids
• Antibiotics
• Others
By Application
Food and Beverages
- Dairy Products
- Baked Products
- Dietary Supplements
- Beverages
- Others
- Animal Nutrition
- Pharmaceutical
By Region
• North America (United States, Canada, Mexico)
• Europe (Germany, France, United Kingdom, Spain, Italy, Others)
• Asia Pacific (China, India, Japan, South Korea, Australia, Others)
• Latin America (Brazil, Argentina, Others)
• Middle East and Africa (Saudi Arabia, UAE, Kuwait, Other Middle East, South Africa, Nigeria, Other Africa)
Food Premix Market companies
• Koninklijke DSM N.V.
• Cargill Incorporated
• Archer Daniel Midlands Company
• BASF SE
• Corbion N.V
• Glanbia PLC
• Associated British Foods plc (AB Agri Ltd)
• Watson Inc
• Jubilant Life Sciences
• Sternvitamin GmbH & Co. KG
* List not exhaustive
Food Premix Market Outlook 2023
1 Market Overview
1.1 Introduction to the Food Premix Market
1.2 Scope of the Study
1.3 Research Objective
1.3.1 Key Market Scope and Segments
1.3.2 Players Covered
1.3.3 Years Considered
2 Executive Summary
2.1 2023 Food Premix Industry- Market Statistics
3 Market Dynamics
3.1 Market Drivers
3.2 Market Challenges
3.3 Market Opportunities
3.4 Market Trends
4 Market Factor Analysis
4.1 Porter’s Five Forces
4.2 Market Entropy
4.2.1 Global Food Premix Market Companies with Area Served
4.2.2 Products Offerings Global Food Premix Market
5 COVID-19 Impact Analysis and Outlook Scenarios
5.1.1 Covid-19 Impact Analysis
5.1.2 Post-COVID-19 Scenario- Low Growth Case
5.1.3 Post-COVID-19 Scenario- Reference Growth Case
5.1.4 Post-COVID-19 Scenario- Low Growth Case
6 Global Food Premix Market Trends
6.1 Global Food Premix Revenue (USD Million) and CAGR (%) by Type (2018-2030)
6.2 Global Food Premix Revenue (USD Million) and CAGR (%) by Applications (2018-2030)
6.3 Global Food Premix Revenue (USD Million) and CAGR (%) by Regions (2018-2030)
7 Global Food Premix Market Revenue (USD Million) by Type, and Applications (2018-2022)
7.1 Global Food Premix Revenue (USD Million) by Type (2018-2022)
7.1.1 Global Food Premix Revenue (USD Million), Market Share (%) by Type (2018-2022)
7.2 Global Food Premix Revenue (USD Million) by Applications (2018-2022)
7.2.1 Global Food Premix Revenue (USD Million), Market Share (%) by Applications (2018-2022)
8 Global Food Premix Development Regional Status and Outlook
8.1 Global Food Premix Revenue (USD Million) By Regions (2018-2022)
8.2 North America Food Premix Revenue (USD Million) by Type, and Application (2018-2022)
8.2.1 North America Food Premix Revenue (USD Million) by Country (2018-2022)
8.2.2 North America Food Premix Revenue (USD Million) by Type (2018-2022)
8.2.3 North America Food Premix Revenue (USD Million) by Applications (2018-2022)
8.3 Europe Food Premix Revenue (USD Million), by Type, and Applications (USD Million) (2018-2022)
8.3.1 Europe Food Premix Revenue (USD Million), by Country (2018-2022)
8.3.2 Europe Food Premix Revenue (USD Million) by Type (2018-2022)
8.3.3 Europe Food Premix Revenue (USD Million) by Applications (2018-2022)
8.4 Asia Pacific Food Premix Revenue (USD Million), and Revenue (USD Million) by Type, and Applications (2018-2022)
8.4.1 Asia Pacific Food Premix Revenue (USD Million) by Country (2018-2022)
8.4.2 Asia Pacific Food Premix Revenue (USD Million) by Type (2018-2022)
8.4.3 Asia Pacific Food Premix Revenue (USD Million) by Applications (2018-2022)
8.5 South America Food Premix Revenue (USD Million), by Type, and Applications (2018-2022)
8.5.1 South America Food Premix Revenue (USD Million), by Country (2018-2022)
8.5.2 South America Food Premix Revenue (USD Million) by Type (2018-2022)
8.5.3 South America Food Premix Revenue (USD Million) by Applications (2018-2022)
8.6 Middle East and Africa Food Premix Revenue (USD Million), by Type, Technology, Application, Thickness (2018-2022)
8.6.1 Middle East and Africa Food Premix Revenue (USD Million) by Country (2018-2022)
8.6.2 Middle East and Africa Food Premix Revenue (USD Million) by Type (2018-2022)
8.6.3 Middle East and Africa Food Premix Revenue (USD Million) by Applications (2018-2022)
9 Company Profiles
10 Global Food Premix Market Revenue (USD Million), by Type, and Applications (2023-2030)
10.1 Global Food Premix Revenue (USD Million) and Market Share (%) by Type (2023-2030)
10.1.1 Global Food Premix Revenue (USD Million), and Market Share (%) by Type (2023-2030)
10.2 Global Food Premix Revenue (USD Million) and Market Share (%) by Applications (2023-2030)
10.2.1 Global Food Premix Revenue (USD Million), and Market Share (%) by Applications (2023-2030)
11 Global Food Premix Development Regional Status and Outlook Forecast
11.1 Global Food Premix Revenue (USD Million) By Regions (2023-2030)
11.2 North America Food Premix Revenue (USD Million) by Type, and Applications (2023-2030)
11.2.1 North America Food Premix Revenue (USD) Million by Country (2023-2030)
11.2.2 North America Food Premix Revenue (USD Million), by Type (2023-2030)
11.2.3 North America Food Premix Revenue (USD Million), Market Share (%) by Applications (2023-2030)
11.3 Europe Food Premix Revenue (USD Million), by Type, and Applications (2023-2030)
11.3.1 Europe Food Premix Revenue (USD Million), by Country (2023-2030)
11.3.2 Europe Food Premix Revenue (USD Million), by Type (2023-2030)
11.3.3 Europe Food Premix Revenue (USD Million), by Applications (2023-2030)
11.4 Asia Pacific Food Premix Revenue (USD Million) by Type, and Applications (2023-2030)
11.4.1 Asia Pacific Food Premix Revenue (USD Million), by Country (2023-2030)
11.4.2 Asia Pacific Food Premix Revenue (USD Million), by Type (2023-2030)
11.4.3 Asia Pacific Food Premix Revenue (USD Million), by Applications (2023-2030)
11.5 South America Food Premix Revenue (USD Million), by Type, and Applications (2023-2030)
11.5.1 South America Food Premix Revenue (USD Million), by Country (2023-2030)
11.5.2 South America Food Premix Revenue (USD Million), by Type (2023-2030)
11.5.3 South America Food Premix Revenue (USD Million), by Applications (2023-2030)
11.6 Middle East and Africa Food Premix Revenue (USD Million), by Type, and Applications (2023-2030)
11.6.1 Middle East and Africa Food Premix Revenue (USD Million), by Region (2023-2030)
11.6.2 Middle East and Africa Food Premix Revenue (USD Million), by Type (2023-2030)
11.6.3 Middle East and Africa Food Premix Revenue (USD Million), by Applications (2023-2030)
12 Methodology and Data Sources
12.1 Methodology/Research Approach
12.1.1 Research Programs/Design
12.1.2 Market Size Estimation
12.1.3 Market Breakdown and Data Triangulation
12.2 Data Sources
12.2.1 Secondary Sources
12.2.2 Primary Sources
12.3 Disclaimer
List of Tables
Table 1 Market Segmentation Analysis
Table 2 Global Food Premix Market Companies with Areas Served
Table 3 Products Offerings Global Food Premix Market
Table 4 Low Growth Scenario Forecasts
Table 5 Reference Case Growth Scenario
Table 6 High Growth Case Scenario
Table 7 Global Food Premix Revenue (USD Million) And CAGR (%) By Type (2018-2030)
Table 8 Global Food Premix Revenue (USD Million) And CAGR (%) By Applications (2018-2030)
Table 9 Global Food Premix Revenue (USD Million) And CAGR (%) By Regions (2018-2030)
Table 10 Global Food Premix Revenue (USD Million) By Type (2018-2022)
Table 11 Global Food Premix Revenue Market Share (%) By Type (2018-2022)
Table 12 Global Food Premix Revenue (USD Million) By Applications (2018-2022)
Table 13 Global Food Premix Revenue Market Share (%) By Applications (2018-2022)
Table 14 Global Food Premix Market Revenue (USD Million) By Regions (2018-2022)
Table 15 Global Food Premix Market Share (%) By Regions (2018-2022)
Table 16 North America Food Premix Revenue (USD Million) By Country (2018-2022)
Table 17 North America Food Premix Revenue (USD Million) By Type (2018-2022)
Table 18 North America Food Premix Revenue (USD Million) By Applications (2018-2022)
Table 19 Europe Food Premix Revenue (USD Million) By Country (2018-2022)
Table 20 Europe Food Premix Revenue (USD Million) By Type (2018-2022)
Table 21 Europe Food Premix Revenue (USD Million) By Applications (2018-2022)
Table 22 Asia Pacific Food Premix Revenue (USD Million) By Country (2018-2022)
Table 23 Asia Pacific Food Premix Revenue (USD Million) By Type (2018-2022)
Table 24 Asia Pacific Food Premix Revenue (USD Million) By Applications (2018-2022)
Table 25 South America Food Premix Revenue (USD Million) By Country (2018-2022)
Table 26 South America Food Premix Revenue (USD Million) By Type (2018-2022)
Table 27 South America Food Premix Revenue (USD Million) By Applications (2018-2022)
Table 28 Middle East and Africa Food Premix Revenue (USD Million) By Region (2018-2022)
Table 29 Middle East and Africa Food Premix Revenue (USD Million) By Type (2018-2022)
Table 30 Middle East and Africa Food Premix Revenue (USD Million) By Applications (2018-2022)
Table 31 Financial Analysis
Table 32 Global Food Premix Revenue (USD Million) By Type (2023-2030)
Table 33 Global Food Premix Revenue Market Share (%) By Type (2023-2030)
Table 34 Global Food Premix Revenue (USD Million) By Applications (2023-2030)
Table 35 Global Food Premix Revenue Market Share (%) By Applications (2023-2030)
Table 36 Global Food Premix Market Revenue (USD Million), And Revenue (USD Million) By Regions (2023-2030)
Table 37 North America Food Premix Revenue (USD)By Country (2023-2030)
Table 38 North America Food Premix Revenue (USD Million) By Type (2023-2030)
Table 39 North America Food Premix Revenue (USD Million) By Applications (2023-2030)
Table 40 Europe Food Premix Revenue (USD Million) By Country (2023-2030)
Table 41 Europe Food Premix Revenue (USD Million) By Type (2023-2030)
Table 42 Europe Food Premix Revenue (USD Million) By Applications (2023-2030)
Table 43 Asia Pacific Food Premix Revenue (USD Million) By Country (2023-2030)
Table 44 Asia Pacific Food Premix Revenue (USD Million) By Type (2023-2030)
Table 45 Asia Pacific Food Premix Revenue (USD Million) By Applications (2023-2030)
Table 46 South America Food Premix Revenue (USD Million) By Country (2023-2030)
Table 47 South America Food Premix Revenue (USD Million) By Type (2023-2030)
Table 48 South America Food Premix Revenue (USD Million) By Applications (2023-2030)
Table 49 Middle East and Africa Food Premix Revenue (USD Million) By Region (2023-2030)
Table 50 Middle East and Africa Food Premix Revenue (USD Million) By Region (2023-2030)
Table 51 Middle East and Africa Food Premix Revenue (USD Million) By Type (2023-2030)
Table 52 Middle East and Africa Food Premix Revenue (USD Million) By Applications (2023-2030)
Table 53 Research Programs/Design for This Report
Table 54 Key Data Information from Secondary Sources
Table 55 Key Data Information from Primary Sources
List of Figures
Figure 1 Market Scope
Figure 2 Porter’s Five Forces
Figure 3 Global Food Premix Revenue (USD Million) By Type (2018-2022)
Figure 4 Global Food Premix Revenue Market Share (%) By Type (2022)
Figure 5 Global Food Premix Revenue (USD Million) By Applications (2018-2022)
Figure 6 Global Food Premix Revenue Market Share (%) By Applications (2022)
Figure 7 Global Food Premix Market Revenue (USD Million) By Regions (2018-2022)
Figure 8 Global Food Premix Market Share (%) By Regions (2022)
Figure 9 North America Food Premix Revenue (USD Million) By Country (2018-2022)
Figure 10 North America Food Premix Revenue (USD Million) By Type (2018-2022)
Figure 11 North America Food Premix Revenue (USD Million) By Applications (2018-2022)
Figure 12 Europe Food Premix Revenue (USD Million) By Country (2018-2022)
Figure 13 Europe Food Premix Revenue (USD Million) By Type (2018-2022)
Figure 14 Europe Food Premix Revenue (USD Million) By Applications (2018-2022)
Figure 15 Asia Pacific Food Premix Revenue (USD Million) By Country (2018-2022)
Figure 16 Asia Pacific Food Premix Revenue (USD Million) By Type (2018-2022)
Figure 17 Asia Pacific Food Premix Revenue (USD Million) By Applications (2018-2022)
Figure 18 South America Food Premix Revenue (USD Million) By Country (2018-2022)
Figure 19 South America Food Premix Revenue (USD Million) By Type (2018-2022)
Figure 20 South America Food Premix Revenue (USD Million) By Applications (2018-2022)
Figure 21 Middle East and Africa Food Premix Revenue (USD Million) By Region (2018-2022)
Figure 22 Middle East and Africa Food Premix Revenue (USD Million) By Type (2018-2022)
Figure 23 Middle East and Africa Food Premix Revenue (USD Million) By Applications (2018-2022)
Figure 24 Global Food Premix Revenue (USD Million) By Type (2023-2030)
Figure 25 Global Food Premix Revenue Market Share (%) By Type (2030)
Figure 26 Global Food Premix Revenue (USD Million) By Applications (2023-2030)
Figure 27 Global Food Premix Revenue Market Share (%) By Applications (2030)
Figure 28 Global Food Premix Market Revenue (USD Million) By Regions (2023-2030)
Figure 29 North America Food Premix Revenue (USD Million) By Country (2023-2030)
Figure 30 North America Food Premix Revenue (USD Million) By Type (2023-2030)
Figure 31 North America Food Premix Revenue (USD Million) By Applications (2023-2030)
Figure 32 Europe Food Premix Revenue (USD Million) By Country (2023-2030)
Figure 33 Europe Food Premix Revenue (USD Million) By Type (2023-2030)
Figure 34 Europe Food Premix Revenue (USD Million) By Applications (2023-2030)
Figure 35 Asia Pacific Food Premix Revenue (USD Million) By Country (2023-2030)
Figure 36 Asia Pacific Food Premix Revenue (USD Million) By Type (2023-2030)
Figure 37 Asia Pacific Food Premix Revenue (USD Million) By Applications (2023-2030)
Figure 38 South America Food Premix Revenue (USD Million) By Country (2023-2030)
Figure 39 South America Food Premix Revenue (USD Million) By Type (2023-2030)
Figure 40 South America Food Premix Revenue (USD Million) By Applications (2023-2030)
Figure 41 Middle East and Africa Food Premix Revenue (USD Million) By Region (2023-2030)
Figure 42 Middle East and Africa Food Premix Revenue (USD Million) By Region (2023-2030)
Figure 43 Middle East and Africa Food Premix Revenue (USD Million) By Type (2023-2030)
Figure 44 Middle East and Africa Food Premix Revenue (USD Million) By Applications (2023-2030)
Figure 45 Bottom-Up and Top-Down Approaches For This Report
Figure 46 Data Triangulation
