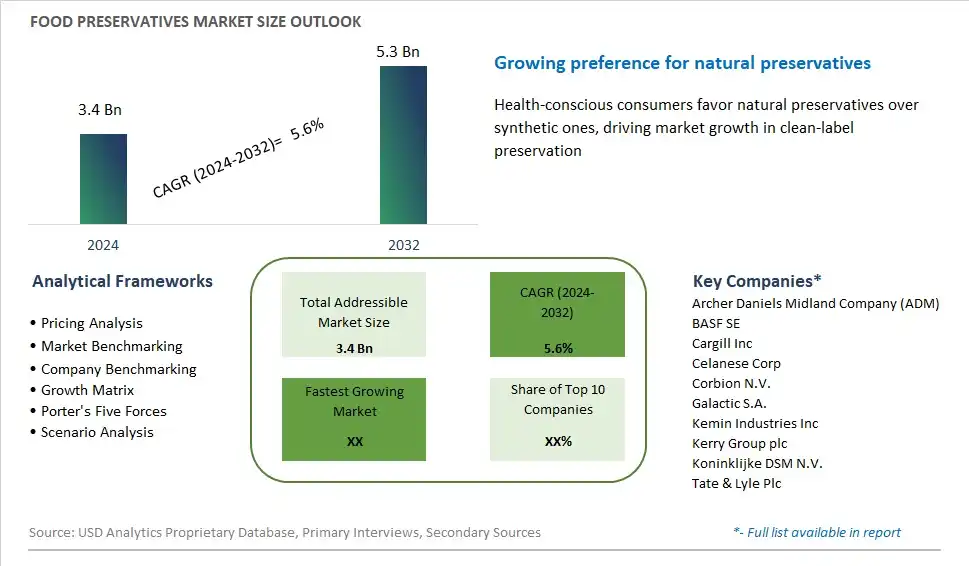
Global Food Preservatives Market Size is valued at $3.4 Billion in 2024 and is forecast to register a growth rate (CAGR) of 5.6% to reach $5.3 Billion by 2032.
The global Food Preservatives Market Comprehensive Study analyzes and forecasts the market size across 6 regions and 24 countries for diverse segments -By Label (Clean Label, Conventional), By Type (Natural, Synthetic), By Function (Anti-microbial, Anti-oxidant, Others), By Application (Meat & Poultry Products, Bakery Products, Dairy Products, Beverages, Snacks, Others)
An Introduction to Food Preservatives Market
Food preservatives are additives used in food and beverage products to prevent spoilage, extend shelf life, and maintain product quality and safety in 2024. These substances inhibit microbial growth, oxidation, and enzymatic reactions that contribute to food deterioration, allowing manufacturers to produce safe and stable products with minimal processing and refrigeration requirements. Common types of food preservatives include antimicrobial agents, antioxidants, and chelating agents, which are added to various food products such as baked goods, meats, dairy products, and beverages to control microbial spoilage, lipid oxidation, and color changes. With advancements in preservative technology, manufacturers have access to a wide range of natural and synthetic preservatives that offer effective protection against spoilage while meeting consumer preferences for clean-label and minimally processed foods. Whether using traditional preservatives such as salt, sugar, and vinegar or innovative preservatives such as plant extracts, essential oils, and bacteriocins, food manufacturers rely on preservatives to ensure product safety and stability throughout the supply chain. As consumer demand for convenience, freshness, and natural ingredients grows, the market for food preservatives is expected to evolve, driven by innovations in preservative formulations, application methods, and regulatory approvals that meet market needs and consumer expectations.
Food Preservatives Competitive Landscape
The market report analyses the leading companies in the industry including Archer Daniels Midland Company (ADM), BASF SE, Cargill Inc, Celanese Corp, Corbion N.V., Galactic S.A., Kemin Industries Inc, Kerry Group plc, Koninklijke DSM N.V., Tate & Lyle Plc, and Others.
Food Preservatives Market Dynamics
Food Preservatives Market Trend: Growing Demand for Natural and Clean Label Preservatives
One prominent trend in the food preservatives market is the increasing consumer preference for natural and clean label ingredients. As consumers become more health-conscious and mindful of the ingredients in their food products, there is a growing demand for preservatives derived from natural sources such as herbs, spices, plant extracts, and fermentation products. Natural preservatives are perceived as safer alternatives to synthetic additives and are often associated with clean label claims, which appeal to consumers seeking minimally processed and additive-free foods. Food manufacturers are responding to this trend by reformulating their products with natural preservatives to meet consumer preferences and comply with regulatory restrictions on synthetic additives, driving the growth of natural preservatives in the market.
Market Driver: Extended Shelf Life Requirements and Food Safety Concerns
A key driver fueling the demand for food preservatives is the need to extend the shelf life of perishable food products and address food safety concerns. With the global food supply chain becoming increasingly complex and extended, food manufacturers are under pressure to ensure that their products remain safe, fresh, and stable throughout distribution and storage. Preservatives play a critical role in inhibiting microbial growth, preventing spoilage, and maintaining the sensory attributes of food products over an extended period. Additionally, preservatives help reduce food waste by prolonging the shelf life of perishable items, thereby enhancing supply chain efficiency and reducing the environmental impact associated with food disposal. As foodborne illness outbreaks and contamination incidents continue to pose significant risks to public health, the demand for effective preservative solutions remains high, driving the growth of the food preservatives market.
Market Opportunity: Innovation in Natural Preservative Technologies
An opportunity within the food preservatives market lies in the innovation and development of natural preservative technologies to meet consumer demand for clean label solutions while ensuring product safety and quality. Manufacturers are investing in research and development to discover novel natural preservatives with broad-spectrum antimicrobial activity, enhanced stability, and minimal impact on taste, texture, and nutritional value. Opportunities exist for the discovery and commercialization of bio-based preservatives derived from renewable sources such as plant extracts, essential oils, antimicrobial peptides, and fermentates. Furthermore, advancements in encapsulation and delivery systems offer opportunities to improve the efficacy and stability of natural preservatives in various food applications. By capitalizing on these technological advancements and addressing the evolving needs of consumers and food manufacturers, suppliers of natural preservatives can gain a competitive edge and capitalize on the growing market demand for clean label food preservation solutions.
Food Preservatives Market Share Analysis: Conventional Label Segment held the dominant market share in 2024
In the Food Preservatives market segmented by Label, the Conventional segment is the largest category. This dominance is attributed to the widespread use and availability of conventional preservatives in the food industry. Conventional preservatives have been utilized for decades to extend the shelf life of food products by inhibiting microbial growth, oxidation, and enzymatic reactions. They are well-established and trusted by food manufacturers for their effectiveness in preserving food quality and safety. Additionally, conventional preservatives offer a broad spectrum of protection against spoilage and contamination, making them suitable for a wide range of food products. While clean label preservatives are gaining popularity due to consumer demand for natural ingredients, the conventional segment maintains its leadership position due to its established usage, regulatory approval, and cost-effectiveness. As food manufacturers continue to prioritize product stability and safety, the Conventional Label segment remains at the forefront of the Food Preservatives market, driving growth and innovation to meet industry demands.
Food Preservatives Market Share Analysis: Natural Type market is poised to register the fastest growth rae over the forecast period to 2032
In the Food Preservatives market segmented by Type, the Natural segment is the fastest-growing category. This accelerated growth is propelled by increasing consumer demand for clean label products and natural ingredients in food and beverage formulations. Natural preservatives, derived from plant extracts, essential oils, and fermentation processes, are perceived as safer alternatives to synthetic counterparts due to their perceived health benefits and minimal processing. Edible oil extracts, rosemary extracts, natamycin, vinegar, chitosan, and other natural preservatives offer effective antimicrobial and antioxidant properties while meeting clean label expectations. Further, as consumers become more health-conscious and seek transparency in food labeling, food manufacturers are increasingly incorporating natural preservatives into their formulations to meet consumer preferences and regulatory requirements. Additionally, advancements in natural preservative technologies and extraction methods further enhance their efficacy and versatility in food applications, driving their widespread adoption across the food industry. As the demand for natural, clean label products continues to rise, the Natural Type segment experiences rapid growth, underscoring its significance in driving innovation and sustainability within the Food Preservatives market.
Food Preservatives Market Share Analysis: Anti-microbial Function Segment held the dominant market share in 2024
In the Food Preservatives market segmented by Function, the Anti-microbial segment is the largest category. This dominance is attributed to the critical role of anti-microbial preservatives in preventing microbial growth and spoilage, thereby extending the shelf life of food products. Anti-microbial preservatives inhibit the growth of bacteria, yeasts, and molds by disrupting their cellular processes or membrane integrity, preserving food quality, safety, and freshness. Food manufacturers rely on anti-microbial preservatives to maintain product integrity throughout distribution and storage, reducing the risk of foodborne illnesses and product wastage. Additionally, anti-microbial preservatives contribute to the stability of a wide range of food products, including dairy, meat, baked goods, and beverages, ensuring consumer satisfaction and regulatory compliance. As stakeholders prioritize food safety and quality assurance, the Anti-microbial Function segment maintains its leadership position in the Food Preservatives market, driving growth and innovation to meet evolving industry needs.
Food Preservatives Market Segmentation
By Label
Clean Label
Conventional
By Type
Natural
-Edible Oil
-Rosemary Extracts
-Natamycin
-Vinegar
-Chitosan
-Others
Synthetic
-Propionates
-Sorbates
-Benzoates
-Others
By Function
Anti-microbial
Anti-oxidant
Others
By Application
Meat & Poultry Products
Bakery Products
Dairy Products
Beverages
Snacks
Others
Countries Analyzed
North America (US, Canada, Mexico)
Europe (Germany, UK, France, Spain, Italy, Russia, Rest of Europe)
Asia Pacific (China, India, Japan, South Korea, Australia, South East Asia, Rest of Asia)
South America (Brazil, Argentina, Rest of South America)
Middle East and Africa (Saudi Arabia, UAE, Rest of Middle East, South Africa, Egypt, Rest of Africa)
Food Preservatives Companies Profiled in the Study
Archer Daniels Midland Company (ADM)
BASF SE
Cargill Inc
Celanese Corp
Corbion N.V.
Galactic S.A.
Kemin Industries Inc
Kerry Group plc
Koninklijke DSM N.V.
Tate & Lyle Plc
*- List Not Exhaustive
Chapter 1. TABLE OF CONTENTS
Chapter 2. Introduction to Food Preservatives Market
2.1. Market Overview
2.2. Key Statistics and Report Highlights
2.3. Scope of the Comprehensive Study
2.3.1. Market Definition
2.3.2 Countries and Regions Covered
2.3.3 Research Objective
2.3.4 Units, Currency, and Conversions
2.3.5 Industry Value Chain
2.4. Key Market Segments
2.5. Key Companies
2.6. Study Period
Chapter 3. Strategic Analysis Review
3.1. Food Preservatives Pricing Analysis and Forecast
3.2. Porter’s Five Forces
3.3. Market Ecosystem
3.4. SWOT Analysis
3.5. Regulatory Scenario
3.3. Effects of Inflation, Russia-Ukraine War, moderating economic growth, and other macroeconomic factors
Chapter 4. Competitive Landscape
4.1. Market Share Analysis
4.1.1. Global Food Preservatives Market Share by Company, 2023
4.1.2. Product Offerings of Leading Food Preservatives Companies
4.2. Market Entropy
4.2.1. New Product Launches in the Industry
4.2.2. Mergers, Acquisitions, Joint ventures, and Partnerships
4.3. Key Strategies and Best Practices
Chapter 5. Global Market Projections: Best, Reference, and Low Case Scenarios
5.1. Growth Analysis- Case Scenario Definitions
5.2. Low Growth Case Scenario Forecasts
5.3. Reference Growth Case Scenario Forecasts
5.4. High Growth Case Scenario Forecasts
Chapter 6. Market Dynamics
6.1. Food Preservatives Market Drivers
6.2. Food Preservatives Market Challenges
6.6. Food Preservatives Market Opportunities
6.4. Food Preservatives Market Trends
Chapter 7. Global Food Preservatives Market Outlook Trends
7.1. Global Food Preservatives Revenue (USD Million) and CAGR (%) by Type (2021-2032)
7.2. Global Food Preservatives Revenue (USD Million) and CAGR (%) by Application (2021-2032)
7.3. Global Food Preservatives Revenue (USD Million) and CAGR (%) by Product (2021-2032)
By Label
Clean Label
Conventional
By Type
Natural
-Edible Oil
-Rosemary Extracts
-Natamycin
-Vinegar
-Chitosan
-Others
Synthetic
-Propionates
-Sorbates
-Benzoates
-Others
By Function
Anti-microbial
Anti-oxidant
Others
By Application
Meat & Poultry Products
Bakery Products
Dairy Products
Beverages
Snacks
Others
Chapter 8. Global Food Preservatives Regional Analysis and Outlook
8.1. Global Food Preservatives Revenue (USD Million) By Regions (2021- 2032)
8.2. North America Food Preservatives Revenue (USD Million) by Country (2021-2032)
8.2.1. United States Food Preservatives Regional Analysis and Outlook
8.2.2. Canada Food Preservatives Regional Analysis and Outlook
8.2.3. Mexico Food Preservatives Regional Analysis and Outlook
8.3. Europe Food Preservatives Revenue (USD Million), by Country (2021-2032)
8.3.1. Germany Food Preservatives Regional Analysis and Outlook
8.3.2. France Food Preservatives Regional Analysis and Outlook
8.3.3. United Kingdom Food Preservatives Regional Analysis and Outlook
8.3.4. Spain Food Preservatives Regional Analysis and Outlook
8.3.5. Italy Food Preservatives Regional Analysis and Outlook
8.3.6. Russia Food Preservatives Regional Analysis and Outlook
8.3.7. Rest of Europe Food Preservatives Regional Analysis and Outlook
8.4. Asia Pacific Food Preservatives Revenue (USD Million) by Country (2021-2032)
8.4.1. China Food Preservatives Regional Analysis and Outlook
8.4.2. Japan Food Preservatives Regional Analysis and Outlook
8.4.3. India Food Preservatives Regional Analysis and Outlook
8.4.4. South Korea Food Preservatives Regional Analysis and Outlook
8.4.5. Australia Food Preservatives Regional Analysis and Outlook
8.4.6. South East Asia Food Preservatives Regional Analysis and Outlook
8.4.7. Rest of Asia Pacific Food Preservatives Regional Analysis and Outlook
8.5. South America Food Preservatives Revenue (USD Million), by Country (2021-2032)
8.5.1. Brazil Food Preservatives Regional Analysis and Outlook
8.5.2. Argentina Food Preservatives Regional Analysis and Outlook
8.5.3. Rest of South America Food Preservatives Regional Analysis and Outlook
8.6. Middle East and Africa Food Preservatives Revenue (USD Million) by Country (2021-2032)
8.6.1. Middle East Food Preservatives Regional Analysis and Outlook
8.6.2. Africa Food Preservatives Regional Analysis and Outlook
Chapter 9. North America Food Preservatives Analysis and Outlook
9.1. North America Food Preservatives Revenue (USD Million) by Segments (2021-2032)
9.1.1. North America Food Preservatives Revenue (USD Million) by Type (2021-2032)
9.1.2. North America Food Preservatives Revenue (USD Million) by Application (2021-2032)
9.1.3. North America Food Preservatives Revenue (USD Million) by Product (2021-2032)
By Label
Clean Label
Conventional
By Type
Natural
-Edible Oil
-Rosemary Extracts
-Natamycin
-Vinegar
-Chitosan
-Others
Synthetic
-Propionates
-Sorbates
-Benzoates
-Others
By Function
Anti-microbial
Anti-oxidant
Others
By Application
Meat & Poultry Products
Bakery Products
Dairy Products
Beverages
Snacks
Others
Chapter 10. Europe Food Preservatives Analysis and Outlook
10.1. Europe Food Preservatives Revenue (USD Million), by Segments (USD Million) (2021-2032)
10.1.1. Europe Food Preservatives Revenue (USD Million) by Type (2021-2032)
10.1.2. Europe Food Preservatives Revenue (USD Million) by Application (2021-2032)
10.1.3. Europe Food Preservatives Revenue (USD Million) by Product (2021-2032)
By Label
Clean Label
Conventional
By Type
Natural
-Edible Oil
-Rosemary Extracts
-Natamycin
-Vinegar
-Chitosan
-Others
Synthetic
-Propionates
-Sorbates
-Benzoates
-Others
By Function
Anti-microbial
Anti-oxidant
Others
By Application
Meat & Poultry Products
Bakery Products
Dairy Products
Beverages
Snacks
Others
Chapter 11. Asia Pacific Food Preservatives Analysis and Outlook
11.1. Asia Pacific Food Preservatives Revenue (USD Million), and Revenue (USD Million) by Segments (2021-2032)
11.1.1. Asia Pacific Food Preservatives Revenue (USD Million) by Type (2021-2032)
11.1.2. Asia Pacific Food Preservatives Revenue (USD Million) by Application (2021-2032)
11.1.3. Asia Pacific Food Preservatives Revenue (USD Million) by Product (2021-2032)
By Label
Clean Label
Conventional
By Type
Natural
-Edible Oil
-Rosemary Extracts
-Natamycin
-Vinegar
-Chitosan
-Others
Synthetic
-Propionates
-Sorbates
-Benzoates
-Others
By Function
Anti-microbial
Anti-oxidant
Others
By Application
Meat & Poultry Products
Bakery Products
Dairy Products
Beverages
Snacks
Others
Chapter 12. South America Food Preservatives Analysis and Outlook
12.1. South America Food Preservatives Revenue (USD Million), by Segments (2021-2032)
12.1.1. South America Food Preservatives Revenue (USD Million) by Type (2021-2032)
12.1.2. South America Food Preservatives Revenue (USD Million) by Application (2021-2032)
12.1.3. South America Food Preservatives Revenue (USD Million) by Product (2021-2032)
By Label
Clean Label
Conventional
By Type
Natural
-Edible Oil
-Rosemary Extracts
-Natamycin
-Vinegar
-Chitosan
-Others
Synthetic
-Propionates
-Sorbates
-Benzoates
-Others
By Function
Anti-microbial
Anti-oxidant
Others
By Application
Meat & Poultry Products
Bakery Products
Dairy Products
Beverages
Snacks
Others
Chapter 13. Middle East and Africa Food Preservatives Analysis and Outlook
13.1. Middle East and Africa Food Preservatives Revenue (USD Million), by Segments (2021-2032)
13.1.1. Middle East and Africa Food Preservatives Revenue (USD Million) by Type (2021-2032)
13.1.2. Middle East and Africa Food Preservatives Revenue (USD Million) by Application (2021-2032)
13.1.3. Middle East and Africa Food Preservatives Revenue (USD Million) by Product (2021-2032)
By Label
Clean Label
Conventional
By Type
Natural
-Edible Oil
-Rosemary Extracts
-Natamycin
-Vinegar
-Chitosan
-Others
Synthetic
-Propionates
-Sorbates
-Benzoates
-Others
By Function
Anti-microbial
Anti-oxidant
Others
By Application
Meat & Poultry Products
Bakery Products
Dairy Products
Beverages
Snacks
Others
Chapter 14. Food Preservatives Company Profiles
14.1 Business Overview
14.2 Product Profiles
14.3 SWOT Profiles
14.5 Recent Developments
14.6 Financial Profile
List of Companies
Archer Daniels Midland Company (ADM)
BASF SE
Cargill Inc
Celanese Corp
Corbion N.V.
Galactic S.A.
Kemin Industries Inc
Kerry Group plc
Koninklijke DSM N.V.
Tate & Lyle Plc
15. Methodology and Data Sources
15.1 Customization Offerings
15.2 Subscription Services
15.3 Related Reports
15.4 Publisher Expertise
LIST OF TABLES
Table 1 Market Segmentation Analysis
Table 2 Global Food Preservatives Market Share of Leading Companies, 2023
Table 3 Product Offerings of Leading Companies
Table 4 Low Growth Scenario Forecasts
Table 5 Reference Case Growth Scenario
Table 6 High Growth Case Scenario
Table 7 Global Food Preservatives Revenue (USD Million) And CAGR (%) By Type (2021-2032)
Table 8 Global Food Preservatives Revenue (USD Million) And CAGR (%) By Application (2021-2032)
Table 9 Global Food Preservatives Revenue (USD Million) And CAGR (%) By Product (2021-2032)
Table 10 Global Food Preservatives Market Revenue (USD Million) By Regions (2021-2032)
Table 11 Global Food Preservatives Market Share (%) By Regions (2021-2032)
Table 12 North America Food Preservatives Revenue (USD Million) By Country (2021-2032)
Table 13 Europe Food Preservatives Revenue (USD Million) By Country (2021-2032)
Table 14 Asia Pacific Food Preservatives Revenue (USD Million) By Country (2021-2032)
Table 15 South America Food Preservatives Revenue (USD Million) By Country (2021-2032)
Table 16 Middle East and Africa Food Preservatives Revenue (USD Million) By Region (2021-2032)
Table 17 North America Food Preservatives Revenue (USD Million) By Type (2021-2032)
Table 18 North America Food Preservatives Revenue (USD Million) By Application (2021-2032)
Table 19 North America Food Preservatives Revenue (USD Million) By Product (2021-2032)
Table 20 Europe Food Preservatives Revenue (USD Million) By Type (2021-2032)
Table 21 Europe Food Preservatives Revenue (USD Million) By Application (2021-2032)
Table 22 Europe Food Preservatives Revenue (USD Million) By Product (2021-2032)
Table 23 Asia Pacific Food Preservatives Revenue (USD Million) By Type (2021-2032)
Table 24 Asia Pacific Food Preservatives Revenue (USD Million) By Application (2021-2032)
Table 25 Asia Pacific Food Preservatives Revenue (USD Million) By Product (2021-2032)
Table 26 South America Food Preservatives Revenue (USD Million) By Type (2021-2032)
Table 27 South America Food Preservatives Revenue (USD Million) By Application (2021-2032)
Table 28 South America Food Preservatives Revenue (USD Million) By Product (2021-2032)
Table 29 Middle East and Africa Food Preservatives Revenue (USD Million) By Type (2021-2032)
Table 30 Middle East and Africa Food Preservatives Revenue (USD Million) By Application (2021-2032)
Table 31 Middle East and Africa Food Preservatives Revenue (USD Million) By Product (2021-2032)
LIST OF FIGURES
Figure 1. Market Scope
Figure 2. Pricing Forecasts Per Unit, 2023- 2032
Figure 3. Porter’s Five Forces
Figure 4. Global Food Preservatives Market Revenue (USD Million) By Regions (2021-2032)
Figure 5. Global Food Preservatives Market Share (%) By Regions (2023)
Figure 6. North America Food Preservatives Revenue (USD Million) By Country (2021-2032)
Figure 7. United States Food Preservatives Revenue (USD Million) By Country (2021-2032)
Figure 8. Canada Food Preservatives Revenue (USD Million) By Country (2021-2032)
Figure 9. Mexico Food Preservatives Revenue (USD Million) By Country (2021-2032)
Figure 10. Europe Food Preservatives Revenue (USD Million) By Country (2021-2032)
Figure 11. Germany Food Preservatives Revenue (USD Million) By Country (2021-2032)
Figure 12. France Food Preservatives Revenue (USD Million) By Country (2021-2032)
Figure 13. United Kingdom Food Preservatives Revenue (USD Million) By Country (2021-2032)
Figure 14. Spain Food Preservatives Revenue (USD Million) By Country (2021-2032)
Figure 15. Italy Food Preservatives Revenue (USD Million) By Country (2021-2032)
Figure 16. Russia Food Preservatives Revenue (USD Million) By Country (2021-2032)
Figure 17. Rest of Europe Food Preservatives Revenue (USD Million) By Country (2021-2032)
Figure 11. Asia Pacific Food Preservatives Revenue (USD Million) By Country (2021-2032)
Figure 12. China Food Preservatives Revenue (USD Million) By Country (2021-2032)
Figure 13. Japan Food Preservatives Revenue (USD Million) By Country (2021-2032)
Figure 14. India Food Preservatives Revenue (USD Million) By Country (2021-2032)
Figure 15. South Korea Food Preservatives Revenue (USD Million) By Country (2021-2032)
Figure 16. Australia Food Preservatives Revenue (USD Million) By Country (2021-2032)
Figure 17. South East Asia Food Preservatives Revenue (USD Million) By Country (2021-2032)
Figure 18. South America Food Preservatives Revenue (USD Million) By Country (2021-2032)
Figure 19. Brazil Food Preservatives Revenue (USD Million) By Country (2021-2032)
Figure 20. Argentina Food Preservatives Revenue (USD Million) By Country (2021-2032)
Figure 21. Rest of Asia Pacific Food Preservatives Revenue (USD Million) By Country (2021-2032)
Figure 22. Middle East and Africa Food Preservatives Revenue (USD Million) By Region (2021-2032)
Figure 23. Saudi Arabia Food Preservatives Revenue (USD Million) By Region (2021-2032)
Figure 24. The UAE Food Preservatives Revenue (USD Million) By Region (2021-2032)
Figure 25. Rest of Middle East Food Preservatives Revenue (USD Million) By Region (2021-2032)
Figure 26. South Africa Food Preservatives Revenue (USD Million) By Region (2021-2032)
Figure 27. Africa Food Preservatives Revenue (USD Million) By Region (2021-2032)
Figure 28. North America Food Preservatives Revenue (USD Million) By Type (2021-2032)
Figure 29. North America Food Preservatives Revenue (USD Million) By Application (2021-2032)
Figure 30. North America Food Preservatives Revenue (USD Million) By Product (2021-2032)
Figure 31. Europe Food Preservatives Revenue (USD Million) By Type (2021-2032)
Figure 32. Europe Food Preservatives Revenue (USD Million) By Application (2021-2032)
Figure 33. Europe Food Preservatives Revenue (USD Million) By Product (2021-2032)
Figure 34. Asia Pacific Food Preservatives Revenue (USD Million) By Type (2021-2032)
Figure 35. Asia Pacific Food Preservatives Revenue (USD Million) By Application (2021-2032)
Figure 36. Asia Pacific Food Preservatives Revenue (USD Million) By Product (2021-2032)
Figure 37. South America Food Preservatives Revenue (USD Million) By Type (2021-2032)
Figure 38. South America Food Preservatives Revenue (USD Million) By Application (2021-2032)
Figure 39. South America Food Preservatives Revenue (USD Million) By Product (2021-2032)
Figure 40. Middle East and Africa Food Preservatives Revenue (USD Million) By Type (2021-2032)
Figure 41. Middle East and Africa Food Preservatives Revenue (USD Million) By Application (2021-2032)
Figure 42. Middle East and Africa Food Preservatives Revenue (USD Million) By Product (2021-2032)
By Label
Clean Label
Conventional
By Type
Natural
-Edible Oil
-Rosemary Extracts
-Natamycin
-Vinegar
-Chitosan
-Others
Synthetic
-Propionates
-Sorbates
-Benzoates
-Others
By Function
Anti-microbial
Anti-oxidant
Others
By Application
Meat & Poultry Products
Bakery Products
Dairy Products
Beverages
Snacks
Others
Countries Analyzed
North America (US, Canada, Mexico)
Europe (Germany, UK, France, Spain, Italy, Russia, Rest of Europe)
Asia Pacific (China, India, Japan, South Korea, Australia, South East Asia, Rest of Asia)
South America (Brazil, Argentina, Rest of South America)
Middle East and Africa (Saudi Arabia, UAE, Rest of Middle East, South Africa, Egypt, Rest of Africa)
