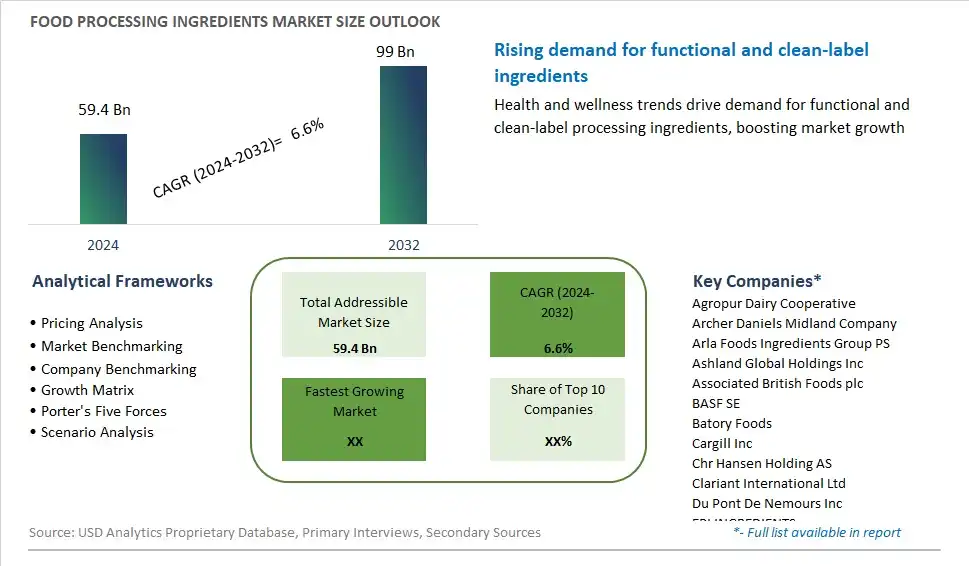
Global Food Processing Ingredients Market Size is valued at $59.4 Billion in 2024 and is forecast to register a growth rate (CAGR) of 6.6% to reach $99 Billion by 2032.
The global Food Processing Ingredients Market Comprehensive Study analyzes and forecasts the market size across 6 regions and 24 countries for diverse segments -By Type (Modified Starch & Starch Derivatives, Protein, Food Stabilizers, Emulsifiers, Yeast, Enzymes, Acidity Regulators, Antioxidants, Release Agents), By Form (Dry, Liquid), By Source (Natural, Synthetic), By Application (Bakery & Confectionery Products, Beverages, Convenience Foods, Dairy & Frozen Desserts, Others)
An Introduction to Food Processing Ingredients Market
The Food Processing Ingredients Market focuses on the supply of various additives and ingredients used in the manufacturing and processing of food products. These include preservatives, emulsifiers, enzymes, colorants, and flavor enhancers. The market is driven by the increasing demand for convenience foods, rising consumer preference for clean label and natural ingredients, and advancements in food processing technologies. Furthermore, the growing awareness about food safety and quality standards supports market growth.
Food Processing Ingredients Competitive Landscape
The market report analyses the leading companies in the industry including Agropur Dairy Cooperative, Archer Daniels Midland Company, Arla Foods Ingredients Group PS, Ashland Global Holdings Inc, Associated British Foods plc, BASF SE, Batory Foods, Cargill Inc, Chr Hansen Holding AS, Clariant International Ltd, Du Pont De Nemours Inc, EPI INGREDIENTS, Ingredion Inc, Kerry Group Plc, Koninklijke DSM NV, Olam International Ltd, PRIME Ingredients Inc, Puris, Solvay SA, Tate and Lyle Plc, and Others.
Food Processing Ingredients Market Dynamics
Food Processing Ingredients Market Trend: Clean Label and Natural Ingredients
One prominent trend in the food processing ingredients market is the increasing consumer demand for clean label and natural ingredients. Consumers are becoming more conscious about their food choices and are seeking products with minimal additives, preservatives, and artificial ingredients. This trend is driven by concerns over health and wellness, as well as a desire for transparency and authenticity in food products. As a result, food manufacturers are reformulating their products to include natural and recognizable ingredients, such as whole grains, plant-based proteins, natural sweeteners, and clean-label preservatives. This shift towards clean label and natural ingredients is influencing the development and sourcing of food processing ingredients, with suppliers focusing on offering a wide range of natural and organic options to meet consumer preferences.
Market Driver: Increasing Demand for Processed and Convenience Foods
A key driver propelling the growth of the food processing ingredients market is the rising demand for processed and convenience foods. With changing lifestyles, urbanization, and busy schedules, consumers are seeking convenient, ready-to-eat, and time-saving food options. Processed foods, including snacks, ready meals, bakery products, beverages, and packaged foods, have become integral parts of modern diets. Food manufacturers rely on a variety of ingredients to enhance the taste, texture, shelf-life, and nutritional profile of these processed foods. As consumer demand for processed and convenience foods continues to grow, there is a corresponding increase in the demand for food processing ingredients to support the formulation and production of these products.
Market Opportunity: Functional and Health-Promoting Ingredients
An opportunity within the food processing ingredients market lies in the growing demand for functional and health-promoting ingredients. With increasing awareness of health and wellness, consumers are seeking food products that offer additional health benefits beyond basic nutrition. Functional ingredients, such as probiotics, prebiotics, antioxidants, vitamins, minerals, and dietary fibers, are gaining popularity for their potential to support digestive health, immune function, heart health, and overall well-being. Additionally, there is growing interest in ingredients that address specific dietary preferences and health concerns, such as gluten-free, allergen-free, low-sodium, and plant-based alternatives. Suppliers of food processing ingredients have the opportunity to capitalize on this trend by offering a diverse range of functional and health-promoting ingredients that enable food manufacturers to develop innovative products that resonate with health-conscious consumers. By aligning with consumer preferences and offering ingredients that contribute to better nutrition and wellness, suppliers can differentiate themselves in the competitive food processing ingredients market.
Food Processing Ingredients Market Share Analysis: Modified Starch & Starch Derivatives held the dominant market share in 2024
In the Food Processing Ingredients market segmented by Type, the Modified Starch & Starch Derivatives segment is the largest category. This dominance is attributed to the widespread utilization of modified starches and starch derivatives across various food applications due to their versatility, functionality, and cost-effectiveness. Modified starches are widely used as thickeners, stabilizers, gelling agents, and texture modifiers in food processing, contributing to improved product consistency, texture, and shelf stability. Further, starch derivatives such as maltodextrin, dextrin, and glucose syrup find extensive applications in confectionery, bakery, dairy, and beverage industries for their role in enhancing sweetness, viscosity, and mouthfeel of food products. Additionally, modified starches and starch derivatives offer benefits such as improved freeze-thaw stability, resistance to high temperatures, and tolerance to acidic conditions, making them indispensable ingredients for food manufacturers seeking to optimize product formulations and meet consumer preferences. As food manufacturers prioritize product innovation, sensory appeal, and cost optimization, the Modified Starch & Starch Derivatives segment maintains its leadership position in the Food Processing Ingredients market, driving growth and innovation to meet evolving industry demands.
Food Processing Ingredients Market Share Analysis: Liquid Form Segment market is poised to register the fastest growth rae over the forecast period to 2032
In the Food Processing Ingredients market segmented by Form, the Liquid segment is the fastest-growing category. This accelerated growth is propelled by several factors, including the increasing demand for convenience, ease of handling, and improved processing efficiency in food manufacturing operations. Liquid form ingredients offer several advantages over dry counterparts, including faster dispersion, better solubility, and easier integration into food formulations, resulting in reduced processing times and enhanced product consistency. Further, liquid ingredients such as syrups, oils, and concentrates are preferred for their ability to impart specific flavors, textures, and functionalities to food products, meeting consumer preferences for diverse and innovative food offerings. Additionally, advancements in liquid ingredient technologies, such as microencapsulation and emulsification, further enhance their stability, shelf life, and application versatility, driving their adoption across various food sectors. As food manufacturers strive to streamline production processes, minimize waste, and meet evolving consumer demands, the Liquid Form segment experiences rapid growth, underscoring its significance in driving innovation and efficiency within the Food Processing Ingredients market.
Food Processing Ingredients Market Share Analysis: Natural Source held the dominant market share in 2024
In the Food Processing Ingredients market segmented by Source, the Natural segment is the largest category. This dominance is attributed to the growing consumer preference for clean label products and natural ingredients in food formulations. Natural ingredients, sourced from plants, animals, or minerals, are perceived as safer and healthier alternatives to synthetic counterparts due to their minimal processing and inherent nutritional benefits. Further, natural ingredients align with evolving consumer trends such as clean eating, sustainability, and transparency in food labeling. As a result, food manufacturers are increasingly reformulating their products to incorporate natural ingredients, driving the demand for natural-source processing ingredients across various food sectors. Additionally, stringent regulations and increasing consumer scrutiny regarding synthetic additives further bolster the market for natural-source ingredients. As stakeholders prioritize product innovation, quality, and consumer trust, the Natural Source segment maintains its leadership position in the Food Processing Ingredients market, driving growth and innovation to meet the evolving needs of the food industry.
Food Processing Ingredients Market Segmentation
By Type
Modified Starch & Starch Derivatives
Protein
Food Stabilizers
Emulsifiers
Yeast
Enzymes
Acidity Regulators
Antioxidants
Release Agents
By Form
Dry
Liquid
By Source
Natural
Synthetic
By Application
Bakery & Confectionery Products
Beverages
Convenience Foods
Dairy & Frozen Desserts
Others
Countries Analyzed
North America (US, Canada, Mexico)
Europe (Germany, UK, France, Spain, Italy, Russia, Rest of Europe)
Asia Pacific (China, India, Japan, South Korea, Australia, South East Asia, Rest of Asia)
South America (Brazil, Argentina, Rest of South America)
Middle East and Africa (Saudi Arabia, UAE, Rest of Middle East, South Africa, Egypt, Rest of Africa)
Food Processing Ingredients Companies Profiled in the Study
Agropur Dairy Cooperative
Archer Daniels Midland Company
Arla Foods Ingredients Group PS
Ashland Global Holdings Inc
Associated British Foods plc
BASF SE
Batory Foods
Cargill Inc
Chr Hansen Holding AS
Clariant International Ltd
Du Pont De Nemours Inc
EPI INGREDIENTS
Ingredion Inc
Kerry Group Plc
Koninklijke DSM NV
Olam International Ltd
PRIME Ingredients Inc
Puris
Solvay SA
Tate and Lyle Plc
*- List Not Exhaustive
Chapter 1. TABLE OF CONTENTS
Chapter 2. Introduction to Food Processing Ingredients Market
2.1. Market Overview
2.2. Key Statistics and Report Highlights
2.3. Scope of the Comprehensive Study
2.3.1. Market Definition
2.3.2 Countries and Regions Covered
2.3.3 Research Objective
2.3.4 Units, Currency, and Conversions
2.3.5 Industry Value Chain
2.4. Key Market Segments
2.5. Key Companies
2.6. Study Period
Chapter 3. Strategic Analysis Review
3.1. Food Processing Ingredients Pricing Analysis and Forecast
3.2. Porter’s Five Forces
3.3. Market Ecosystem
3.4. SWOT Analysis
3.5. Regulatory Scenario
3.3. Effects of Inflation, Russia-Ukraine War, moderating economic growth, and other macroeconomic factors
Chapter 4. Competitive Landscape
4.1. Market Share Analysis
4.1.1. Global Food Processing Ingredients Market Share by Company, 2023
4.1.2. Product Offerings of Leading Food Processing Ingredients Companies
4.2. Market Entropy
4.2.1. New Product Launches in the Industry
4.2.2. Mergers, Acquisitions, Joint ventures, and Partnerships
4.3. Key Strategies and Best Practices
Chapter 5. Global Market Projections: Best, Reference, and Low Case Scenarios
5.1. Growth Analysis- Case Scenario Definitions
5.2. Low Growth Case Scenario Forecasts
5.3. Reference Growth Case Scenario Forecasts
5.4. High Growth Case Scenario Forecasts
Chapter 6. Market Dynamics
6.1. Food Processing Ingredients Market Drivers
6.2. Food Processing Ingredients Market Challenges
6.6. Food Processing Ingredients Market Opportunities
6.4. Food Processing Ingredients Market Trends
Chapter 7. Global Food Processing Ingredients Market Outlook Trends
7.1. Global Food Processing Ingredients Revenue (USD Million) and CAGR (%) by Type (2021-2032)
7.2. Global Food Processing Ingredients Revenue (USD Million) and CAGR (%) by Application (2021-2032)
7.3. Global Food Processing Ingredients Revenue (USD Million) and CAGR (%) by Product (2021-2032)
By Type
Modified Starch & Starch Derivatives
Protein
Food Stabilizers
Emulsifiers
Yeast
Enzymes
Acidity Regulators
Antioxidants
Release Agents
By Form
Dry
Liquid
By Source
Natural
Synthetic
By Application
Bakery & Confectionery Products
Beverages
Convenience Foods
Dairy & Frozen Desserts
Others
Chapter 8. Global Food Processing Ingredients Regional Analysis and Outlook
8.1. Global Food Processing Ingredients Revenue (USD Million) By Regions (2021- 2032)
8.2. North America Food Processing Ingredients Revenue (USD Million) by Country (2021-2032)
8.2.1. United States Food Processing Ingredients Regional Analysis and Outlook
8.2.2. Canada Food Processing Ingredients Regional Analysis and Outlook
8.2.3. Mexico Food Processing Ingredients Regional Analysis and Outlook
8.3. Europe Food Processing Ingredients Revenue (USD Million), by Country (2021-2032)
8.3.1. Germany Food Processing Ingredients Regional Analysis and Outlook
8.3.2. France Food Processing Ingredients Regional Analysis and Outlook
8.3.3. United Kingdom Food Processing Ingredients Regional Analysis and Outlook
8.3.4. Spain Food Processing Ingredients Regional Analysis and Outlook
8.3.5. Italy Food Processing Ingredients Regional Analysis and Outlook
8.3.6. Russia Food Processing Ingredients Regional Analysis and Outlook
8.3.7. Rest of Europe Food Processing Ingredients Regional Analysis and Outlook
8.4. Asia Pacific Food Processing Ingredients Revenue (USD Million) by Country (2021-2032)
8.4.1. China Food Processing Ingredients Regional Analysis and Outlook
8.4.2. Japan Food Processing Ingredients Regional Analysis and Outlook
8.4.3. India Food Processing Ingredients Regional Analysis and Outlook
8.4.4. South Korea Food Processing Ingredients Regional Analysis and Outlook
8.4.5. Australia Food Processing Ingredients Regional Analysis and Outlook
8.4.6. South East Asia Food Processing Ingredients Regional Analysis and Outlook
8.4.7. Rest of Asia Pacific Food Processing Ingredients Regional Analysis and Outlook
8.5. South America Food Processing Ingredients Revenue (USD Million), by Country (2021-2032)
8.5.1. Brazil Food Processing Ingredients Regional Analysis and Outlook
8.5.2. Argentina Food Processing Ingredients Regional Analysis and Outlook
8.5.3. Rest of South America Food Processing Ingredients Regional Analysis and Outlook
8.6. Middle East and Africa Food Processing Ingredients Revenue (USD Million) by Country (2021-2032)
8.6.1. Middle East Food Processing Ingredients Regional Analysis and Outlook
8.6.2. Africa Food Processing Ingredients Regional Analysis and Outlook
Chapter 9. North America Food Processing Ingredients Analysis and Outlook
9.1. North America Food Processing Ingredients Revenue (USD Million) by Segments (2021-2032)
9.1.1. North America Food Processing Ingredients Revenue (USD Million) by Type (2021-2032)
9.1.2. North America Food Processing Ingredients Revenue (USD Million) by Application (2021-2032)
9.1.3. North America Food Processing Ingredients Revenue (USD Million) by Product (2021-2032)
By Type
Modified Starch & Starch Derivatives
Protein
Food Stabilizers
Emulsifiers
Yeast
Enzymes
Acidity Regulators
Antioxidants
Release Agents
By Form
Dry
Liquid
By Source
Natural
Synthetic
By Application
Bakery & Confectionery Products
Beverages
Convenience Foods
Dairy & Frozen Desserts
Others
Chapter 10. Europe Food Processing Ingredients Analysis and Outlook
10.1. Europe Food Processing Ingredients Revenue (USD Million), by Segments (USD Million) (2021-2032)
10.1.1. Europe Food Processing Ingredients Revenue (USD Million) by Type (2021-2032)
10.1.2. Europe Food Processing Ingredients Revenue (USD Million) by Application (2021-2032)
10.1.3. Europe Food Processing Ingredients Revenue (USD Million) by Product (2021-2032)
By Type
Modified Starch & Starch Derivatives
Protein
Food Stabilizers
Emulsifiers
Yeast
Enzymes
Acidity Regulators
Antioxidants
Release Agents
By Form
Dry
Liquid
By Source
Natural
Synthetic
By Application
Bakery & Confectionery Products
Beverages
Convenience Foods
Dairy & Frozen Desserts
Others
Chapter 11. Asia Pacific Food Processing Ingredients Analysis and Outlook
11.1. Asia Pacific Food Processing Ingredients Revenue (USD Million), and Revenue (USD Million) by Segments (2021-2032)
11.1.1. Asia Pacific Food Processing Ingredients Revenue (USD Million) by Type (2021-2032)
11.1.2. Asia Pacific Food Processing Ingredients Revenue (USD Million) by Application (2021-2032)
11.1.3. Asia Pacific Food Processing Ingredients Revenue (USD Million) by Product (2021-2032)
By Type
Modified Starch & Starch Derivatives
Protein
Food Stabilizers
Emulsifiers
Yeast
Enzymes
Acidity Regulators
Antioxidants
Release Agents
By Form
Dry
Liquid
By Source
Natural
Synthetic
By Application
Bakery & Confectionery Products
Beverages
Convenience Foods
Dairy & Frozen Desserts
Others
Chapter 12. South America Food Processing Ingredients Analysis and Outlook
12.1. South America Food Processing Ingredients Revenue (USD Million), by Segments (2021-2032)
12.1.1. South America Food Processing Ingredients Revenue (USD Million) by Type (2021-2032)
12.1.2. South America Food Processing Ingredients Revenue (USD Million) by Application (2021-2032)
12.1.3. South America Food Processing Ingredients Revenue (USD Million) by Product (2021-2032)
By Type
Modified Starch & Starch Derivatives
Protein
Food Stabilizers
Emulsifiers
Yeast
Enzymes
Acidity Regulators
Antioxidants
Release Agents
By Form
Dry
Liquid
By Source
Natural
Synthetic
By Application
Bakery & Confectionery Products
Beverages
Convenience Foods
Dairy & Frozen Desserts
Others
Chapter 13. Middle East and Africa Food Processing Ingredients Analysis and Outlook
13.1. Middle East and Africa Food Processing Ingredients Revenue (USD Million), by Segments (2021-2032)
13.1.1. Middle East and Africa Food Processing Ingredients Revenue (USD Million) by Type (2021-2032)
13.1.2. Middle East and Africa Food Processing Ingredients Revenue (USD Million) by Application (2021-2032)
13.1.3. Middle East and Africa Food Processing Ingredients Revenue (USD Million) by Product (2021-2032)
By Type
Modified Starch & Starch Derivatives
Protein
Food Stabilizers
Emulsifiers
Yeast
Enzymes
Acidity Regulators
Antioxidants
Release Agents
By Form
Dry
Liquid
By Source
Natural
Synthetic
By Application
Bakery & Confectionery Products
Beverages
Convenience Foods
Dairy & Frozen Desserts
Others
Chapter 14. Food Processing Ingredients Company Profiles
14.1 Business Overview
14.2 Product Profiles
14.3 SWOT Profiles
14.5 Recent Developments
14.6 Financial Profile
List of Companies
Agropur Dairy Cooperative
Archer Daniels Midland Company
Arla Foods Ingredients Group PS
Ashland Global Holdings Inc
Associated British Foods plc
BASF SE
Batory Foods
Cargill Inc
Chr Hansen Holding AS
Clariant International Ltd
Du Pont De Nemours Inc
EPI INGREDIENTS
Ingredion Inc
Kerry Group Plc
Koninklijke DSM NV
Olam International Ltd
PRIME Ingredients Inc
Puris
Solvay SA
Tate and Lyle Plc
15. Methodology and Data Sources
15.1 Customization Offerings
15.2 Subscription Services
15.3 Related Reports
15.4 Publisher Expertise
LIST OF TABLES
Table 1 Market Segmentation Analysis
Table 2 Global Food Processing Ingredients Market Share of Leading Companies, 2023
Table 3 Product Offerings of Leading Companies
Table 4 Low Growth Scenario Forecasts
Table 5 Reference Case Growth Scenario
Table 6 High Growth Case Scenario
Table 7 Global Food Processing Ingredients Revenue (USD Million) And CAGR (%) By Type (2021-2032)
Table 8 Global Food Processing Ingredients Revenue (USD Million) And CAGR (%) By Application (2021-2032)
Table 9 Global Food Processing Ingredients Revenue (USD Million) And CAGR (%) By Product (2021-2032)
Table 10 Global Food Processing Ingredients Market Revenue (USD Million) By Regions (2021-2032)
Table 11 Global Food Processing Ingredients Market Share (%) By Regions (2021-2032)
Table 12 North America Food Processing Ingredients Revenue (USD Million) By Country (2021-2032)
Table 13 Europe Food Processing Ingredients Revenue (USD Million) By Country (2021-2032)
Table 14 Asia Pacific Food Processing Ingredients Revenue (USD Million) By Country (2021-2032)
Table 15 South America Food Processing Ingredients Revenue (USD Million) By Country (2021-2032)
Table 16 Middle East and Africa Food Processing Ingredients Revenue (USD Million) By Region (2021-2032)
Table 17 North America Food Processing Ingredients Revenue (USD Million) By Type (2021-2032)
Table 18 North America Food Processing Ingredients Revenue (USD Million) By Application (2021-2032)
Table 19 North America Food Processing Ingredients Revenue (USD Million) By Product (2021-2032)
Table 20 Europe Food Processing Ingredients Revenue (USD Million) By Type (2021-2032)
Table 21 Europe Food Processing Ingredients Revenue (USD Million) By Application (2021-2032)
Table 22 Europe Food Processing Ingredients Revenue (USD Million) By Product (2021-2032)
Table 23 Asia Pacific Food Processing Ingredients Revenue (USD Million) By Type (2021-2032)
Table 24 Asia Pacific Food Processing Ingredients Revenue (USD Million) By Application (2021-2032)
Table 25 Asia Pacific Food Processing Ingredients Revenue (USD Million) By Product (2021-2032)
Table 26 South America Food Processing Ingredients Revenue (USD Million) By Type (2021-2032)
Table 27 South America Food Processing Ingredients Revenue (USD Million) By Application (2021-2032)
Table 28 South America Food Processing Ingredients Revenue (USD Million) By Product (2021-2032)
Table 29 Middle East and Africa Food Processing Ingredients Revenue (USD Million) By Type (2021-2032)
Table 30 Middle East and Africa Food Processing Ingredients Revenue (USD Million) By Application (2021-2032)
Table 31 Middle East and Africa Food Processing Ingredients Revenue (USD Million) By Product (2021-2032)
LIST OF FIGURES
Figure 1. Market Scope
Figure 2. Pricing Forecasts Per Unit, 2023- 2032
Figure 3. Porter’s Five Forces
Figure 4. Global Food Processing Ingredients Market Revenue (USD Million) By Regions (2021-2032)
Figure 5. Global Food Processing Ingredients Market Share (%) By Regions (2023)
Figure 6. North America Food Processing Ingredients Revenue (USD Million) By Country (2021-2032)
Figure 7. United States Food Processing Ingredients Revenue (USD Million) By Country (2021-2032)
Figure 8. Canada Food Processing Ingredients Revenue (USD Million) By Country (2021-2032)
Figure 9. Mexico Food Processing Ingredients Revenue (USD Million) By Country (2021-2032)
Figure 10. Europe Food Processing Ingredients Revenue (USD Million) By Country (2021-2032)
Figure 11. Germany Food Processing Ingredients Revenue (USD Million) By Country (2021-2032)
Figure 12. France Food Processing Ingredients Revenue (USD Million) By Country (2021-2032)
Figure 13. United Kingdom Food Processing Ingredients Revenue (USD Million) By Country (2021-2032)
Figure 14. Spain Food Processing Ingredients Revenue (USD Million) By Country (2021-2032)
Figure 15. Italy Food Processing Ingredients Revenue (USD Million) By Country (2021-2032)
Figure 16. Russia Food Processing Ingredients Revenue (USD Million) By Country (2021-2032)
Figure 17. Rest of Europe Food Processing Ingredients Revenue (USD Million) By Country (2021-2032)
Figure 11. Asia Pacific Food Processing Ingredients Revenue (USD Million) By Country (2021-2032)
Figure 12. China Food Processing Ingredients Revenue (USD Million) By Country (2021-2032)
Figure 13. Japan Food Processing Ingredients Revenue (USD Million) By Country (2021-2032)
Figure 14. India Food Processing Ingredients Revenue (USD Million) By Country (2021-2032)
Figure 15. South Korea Food Processing Ingredients Revenue (USD Million) By Country (2021-2032)
Figure 16. Australia Food Processing Ingredients Revenue (USD Million) By Country (2021-2032)
Figure 17. South East Asia Food Processing Ingredients Revenue (USD Million) By Country (2021-2032)
Figure 18. South America Food Processing Ingredients Revenue (USD Million) By Country (2021-2032)
Figure 19. Brazil Food Processing Ingredients Revenue (USD Million) By Country (2021-2032)
Figure 20. Argentina Food Processing Ingredients Revenue (USD Million) By Country (2021-2032)
Figure 21. Rest of Asia Pacific Food Processing Ingredients Revenue (USD Million) By Country (2021-2032)
Figure 22. Middle East and Africa Food Processing Ingredients Revenue (USD Million) By Region (2021-2032)
Figure 23. Saudi Arabia Food Processing Ingredients Revenue (USD Million) By Region (2021-2032)
Figure 24. The UAE Food Processing Ingredients Revenue (USD Million) By Region (2021-2032)
Figure 25. Rest of Middle East Food Processing Ingredients Revenue (USD Million) By Region (2021-2032)
Figure 26. South Africa Food Processing Ingredients Revenue (USD Million) By Region (2021-2032)
Figure 27. Africa Food Processing Ingredients Revenue (USD Million) By Region (2021-2032)
Figure 28. North America Food Processing Ingredients Revenue (USD Million) By Type (2021-2032)
Figure 29. North America Food Processing Ingredients Revenue (USD Million) By Application (2021-2032)
Figure 30. North America Food Processing Ingredients Revenue (USD Million) By Product (2021-2032)
Figure 31. Europe Food Processing Ingredients Revenue (USD Million) By Type (2021-2032)
Figure 32. Europe Food Processing Ingredients Revenue (USD Million) By Application (2021-2032)
Figure 33. Europe Food Processing Ingredients Revenue (USD Million) By Product (2021-2032)
Figure 34. Asia Pacific Food Processing Ingredients Revenue (USD Million) By Type (2021-2032)
Figure 35. Asia Pacific Food Processing Ingredients Revenue (USD Million) By Application (2021-2032)
Figure 36. Asia Pacific Food Processing Ingredients Revenue (USD Million) By Product (2021-2032)
Figure 37. South America Food Processing Ingredients Revenue (USD Million) By Type (2021-2032)
Figure 38. South America Food Processing Ingredients Revenue (USD Million) By Application (2021-2032)
Figure 39. South America Food Processing Ingredients Revenue (USD Million) By Product (2021-2032)
Figure 40. Middle East and Africa Food Processing Ingredients Revenue (USD Million) By Type (2021-2032)
Figure 41. Middle East and Africa Food Processing Ingredients Revenue (USD Million) By Application (2021-2032)
Figure 42. Middle East and Africa Food Processing Ingredients Revenue (USD Million) By Product (2021-2032)
By Type
Modified Starch & Starch Derivatives
Protein
Food Stabilizers
Emulsifiers
Yeast
Enzymes
Acidity Regulators
Antioxidants
Release Agents
By Form
Dry
Liquid
By Source
Natural
Synthetic
By Application
Bakery & Confectionery Products
Beverages
Convenience Foods
Dairy & Frozen Desserts
Others
Countries Analyzed
North America (US, Canada, Mexico)
Europe (Germany, UK, France, Spain, Italy, Russia, Rest of Europe)
Asia Pacific (China, India, Japan, South Korea, Australia, South East Asia, Rest of Asia)
South America (Brazil, Argentina, Rest of South America)
Middle East and Africa (Saudi Arabia, UAE, Rest of Middle East, South Africa, Egypt, Rest of Africa)
