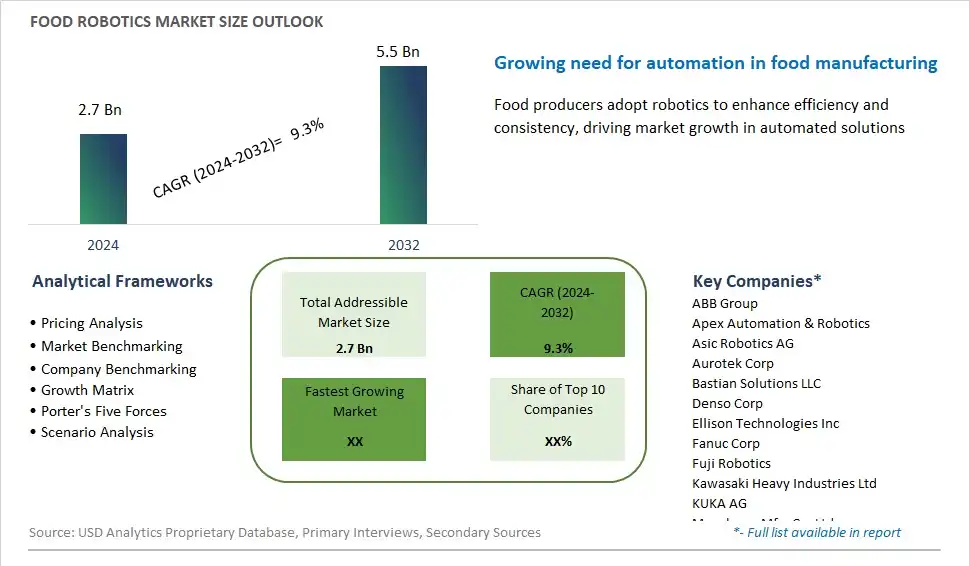
Global Food Robotics Market Size is valued at $2.7 Billion in 2024 and is forecast to register a growth rate (CAGR) of 9.3% to reach $5.5 Billion by 2032.
The global Food Robotics Market Comprehensive Study analyzes and forecasts the market size across 6 regions and 24 countries for diverse segments -By Type (Articulated, Cartesian, Scara, Parallel, Cylindrical, Collaborative, Others), By Payload (High, Medium, Low), By Function (Palletizing, Packaging, Repackaging, Picking, Processing, Others), By Application (Meat, Poultry, Seafood, Processed Food, Dairy Products, Fruits & Vegetables, Beverage, Bakery & Confectionery Products, Others)
An Introduction to Food Robotics Market
Food robotics involves the use of robotic systems and automation technologies to perform tasks such as handling, processing, packaging, and quality control in food manufacturing and processing operations in 2024. With increasing labor costs, workforce shortages, and demand for efficiency and consistency, food manufacturers are turning to robotics solutions to improve productivity, quality, and competitiveness. Food robotics technologies encompass a wide range of applications, including robotic arms, pick-and-place systems, palletizing robots, and autonomous vehicles, that streamline operations and reduce reliance on manual labor. Whether sorting ingredients, inspecting products, or palletizing finished goods, robotic systems offer precision, speed, and flexibility, enabling manufacturers to meet production quotas and customer demands with agility and efficiency. With advancements in robotics technology, such as machine learning, computer vision, and collaborative robotics, food manufacturers are deploying robotic systems that are more intelligent, adaptable, and integrated, enabling seamless human-robot collaboration and enhancing overall operational efficiency. As the food industry embraces digital transformation and Industry 4.0 principles, the market for food robotics is expected to expand, driven by investments in technology, training, and infrastructure that enable manufacturers to innovate and thrive in a rapidly evolving market landscape.
Food Robotics Competitive Landscape
The market report analyses the leading companies in the industry including ABB Group, Apex Automation & Robotics, Asic Robotics AG, Aurotek Corp, Bastian Solutions LLC, Denso Corp, Ellison Technologies Inc, Fanuc Corp, Fuji Robotics, Kawasaki Heavy Industries Ltd, KUKA AG, Mayekawa Mfg. Co. Ltd, Mitsubishi Electric Corp, Moley Robotics, Nachi-Fujikoshi Corp, OMRON Corp, Rockwell Automation Inc, Schunk GmbH, Staubli International AG, Universal Robots A/S, Yasakawa Electric Corp, and Others.
Food Robotics Market Dynamics
Food Robotics Market Trend: Automation and Robotics Integration in Food Industry
One prominent trend in the food robotics market is the increasing integration of automation and robotics technology in the food industry. As the food industry strives for greater efficiency, productivity, and cost-effectiveness, automation solutions, including robotics, are being adopted across various stages of food processing, packaging, and handling. Robotics systems are increasingly utilized for tasks such as pick-and-place operations, sorting, packaging, palletizing, and quality control. Advancements in robotics technology, including improved sensing capabilities, machine learning algorithms, and collaborative robotics (cobots), are driving the adoption of robotics in the food industry. This trend towards automation and robotics integration is reshaping food manufacturing processes, leading to improved speed, accuracy, consistency, and safety in food production facilities.
Market Driver: Demand for Labor Cost Reduction and Efficiency Improvement
A key driver fueling the growth of the food robotics market is the increasing demand for labor cost reduction and efficiency improvement in food processing and manufacturing operations. With rising labor costs, labor shortages, and the need for higher throughput and productivity, food manufacturers are turning to robotics solutions to streamline their operations. Robotics systems can perform repetitive and labor-intensive tasks with greater speed, precision, and consistency than human workers, leading to increased operational efficiency and reduced labor costs over time. By automating tasks that are traditionally performed manually, food manufacturers can optimize their production processes, minimize errors, reduce waste, and enhance overall operational performance.
Market Opportunity: Customized Robotics Solutions for Food Industry Challenges
An opportunity within the food robotics market lies in the development and provision of customized robotics solutions tailored to address specific challenges and requirements in the food industry. While there is a growing adoption of robotics in food manufacturing, many food processing facilities have unique operational needs, product characteristics, and regulatory requirements that may require customized robotics solutions. Suppliers of food robotics systems have the opportunity to collaborate closely with food manufacturers to understand their specific challenges and develop bespoke robotics solutions that align with their production goals, facility layout, product specifications, and regulatory compliance needs. By offering customized robotics solutions, suppliers can differentiate themselves in the market and provide added value to food manufacturers seeking tailored automation solutions to optimize their operations and stay competitive in the evolving food industry landscape.
Food Robotics Market Share Analysis: Articulated held the dominant market share in 2024
In the Food Robotics market segmented by Type, the Articulated segment is the largest category. This dominance is attributed to the versatility, flexibility, and precision offered by articulated robots in various food processing and handling tasks. Articulated robots feature multiple joints resembling a human arm, allowing them to maneuver in complex motions and reach different points within a workspace with high degrees of freedom. These robots are widely utilized in food manufacturing facilities for tasks such as packaging, palletizing, sorting, cutting, and handling delicate food items. Further, articulated robots can be equipped with specialized end-of-arm tools and grippers tailored to specific food products, enhancing their adaptability to diverse processing requirements. Additionally, advancements in robotic technology, including sensors, vision systems, and AI algorithms, further enhance the capabilities and efficiency of articulated robots in food production environments. As food manufacturers prioritize automation, efficiency, and food safety, the Articulated Type segment maintains its leadership position in the Food Robotics market, driving growth and innovation to meet the evolving needs of the food industry.
Food Robotics Market Share Analysis: Medium Payload market is poised to register the fastest growth rae over the forecast period to 2032
In the Food Robotics market segmented by Payload, the Medium segment is the fastest-growing category. This accelerated growth is propelled by several factors, including the increasing adoption of medium payload robots across various food processing and handling applications due to their versatility, affordability, and scalability. Medium payload robots offer a balance between payload capacity and agility, making them suitable for a wide range of tasks such as packaging, palletizing, sorting, and assembly in food manufacturing facilities. Further, medium payload robots are often more cost-effective than their high payload counterparts, making them accessible to a broader range of food manufacturers, including small and medium-sized enterprises. Additionally, advancements in robotic technology have led to the development of compact and lightweight medium payload robots with improved speed, accuracy, and safety features, further driving their adoption in food production environments. As food manufacturers seek to enhance productivity, efficiency, and flexibility in their operations, the Medium Payload segment experiences rapid growth, underscoring its significance in driving innovation and automation within the Food Robotics market.
Food Robotics Market Share Analysis: Palletizing Function held the dominant market share in 2024
In the Food Robotics market segmented by Function, the Palletizing segment is the largest category. This dominance is attributed to the critical role of palletizing robots in automating the handling and stacking of products onto pallets in food manufacturing and distribution facilities. Palletizing robots offer significant benefits such as increased efficiency, reduced labor costs, and improved workplace safety compared to manual palletizing methods. These robots can handle a wide variety of product sizes, shapes, and weights, making them versatile solutions for palletizing tasks across different food sectors. Further, advancements in robotic technology have led to the development of high-speed and high-precision palletizing robots equipped with advanced grippers and vision systems, further enhancing their capabilities and reliability. Additionally, as food manufacturers seek to streamline logistics operations, optimize warehouse space, and meet increasing demand for packaged goods, the adoption of palletizing robots continues to grow. As a result, the Palletizing Function segment maintains its leadership position in the Food Robotics market, driving growth and innovation to meet the evolving needs of the food industry.
Food Robotics Market Segmentation
By Type
Articulated
Cartesian
Scara
Parallel
Cylindrical
Collaborative
Others
By Payload
High
Medium
Low
By Function
Palletizing
Packaging
Repackaging
Picking
Processing
Others
By Application
Meat
Poultry
Seafood
Processed Food
Dairy Products
Fruits & Vegetables
Beverage
Bakery & Confectionery Products
Others
Countries Analyzed
North America (US, Canada, Mexico)
Europe (Germany, UK, France, Spain, Italy, Russia, Rest of Europe)
Asia Pacific (China, India, Japan, South Korea, Australia, South East Asia, Rest of Asia)
South America (Brazil, Argentina, Rest of South America)
Middle East and Africa (Saudi Arabia, UAE, Rest of Middle East, South Africa, Egypt, Rest of Africa)
Food Robotics Companies Profiled in the Study
ABB Group
Apex Automation & Robotics
Asic Robotics AG
Aurotek Corp
Bastian Solutions LLC
Denso Corp
Ellison Technologies Inc
Fanuc Corp
Fuji Robotics
Kawasaki Heavy Industries Ltd
KUKA AG
Mayekawa Mfg. Co. Ltd
Mitsubishi Electric Corp
Moley Robotics
Nachi-Fujikoshi Corp
OMRON Corp
Rockwell Automation Inc
Schunk GmbH
Staubli International AG
Universal Robots A/S
Yasakawa Electric Corp
*- List Not Exhaustive
Chapter 1. TABLE OF CONTENTS
Chapter 2. Introduction to Food Robotics Market
2.1. Market Overview
2.2. Key Statistics and Report Highlights
2.3. Scope of the Comprehensive Study
2.3.1. Market Definition
2.3.2 Countries and Regions Covered
2.3.3 Research Objective
2.3.4 Units, Currency, and Conversions
2.3.5 Industry Value Chain
2.4. Key Market Segments
2.5. Key Companies
2.6. Study Period
Chapter 3. Strategic Analysis Review
3.1. Food Robotics Pricing Analysis and Forecast
3.2. Porter’s Five Forces
3.3. Market Ecosystem
3.4. SWOT Analysis
3.5. Regulatory Scenario
3.3. Effects of Inflation, Russia-Ukraine War, moderating economic growth, and other macroeconomic factors
Chapter 4. Competitive Landscape
4.1. Market Share Analysis
4.1.1. Global Food Robotics Market Share by Company, 2023
4.1.2. Product Offerings of Leading Food Robotics Companies
4.2. Market Entropy
4.2.1. New Product Launches in the Industry
4.2.2. Mergers, Acquisitions, Joint ventures, and Partnerships
4.3. Key Strategies and Best Practices
Chapter 5. Global Market Projections: Best, Reference, and Low Case Scenarios
5.1. Growth Analysis- Case Scenario Definitions
5.2. Low Growth Case Scenario Forecasts
5.3. Reference Growth Case Scenario Forecasts
5.4. High Growth Case Scenario Forecasts
Chapter 6. Market Dynamics
6.1. Food Robotics Market Drivers
6.2. Food Robotics Market Challenges
6.6. Food Robotics Market Opportunities
6.4. Food Robotics Market Trends
Chapter 7. Global Food Robotics Market Outlook Trends
7.1. Global Food Robotics Revenue (USD Million) and CAGR (%) by Type (2021-2032)
7.2. Global Food Robotics Revenue (USD Million) and CAGR (%) by Application (2021-2032)
7.3. Global Food Robotics Revenue (USD Million) and CAGR (%) by Product (2021-2032)
By Type
Articulated
Cartesian
Scara
Parallel
Cylindrical
Collaborative
Others
By Payload
High
Medium
Low
By Function
Palletizing
Packaging
Repackaging
Picking
Processing
Others
By Application
Meat
Poultry
Seafood
Processed Food
Dairy Products
Fruits & Vegetables
Beverage
Bakery & Confectionery Products
Others
Chapter 8. Global Food Robotics Regional Analysis and Outlook
8.1. Global Food Robotics Revenue (USD Million) By Regions (2021- 2032)
8.2. North America Food Robotics Revenue (USD Million) by Country (2021-2032)
8.2.1. United States Food Robotics Regional Analysis and Outlook
8.2.2. Canada Food Robotics Regional Analysis and Outlook
8.2.3. Mexico Food Robotics Regional Analysis and Outlook
8.3. Europe Food Robotics Revenue (USD Million), by Country (2021-2032)
8.3.1. Germany Food Robotics Regional Analysis and Outlook
8.3.2. France Food Robotics Regional Analysis and Outlook
8.3.3. United Kingdom Food Robotics Regional Analysis and Outlook
8.3.4. Spain Food Robotics Regional Analysis and Outlook
8.3.5. Italy Food Robotics Regional Analysis and Outlook
8.3.6. Russia Food Robotics Regional Analysis and Outlook
8.3.7. Rest of Europe Food Robotics Regional Analysis and Outlook
8.4. Asia Pacific Food Robotics Revenue (USD Million) by Country (2021-2032)
8.4.1. China Food Robotics Regional Analysis and Outlook
8.4.2. Japan Food Robotics Regional Analysis and Outlook
8.4.3. India Food Robotics Regional Analysis and Outlook
8.4.4. South Korea Food Robotics Regional Analysis and Outlook
8.4.5. Australia Food Robotics Regional Analysis and Outlook
8.4.6. South East Asia Food Robotics Regional Analysis and Outlook
8.4.7. Rest of Asia Pacific Food Robotics Regional Analysis and Outlook
8.5. South America Food Robotics Revenue (USD Million), by Country (2021-2032)
8.5.1. Brazil Food Robotics Regional Analysis and Outlook
8.5.2. Argentina Food Robotics Regional Analysis and Outlook
8.5.3. Rest of South America Food Robotics Regional Analysis and Outlook
8.6. Middle East and Africa Food Robotics Revenue (USD Million) by Country (2021-2032)
8.6.1. Middle East Food Robotics Regional Analysis and Outlook
8.6.2. Africa Food Robotics Regional Analysis and Outlook
Chapter 9. North America Food Robotics Analysis and Outlook
9.1. North America Food Robotics Revenue (USD Million) by Segments (2021-2032)
9.1.1. North America Food Robotics Revenue (USD Million) by Type (2021-2032)
9.1.2. North America Food Robotics Revenue (USD Million) by Application (2021-2032)
9.1.3. North America Food Robotics Revenue (USD Million) by Product (2021-2032)
By Type
Articulated
Cartesian
Scara
Parallel
Cylindrical
Collaborative
Others
By Payload
High
Medium
Low
By Function
Palletizing
Packaging
Repackaging
Picking
Processing
Others
By Application
Meat
Poultry
Seafood
Processed Food
Dairy Products
Fruits & Vegetables
Beverage
Bakery & Confectionery Products
Others
Chapter 10. Europe Food Robotics Analysis and Outlook
10.1. Europe Food Robotics Revenue (USD Million), by Segments (USD Million) (2021-2032)
10.1.1. Europe Food Robotics Revenue (USD Million) by Type (2021-2032)
10.1.2. Europe Food Robotics Revenue (USD Million) by Application (2021-2032)
10.1.3. Europe Food Robotics Revenue (USD Million) by Product (2021-2032)
By Type
Articulated
Cartesian
Scara
Parallel
Cylindrical
Collaborative
Others
By Payload
High
Medium
Low
By Function
Palletizing
Packaging
Repackaging
Picking
Processing
Others
By Application
Meat
Poultry
Seafood
Processed Food
Dairy Products
Fruits & Vegetables
Beverage
Bakery & Confectionery Products
Others
Chapter 11. Asia Pacific Food Robotics Analysis and Outlook
11.1. Asia Pacific Food Robotics Revenue (USD Million), and Revenue (USD Million) by Segments (2021-2032)
11.1.1. Asia Pacific Food Robotics Revenue (USD Million) by Type (2021-2032)
11.1.2. Asia Pacific Food Robotics Revenue (USD Million) by Application (2021-2032)
11.1.3. Asia Pacific Food Robotics Revenue (USD Million) by Product (2021-2032)
By Type
Articulated
Cartesian
Scara
Parallel
Cylindrical
Collaborative
Others
By Payload
High
Medium
Low
By Function
Palletizing
Packaging
Repackaging
Picking
Processing
Others
By Application
Meat
Poultry
Seafood
Processed Food
Dairy Products
Fruits & Vegetables
Beverage
Bakery & Confectionery Products
Others
Chapter 12. South America Food Robotics Analysis and Outlook
12.1. South America Food Robotics Revenue (USD Million), by Segments (2021-2032)
12.1.1. South America Food Robotics Revenue (USD Million) by Type (2021-2032)
12.1.2. South America Food Robotics Revenue (USD Million) by Application (2021-2032)
12.1.3. South America Food Robotics Revenue (USD Million) by Product (2021-2032)
By Type
Articulated
Cartesian
Scara
Parallel
Cylindrical
Collaborative
Others
By Payload
High
Medium
Low
By Function
Palletizing
Packaging
Repackaging
Picking
Processing
Others
By Application
Meat
Poultry
Seafood
Processed Food
Dairy Products
Fruits & Vegetables
Beverage
Bakery & Confectionery Products
Others
Chapter 13. Middle East and Africa Food Robotics Analysis and Outlook
13.1. Middle East and Africa Food Robotics Revenue (USD Million), by Segments (2021-2032)
13.1.1. Middle East and Africa Food Robotics Revenue (USD Million) by Type (2021-2032)
13.1.2. Middle East and Africa Food Robotics Revenue (USD Million) by Application (2021-2032)
13.1.3. Middle East and Africa Food Robotics Revenue (USD Million) by Product (2021-2032)
By Type
Articulated
Cartesian
Scara
Parallel
Cylindrical
Collaborative
Others
By Payload
High
Medium
Low
By Function
Palletizing
Packaging
Repackaging
Picking
Processing
Others
By Application
Meat
Poultry
Seafood
Processed Food
Dairy Products
Fruits & Vegetables
Beverage
Bakery & Confectionery Products
Others
Chapter 14. Food Robotics Company Profiles
14.1 Business Overview
14.2 Product Profiles
14.3 SWOT Profiles
14.5 Recent Developments
14.6 Financial Profile
List of Companies
ABB Group
Apex Automation & Robotics
Asic Robotics AG
Aurotek Corp
Bastian Solutions LLC
Denso Corp
Ellison Technologies Inc
Fanuc Corp
Fuji Robotics
Kawasaki Heavy Industries Ltd
KUKA AG
Mayekawa Mfg. Co. Ltd
Mitsubishi Electric Corp
Moley Robotics
Nachi-Fujikoshi Corp
OMRON Corp
Rockwell Automation Inc
Schunk GmbH
Staubli International AG
Universal Robots A/S
Yasakawa Electric Corp
15. Methodology and Data Sources
15.1 Customization Offerings
15.2 Subscription Services
15.3 Related Reports
15.4 Publisher Expertise
LIST OF TABLES
Table 1 Market Segmentation Analysis
Table 2 Global Food Robotics Market Share of Leading Companies, 2023
Table 3 Product Offerings of Leading Companies
Table 4 Low Growth Scenario Forecasts
Table 5 Reference Case Growth Scenario
Table 6 High Growth Case Scenario
Table 7 Global Food Robotics Revenue (USD Million) And CAGR (%) By Type (2021-2032)
Table 8 Global Food Robotics Revenue (USD Million) And CAGR (%) By Application (2021-2032)
Table 9 Global Food Robotics Revenue (USD Million) And CAGR (%) By Product (2021-2032)
Table 10 Global Food Robotics Market Revenue (USD Million) By Regions (2021-2032)
Table 11 Global Food Robotics Market Share (%) By Regions (2021-2032)
Table 12 North America Food Robotics Revenue (USD Million) By Country (2021-2032)
Table 13 Europe Food Robotics Revenue (USD Million) By Country (2021-2032)
Table 14 Asia Pacific Food Robotics Revenue (USD Million) By Country (2021-2032)
Table 15 South America Food Robotics Revenue (USD Million) By Country (2021-2032)
Table 16 Middle East and Africa Food Robotics Revenue (USD Million) By Region (2021-2032)
Table 17 North America Food Robotics Revenue (USD Million) By Type (2021-2032)
Table 18 North America Food Robotics Revenue (USD Million) By Application (2021-2032)
Table 19 North America Food Robotics Revenue (USD Million) By Product (2021-2032)
Table 20 Europe Food Robotics Revenue (USD Million) By Type (2021-2032)
Table 21 Europe Food Robotics Revenue (USD Million) By Application (2021-2032)
Table 22 Europe Food Robotics Revenue (USD Million) By Product (2021-2032)
Table 23 Asia Pacific Food Robotics Revenue (USD Million) By Type (2021-2032)
Table 24 Asia Pacific Food Robotics Revenue (USD Million) By Application (2021-2032)
Table 25 Asia Pacific Food Robotics Revenue (USD Million) By Product (2021-2032)
Table 26 South America Food Robotics Revenue (USD Million) By Type (2021-2032)
Table 27 South America Food Robotics Revenue (USD Million) By Application (2021-2032)
Table 28 South America Food Robotics Revenue (USD Million) By Product (2021-2032)
Table 29 Middle East and Africa Food Robotics Revenue (USD Million) By Type (2021-2032)
Table 30 Middle East and Africa Food Robotics Revenue (USD Million) By Application (2021-2032)
Table 31 Middle East and Africa Food Robotics Revenue (USD Million) By Product (2021-2032)
LIST OF FIGURES
Figure 1. Market Scope
Figure 2. Pricing Forecasts Per Unit, 2023- 2032
Figure 3. Porter’s Five Forces
Figure 4. Global Food Robotics Market Revenue (USD Million) By Regions (2021-2032)
Figure 5. Global Food Robotics Market Share (%) By Regions (2023)
Figure 6. North America Food Robotics Revenue (USD Million) By Country (2021-2032)
Figure 7. United States Food Robotics Revenue (USD Million) By Country (2021-2032)
Figure 8. Canada Food Robotics Revenue (USD Million) By Country (2021-2032)
Figure 9. Mexico Food Robotics Revenue (USD Million) By Country (2021-2032)
Figure 10. Europe Food Robotics Revenue (USD Million) By Country (2021-2032)
Figure 11. Germany Food Robotics Revenue (USD Million) By Country (2021-2032)
Figure 12. France Food Robotics Revenue (USD Million) By Country (2021-2032)
Figure 13. United Kingdom Food Robotics Revenue (USD Million) By Country (2021-2032)
Figure 14. Spain Food Robotics Revenue (USD Million) By Country (2021-2032)
Figure 15. Italy Food Robotics Revenue (USD Million) By Country (2021-2032)
Figure 16. Russia Food Robotics Revenue (USD Million) By Country (2021-2032)
Figure 17. Rest of Europe Food Robotics Revenue (USD Million) By Country (2021-2032)
Figure 11. Asia Pacific Food Robotics Revenue (USD Million) By Country (2021-2032)
Figure 12. China Food Robotics Revenue (USD Million) By Country (2021-2032)
Figure 13. Japan Food Robotics Revenue (USD Million) By Country (2021-2032)
Figure 14. India Food Robotics Revenue (USD Million) By Country (2021-2032)
Figure 15. South Korea Food Robotics Revenue (USD Million) By Country (2021-2032)
Figure 16. Australia Food Robotics Revenue (USD Million) By Country (2021-2032)
Figure 17. South East Asia Food Robotics Revenue (USD Million) By Country (2021-2032)
Figure 18. South America Food Robotics Revenue (USD Million) By Country (2021-2032)
Figure 19. Brazil Food Robotics Revenue (USD Million) By Country (2021-2032)
Figure 20. Argentina Food Robotics Revenue (USD Million) By Country (2021-2032)
Figure 21. Rest of Asia Pacific Food Robotics Revenue (USD Million) By Country (2021-2032)
Figure 22. Middle East and Africa Food Robotics Revenue (USD Million) By Region (2021-2032)
Figure 23. Saudi Arabia Food Robotics Revenue (USD Million) By Region (2021-2032)
Figure 24. The UAE Food Robotics Revenue (USD Million) By Region (2021-2032)
Figure 25. Rest of Middle East Food Robotics Revenue (USD Million) By Region (2021-2032)
Figure 26. South Africa Food Robotics Revenue (USD Million) By Region (2021-2032)
Figure 27. Africa Food Robotics Revenue (USD Million) By Region (2021-2032)
Figure 28. North America Food Robotics Revenue (USD Million) By Type (2021-2032)
Figure 29. North America Food Robotics Revenue (USD Million) By Application (2021-2032)
Figure 30. North America Food Robotics Revenue (USD Million) By Product (2021-2032)
Figure 31. Europe Food Robotics Revenue (USD Million) By Type (2021-2032)
Figure 32. Europe Food Robotics Revenue (USD Million) By Application (2021-2032)
Figure 33. Europe Food Robotics Revenue (USD Million) By Product (2021-2032)
Figure 34. Asia Pacific Food Robotics Revenue (USD Million) By Type (2021-2032)
Figure 35. Asia Pacific Food Robotics Revenue (USD Million) By Application (2021-2032)
Figure 36. Asia Pacific Food Robotics Revenue (USD Million) By Product (2021-2032)
Figure 37. South America Food Robotics Revenue (USD Million) By Type (2021-2032)
Figure 38. South America Food Robotics Revenue (USD Million) By Application (2021-2032)
Figure 39. South America Food Robotics Revenue (USD Million) By Product (2021-2032)
Figure 40. Middle East and Africa Food Robotics Revenue (USD Million) By Type (2021-2032)
Figure 41. Middle East and Africa Food Robotics Revenue (USD Million) By Application (2021-2032)
Figure 42. Middle East and Africa Food Robotics Revenue (USD Million) By Product (2021-2032)
By Type
Articulated
Cartesian
Scara
Parallel
Cylindrical
Collaborative
Others
By Payload
High
Medium
Low
By Function
Palletizing
Packaging
Repackaging
Picking
Processing
Others
By Application
Meat
Poultry
Seafood
Processed Food
Dairy Products
Fruits & Vegetables
Beverage
Bakery & Confectionery Products
Others
Countries Analyzed
North America (US, Canada, Mexico)
Europe (Germany, UK, France, Spain, Italy, Russia, Rest of Europe)
Asia Pacific (China, India, Japan, South Korea, Australia, South East Asia, Rest of Asia)
South America (Brazil, Argentina, Rest of South America)
Middle East and Africa (Saudi Arabia, UAE, Rest of Middle East, South Africa, Egypt, Rest of Africa)
