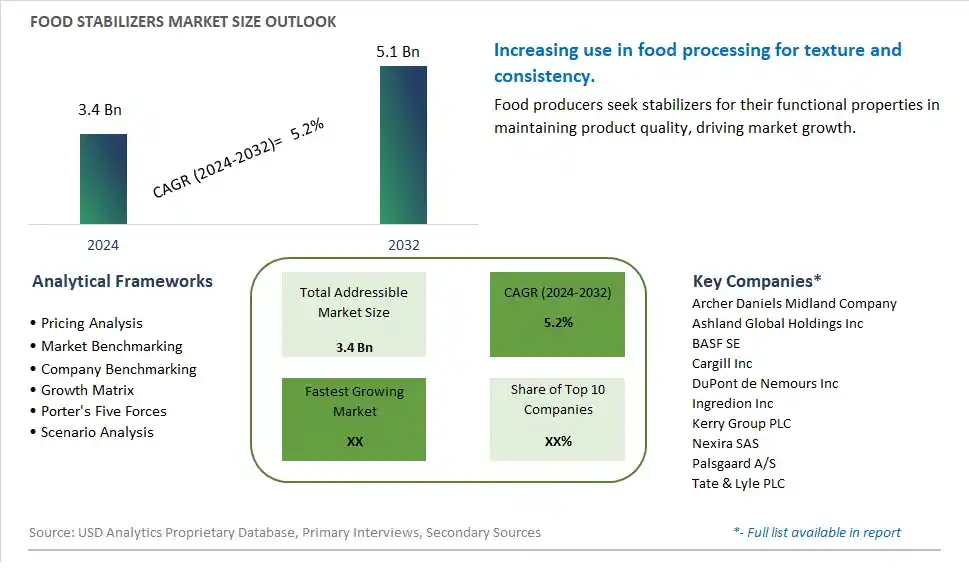
Global Food Stabilizers Market Size is valued at $3.4 Billion in 2024 and is forecast to register a growth rate (CAGR) of 5.2% to reach $5.1 Billion by 2032.
The global Food Stabilizers Market Comprehensive Study analyzes and forecasts the market size across 6 regions and 24 countries for diverse segments -By Source (Plant, Microbial, Seaweed, Synthetic, Animal), By Type (Alginate, Agar, Gelatin, Guar Gum, Cellulose and Cellulose Derivative, Others), By Application (Bakery and Confectionery, Dairy, Meat and Poultry, Beverages, Sauces and Dressings, Others)
An Introduction to Food Stabilizers Market
The food stabilizers market in 2024 is witnessing significant growth, driven by increasing demand for processed foods, technological advancements in food formulation, and shifting consumer preferences for clean label and natural ingredients. Food stabilizers play a crucial role in improving texture, consistency, and shelf life in a wide range of food and beverage products, including dairy, bakery, confectionery, and convenience foods. With consumers seeking products with enhanced sensory attributes, stability, and sustainability, manufacturers are innovating with a diverse range of food stabilizers, such as hydrocolloids, emulsifiers, and gelling agents, derived from natural sources like seaweed, plant gums, and microbial fermentation. Moreover, advancements in food processing technologies, such as microencapsulation and nanotechnology, are enhancing the efficacy and functionality of food stabilizers while minimizing the use of synthetic additives. Additionally, regulatory approvals and certifications affirming the safety and efficacy of food stabilizers are bolstering consumer trust and market growth. Furthermore, collaborations between food stabilizer manufacturers, research institutions, and food industry stakeholders are driving product innovation and market differentiation. Overall, the food stabilizers market is poised for sustained expansion as manufacturers strive to meet evolving consumer expectations for texture, quality, and sustainability in food products.
Food Stabilizers Competitive Landscape
The market report analyses the leading companies in the industry including Archer Daniels Midland Company, Ashland Global Holdings Inc, BASF SE, Cargill Inc, DuPont de Nemours Inc, Ingredion Inc, Kerry Group PLC, Nexira SAS, Palsgaard A/S, Tate & Lyle PLC, and Others.
Food Stabilizers Market Dynamics
Food Stabilizers Market Trend: Increasing Demand for Natural and Clean Label Ingredients
One prominent trend in the food stabilizers market is the growing consumer preference for natural and clean label ingredients. With rising health consciousness and awareness about the impact of artificial additives, consumers are actively seeking products with minimal processing and additives. This trend has led food manufacturers to reformulate their products, replacing synthetic stabilizers with natural alternatives such as plant-based gums, pectin, and starches. As a result, there's a notable shift towards cleaner ingredient lists and transparent labeling in the food stabilizers market.
Market Driver: Expansion of Processed Food Industry in Developing Regions
A key driver in the food stabilizers market is the expansion of the processed food industry, particularly in developing regions. As urbanization and disposable incomes rise, there's a growing demand for convenient and packaged foods. Food stabilizers play a crucial role in maintaining the texture, consistency, and shelf-life of processed foods, making them indispensable for manufacturers. The increasing adoption of stabilizers in a variety of food products, including baked goods, dairy, and convenience foods, is driving market growth globally.
Market Opportunity: Innovation in Functional Food Formulations
An emerging opportunity in the food stabilizers market lies in the innovation of functional food formulations. With the growing focus on health and wellness, there's a rising demand for functional foods enriched with vitamins, minerals, probiotics, and other bioactive ingredients. Food stabilizers can facilitate the incorporation of these functional ingredients into various food products while maintaining their stability and sensory attributes. Manufacturers can capitalize on this trend by developing stabilizer blends tailored for functional food applications, offering enhanced nutritional benefits without compromising taste or texture. By aligning with consumer preferences for both health and convenience, companies can tap into the expanding market for functional foods and beverages.
Food Stabilizers Market Share Analysis: Plant Source held the dominant market share in 2024
In the Food Stabilizers market segmented by Source, the Plant segment is the largest category. This dominance is attributed to the growing consumer preference for natural and clean label ingredients in food products, driving the demand for plant-based stabilizers derived from sources such as guar gum, xanthan gum, and carrageenan. Plant-based stabilizers offer several advantages, including their natural origin, functional properties, and compatibility with various food formulations. These stabilizers are widely utilized in food processing to improve texture, enhance shelf life, and maintain product quality, particularly in products like dairy, beverages, bakery items, and sauces. Additionally, plant-based stabilizers align with evolving consumer trends such as veganism, sustainability, and health consciousness, further boosting their popularity among food manufacturers. Further, stringent regulations and increasing consumer scrutiny regarding synthetic additives propel the market for plant-based stabilizers as a safer and more sustainable alternative. As stakeholders prioritize product innovation and consumer satisfaction, the Plant Source segment maintains its leadership position in the Food Stabilizers market, driving growth and innovation to meet the evolving demands of the food industry.
Food Stabilizers Market Share Analysis: Guar Gum market is poised to register the fastest growth rae over the forecast period to 2032
In the Food Stabilizers market segmented by Type, the Guar Gum segment is the fastest-growing category. This accelerated growth is propelled by several factors, including the functional properties and versatility of guar gum in food applications. Guar gum, derived from the guar bean, is a natural thickening agent and stabilizer widely used in food processing due to its ability to enhance viscosity, improve texture, and stabilize emulsions and suspensions. The growing demand for guar gum is particularly notable in industries such as dairy, bakery, confectionery, and sauces, where it is used to improve product consistency and mouthfeel. Additionally, guar gum is favored by food manufacturers for its clean label appeal as a natural ingredient. Further, as consumers become more health-conscious and seek clean label products, the demand for natural stabilizers like guar gum continues to rise, driving innovation and adoption across the food industry. As stakeholders prioritize product differentiation and consumer preferences, the Guar Gum segment experiences rapid growth, underscoring its significance in driving innovation and sustainability within the Food Stabilizers market.
Food Stabilizers Market Share Analysis: Dairy Application held the dominant market share in 2024
In the Food Stabilizers market segmented by Application, the Dairy segment is the largest category. This dominance is attributed to the extensive use of stabilizers in dairy products to improve texture, mouthfeel, and shelf life. Stabilizers such as carrageenan, guar gum, and pectin are commonly employed in dairy applications to prevent syneresis in yogurts, enhance creaminess in ice creams, and maintain consistency in dairy desserts and beverages. Additionally, dairy products encompass a wide range of items, including milk, yogurt, cheese, ice cream, and butter, each with unique stabilization requirements. The Dairy segment's prominence is further underscored by the growing consumer demand for dairy alternatives such as plant-based milks and yogurts, which also rely on stabilizers for texture and stability. Further, as dairy remains a staple component of diets worldwide, the demand for stabilizers in dairy applications continues to grow, driving innovation and market expansion. As stakeholders prioritize product quality and consumer satisfaction, the Dairy Application segment maintains its leadership position in the Food Stabilizers market, driving growth and innovation to meet the diverse needs of the dairy industry.
Food Stabilizers Market Segmentation
By Source
Plant
Microbial
Seaweed
Synthetic
Animal
By Type
Alginate
Agar
Gelatin
Guar Gum
Cellulose and Cellulose Derivative
Others
By Application
Bakery and Confectionery
Dairy
Meat and Poultry
Beverages
Sauces and Dressings
Others
Countries Analyzed
North America (US, Canada, Mexico)
Europe (Germany, UK, France, Spain, Italy, Russia, Rest of Europe)
Asia Pacific (China, India, Japan, South Korea, Australia, South East Asia, Rest of Asia)
South America (Brazil, Argentina, Rest of South America)
Middle East and Africa (Saudi Arabia, UAE, Rest of Middle East, South Africa, Egypt, Rest of Africa)
Food Stabilizers Companies Profiled in the Study
Archer Daniels Midland Company
Ashland Global Holdings Inc
BASF SE
Cargill Inc
DuPont de Nemours Inc
Ingredion Inc
Kerry Group PLC
Nexira SAS
Palsgaard A/S
Tate & Lyle PLC
*- List Not Exhaustive
Chapter 1. TABLE OF CONTENTS
Chapter 2. Introduction to Food Stabilizers Market
2.1. Market Overview
2.2. Key Statistics and Report Highlights
2.3. Scope of the Comprehensive Study
2.3.1. Market Definition
2.3.2 Countries and Regions Covered
2.3.3 Research Objective
2.3.4 Units, Currency, and Conversions
2.3.5 Industry Value Chain
2.4. Key Market Segments
2.5. Key Companies
2.6. Study Period
Chapter 3. Strategic Analysis Review
3.1. Food Stabilizers Pricing Analysis and Forecast
3.2. Porter’s Five Forces
3.3. Market Ecosystem
3.4. SWOT Analysis
3.5. Regulatory Scenario
3.3. Effects of Inflation, Russia-Ukraine War, moderating economic growth, and other macroeconomic factors
Chapter 4. Competitive Landscape
4.1. Market Share Analysis
4.1.1. Global Food Stabilizers Market Share by Company, 2023
4.1.2. Product Offerings of Leading Food Stabilizers Companies
4.2. Market Entropy
4.2.1. New Product Launches in the Industry
4.2.2. Mergers, Acquisitions, Joint ventures, and Partnerships
4.3. Key Strategies and Best Practices
Chapter 5. Global Market Projections: Best, Reference, and Low Case Scenarios
5.1. Growth Analysis- Case Scenario Definitions
5.2. Low Growth Case Scenario Forecasts
5.3. Reference Growth Case Scenario Forecasts
5.4. High Growth Case Scenario Forecasts
Chapter 6. Market Dynamics
6.1. Food Stabilizers Market Drivers
6.2. Food Stabilizers Market Challenges
6.6. Food Stabilizers Market Opportunities
6.4. Food Stabilizers Market Trends
Chapter 7. Global Food Stabilizers Market Outlook Trends
7.1. Global Food Stabilizers Revenue (USD Million) and CAGR (%) by Type (2021-2032)
7.2. Global Food Stabilizers Revenue (USD Million) and CAGR (%) by Application (2021-2032)
7.3. Global Food Stabilizers Revenue (USD Million) and CAGR (%) by Product (2021-2032)
By Source
Plant
Microbial
Seaweed
Synthetic
Animal
By Type
Alginate
Agar
Gelatin
Guar Gum
Cellulose and Cellulose Derivative
Others
By Application
Bakery and Confectionery
Dairy
Meat and Poultry
Beverages
Sauces and Dressings
Others
Chapter 8. Global Food Stabilizers Regional Analysis and Outlook
8.1. Global Food Stabilizers Revenue (USD Million) By Regions (2021- 2032)
8.2. North America Food Stabilizers Revenue (USD Million) by Country (2021-2032)
8.2.1. United States Food Stabilizers Regional Analysis and Outlook
8.2.2. Canada Food Stabilizers Regional Analysis and Outlook
8.2.3. Mexico Food Stabilizers Regional Analysis and Outlook
8.3. Europe Food Stabilizers Revenue (USD Million), by Country (2021-2032)
8.3.1. Germany Food Stabilizers Regional Analysis and Outlook
8.3.2. France Food Stabilizers Regional Analysis and Outlook
8.3.3. United Kingdom Food Stabilizers Regional Analysis and Outlook
8.3.4. Spain Food Stabilizers Regional Analysis and Outlook
8.3.5. Italy Food Stabilizers Regional Analysis and Outlook
8.3.6. Russia Food Stabilizers Regional Analysis and Outlook
8.3.7. Rest of Europe Food Stabilizers Regional Analysis and Outlook
8.4. Asia Pacific Food Stabilizers Revenue (USD Million) by Country (2021-2032)
8.4.1. China Food Stabilizers Regional Analysis and Outlook
8.4.2. Japan Food Stabilizers Regional Analysis and Outlook
8.4.3. India Food Stabilizers Regional Analysis and Outlook
8.4.4. South Korea Food Stabilizers Regional Analysis and Outlook
8.4.5. Australia Food Stabilizers Regional Analysis and Outlook
8.4.6. South East Asia Food Stabilizers Regional Analysis and Outlook
8.4.7. Rest of Asia Pacific Food Stabilizers Regional Analysis and Outlook
8.5. South America Food Stabilizers Revenue (USD Million), by Country (2021-2032)
8.5.1. Brazil Food Stabilizers Regional Analysis and Outlook
8.5.2. Argentina Food Stabilizers Regional Analysis and Outlook
8.5.3. Rest of South America Food Stabilizers Regional Analysis and Outlook
8.6. Middle East and Africa Food Stabilizers Revenue (USD Million) by Country (2021-2032)
8.6.1. Middle East Food Stabilizers Regional Analysis and Outlook
8.6.2. Africa Food Stabilizers Regional Analysis and Outlook
Chapter 9. North America Food Stabilizers Analysis and Outlook
9.1. North America Food Stabilizers Revenue (USD Million) by Segments (2021-2032)
9.1.1. North America Food Stabilizers Revenue (USD Million) by Type (2021-2032)
9.1.2. North America Food Stabilizers Revenue (USD Million) by Application (2021-2032)
9.1.3. North America Food Stabilizers Revenue (USD Million) by Product (2021-2032)
By Source
Plant
Microbial
Seaweed
Synthetic
Animal
By Type
Alginate
Agar
Gelatin
Guar Gum
Cellulose and Cellulose Derivative
Others
By Application
Bakery and Confectionery
Dairy
Meat and Poultry
Beverages
Sauces and Dressings
Others
Chapter 10. Europe Food Stabilizers Analysis and Outlook
10.1. Europe Food Stabilizers Revenue (USD Million), by Segments (USD Million) (2021-2032)
10.1.1. Europe Food Stabilizers Revenue (USD Million) by Type (2021-2032)
10.1.2. Europe Food Stabilizers Revenue (USD Million) by Application (2021-2032)
10.1.3. Europe Food Stabilizers Revenue (USD Million) by Product (2021-2032)
By Source
Plant
Microbial
Seaweed
Synthetic
Animal
By Type
Alginate
Agar
Gelatin
Guar Gum
Cellulose and Cellulose Derivative
Others
By Application
Bakery and Confectionery
Dairy
Meat and Poultry
Beverages
Sauces and Dressings
Others
Chapter 11. Asia Pacific Food Stabilizers Analysis and Outlook
11.1. Asia Pacific Food Stabilizers Revenue (USD Million), and Revenue (USD Million) by Segments (2021-2032)
11.1.1. Asia Pacific Food Stabilizers Revenue (USD Million) by Type (2021-2032)
11.1.2. Asia Pacific Food Stabilizers Revenue (USD Million) by Application (2021-2032)
11.1.3. Asia Pacific Food Stabilizers Revenue (USD Million) by Product (2021-2032)
By Source
Plant
Microbial
Seaweed
Synthetic
Animal
By Type
Alginate
Agar
Gelatin
Guar Gum
Cellulose and Cellulose Derivative
Others
By Application
Bakery and Confectionery
Dairy
Meat and Poultry
Beverages
Sauces and Dressings
Others
Chapter 12. South America Food Stabilizers Analysis and Outlook
12.1. South America Food Stabilizers Revenue (USD Million), by Segments (2021-2032)
12.1.1. South America Food Stabilizers Revenue (USD Million) by Type (2021-2032)
12.1.2. South America Food Stabilizers Revenue (USD Million) by Application (2021-2032)
12.1.3. South America Food Stabilizers Revenue (USD Million) by Product (2021-2032)
By Source
Plant
Microbial
Seaweed
Synthetic
Animal
By Type
Alginate
Agar
Gelatin
Guar Gum
Cellulose and Cellulose Derivative
Others
By Application
Bakery and Confectionery
Dairy
Meat and Poultry
Beverages
Sauces and Dressings
Others
Chapter 13. Middle East and Africa Food Stabilizers Analysis and Outlook
13.1. Middle East and Africa Food Stabilizers Revenue (USD Million), by Segments (2021-2032)
13.1.1. Middle East and Africa Food Stabilizers Revenue (USD Million) by Type (2021-2032)
13.1.2. Middle East and Africa Food Stabilizers Revenue (USD Million) by Application (2021-2032)
13.1.3. Middle East and Africa Food Stabilizers Revenue (USD Million) by Product (2021-2032)
By Source
Plant
Microbial
Seaweed
Synthetic
Animal
By Type
Alginate
Agar
Gelatin
Guar Gum
Cellulose and Cellulose Derivative
Others
By Application
Bakery and Confectionery
Dairy
Meat and Poultry
Beverages
Sauces and Dressings
Others
Chapter 14. Food Stabilizers Company Profiles
14.1 Business Overview
14.2 Product Profiles
14.3 SWOT Profiles
14.5 Recent Developments
14.6 Financial Profile
List of Companies
Archer Daniels Midland Company
Ashland Global Holdings Inc
BASF SE
Cargill Inc
DuPont de Nemours Inc
Ingredion Inc
Kerry Group PLC
Nexira SAS
Palsgaard A/S
Tate & Lyle PLC
15. Methodology and Data Sources
15.1 Customization Offerings
15.2 Subscription Services
15.3 Related Reports
15.4 Publisher Expertise
LIST OF TABLES
Table 1 Market Segmentation Analysis
Table 2 Global Food Stabilizers Market Share of Leading Companies, 2023
Table 3 Product Offerings of Leading Companies
Table 4 Low Growth Scenario Forecasts
Table 5 Reference Case Growth Scenario
Table 6 High Growth Case Scenario
Table 7 Global Food Stabilizers Revenue (USD Million) And CAGR (%) By Type (2021-2032)
Table 8 Global Food Stabilizers Revenue (USD Million) And CAGR (%) By Application (2021-2032)
Table 9 Global Food Stabilizers Revenue (USD Million) And CAGR (%) By Product (2021-2032)
Table 10 Global Food Stabilizers Market Revenue (USD Million) By Regions (2021-2032)
Table 11 Global Food Stabilizers Market Share (%) By Regions (2021-2032)
Table 12 North America Food Stabilizers Revenue (USD Million) By Country (2021-2032)
Table 13 Europe Food Stabilizers Revenue (USD Million) By Country (2021-2032)
Table 14 Asia Pacific Food Stabilizers Revenue (USD Million) By Country (2021-2032)
Table 15 South America Food Stabilizers Revenue (USD Million) By Country (2021-2032)
Table 16 Middle East and Africa Food Stabilizers Revenue (USD Million) By Region (2021-2032)
Table 17 North America Food Stabilizers Revenue (USD Million) By Type (2021-2032)
Table 18 North America Food Stabilizers Revenue (USD Million) By Application (2021-2032)
Table 19 North America Food Stabilizers Revenue (USD Million) By Product (2021-2032)
Table 20 Europe Food Stabilizers Revenue (USD Million) By Type (2021-2032)
Table 21 Europe Food Stabilizers Revenue (USD Million) By Application (2021-2032)
Table 22 Europe Food Stabilizers Revenue (USD Million) By Product (2021-2032)
Table 23 Asia Pacific Food Stabilizers Revenue (USD Million) By Type (2021-2032)
Table 24 Asia Pacific Food Stabilizers Revenue (USD Million) By Application (2021-2032)
Table 25 Asia Pacific Food Stabilizers Revenue (USD Million) By Product (2021-2032)
Table 26 South America Food Stabilizers Revenue (USD Million) By Type (2021-2032)
Table 27 South America Food Stabilizers Revenue (USD Million) By Application (2021-2032)
Table 28 South America Food Stabilizers Revenue (USD Million) By Product (2021-2032)
Table 29 Middle East and Africa Food Stabilizers Revenue (USD Million) By Type (2021-2032)
Table 30 Middle East and Africa Food Stabilizers Revenue (USD Million) By Application (2021-2032)
Table 31 Middle East and Africa Food Stabilizers Revenue (USD Million) By Product (2021-2032)
LIST OF FIGURES
Figure 1. Market Scope
Figure 2. Pricing Forecasts Per Unit, 2023- 2032
Figure 3. Porter’s Five Forces
Figure 4. Global Food Stabilizers Market Revenue (USD Million) By Regions (2021-2032)
Figure 5. Global Food Stabilizers Market Share (%) By Regions (2023)
Figure 6. North America Food Stabilizers Revenue (USD Million) By Country (2021-2032)
Figure 7. United States Food Stabilizers Revenue (USD Million) By Country (2021-2032)
Figure 8. Canada Food Stabilizers Revenue (USD Million) By Country (2021-2032)
Figure 9. Mexico Food Stabilizers Revenue (USD Million) By Country (2021-2032)
Figure 10. Europe Food Stabilizers Revenue (USD Million) By Country (2021-2032)
Figure 11. Germany Food Stabilizers Revenue (USD Million) By Country (2021-2032)
Figure 12. France Food Stabilizers Revenue (USD Million) By Country (2021-2032)
Figure 13. United Kingdom Food Stabilizers Revenue (USD Million) By Country (2021-2032)
Figure 14. Spain Food Stabilizers Revenue (USD Million) By Country (2021-2032)
Figure 15. Italy Food Stabilizers Revenue (USD Million) By Country (2021-2032)
Figure 16. Russia Food Stabilizers Revenue (USD Million) By Country (2021-2032)
Figure 17. Rest of Europe Food Stabilizers Revenue (USD Million) By Country (2021-2032)
Figure 11. Asia Pacific Food Stabilizers Revenue (USD Million) By Country (2021-2032)
Figure 12. China Food Stabilizers Revenue (USD Million) By Country (2021-2032)
Figure 13. Japan Food Stabilizers Revenue (USD Million) By Country (2021-2032)
Figure 14. India Food Stabilizers Revenue (USD Million) By Country (2021-2032)
Figure 15. South Korea Food Stabilizers Revenue (USD Million) By Country (2021-2032)
Figure 16. Australia Food Stabilizers Revenue (USD Million) By Country (2021-2032)
Figure 17. South East Asia Food Stabilizers Revenue (USD Million) By Country (2021-2032)
Figure 18. South America Food Stabilizers Revenue (USD Million) By Country (2021-2032)
Figure 19. Brazil Food Stabilizers Revenue (USD Million) By Country (2021-2032)
Figure 20. Argentina Food Stabilizers Revenue (USD Million) By Country (2021-2032)
Figure 21. Rest of Asia Pacific Food Stabilizers Revenue (USD Million) By Country (2021-2032)
Figure 22. Middle East and Africa Food Stabilizers Revenue (USD Million) By Region (2021-2032)
Figure 23. Saudi Arabia Food Stabilizers Revenue (USD Million) By Region (2021-2032)
Figure 24. The UAE Food Stabilizers Revenue (USD Million) By Region (2021-2032)
Figure 25. Rest of Middle East Food Stabilizers Revenue (USD Million) By Region (2021-2032)
Figure 26. South Africa Food Stabilizers Revenue (USD Million) By Region (2021-2032)
Figure 27. Africa Food Stabilizers Revenue (USD Million) By Region (2021-2032)
Figure 28. North America Food Stabilizers Revenue (USD Million) By Type (2021-2032)
Figure 29. North America Food Stabilizers Revenue (USD Million) By Application (2021-2032)
Figure 30. North America Food Stabilizers Revenue (USD Million) By Product (2021-2032)
Figure 31. Europe Food Stabilizers Revenue (USD Million) By Type (2021-2032)
Figure 32. Europe Food Stabilizers Revenue (USD Million) By Application (2021-2032)
Figure 33. Europe Food Stabilizers Revenue (USD Million) By Product (2021-2032)
Figure 34. Asia Pacific Food Stabilizers Revenue (USD Million) By Type (2021-2032)
Figure 35. Asia Pacific Food Stabilizers Revenue (USD Million) By Application (2021-2032)
Figure 36. Asia Pacific Food Stabilizers Revenue (USD Million) By Product (2021-2032)
Figure 37. South America Food Stabilizers Revenue (USD Million) By Type (2021-2032)
Figure 38. South America Food Stabilizers Revenue (USD Million) By Application (2021-2032)
Figure 39. South America Food Stabilizers Revenue (USD Million) By Product (2021-2032)
Figure 40. Middle East and Africa Food Stabilizers Revenue (USD Million) By Type (2021-2032)
Figure 41. Middle East and Africa Food Stabilizers Revenue (USD Million) By Application (2021-2032)
Figure 42. Middle East and Africa Food Stabilizers Revenue (USD Million) By Product (2021-2032)
By Source
Plant
Microbial
Seaweed
Synthetic
Animal
By Type
Alginate
Agar
Gelatin
Guar Gum
Cellulose and Cellulose Derivative
Others
By Application
Bakery and Confectionery
Dairy
Meat and Poultry
Beverages
Sauces and Dressings
Others
Countries Analyzed
North America (US, Canada, Mexico)
Europe (Germany, UK, France, Spain, Italy, Russia, Rest of Europe)
Asia Pacific (China, India, Japan, South Korea, Australia, South East Asia, Rest of Asia)
South America (Brazil, Argentina, Rest of South America)
Middle East and Africa (Saudi Arabia, UAE, Rest of Middle East, South Africa, Egypt, Rest of Africa)
