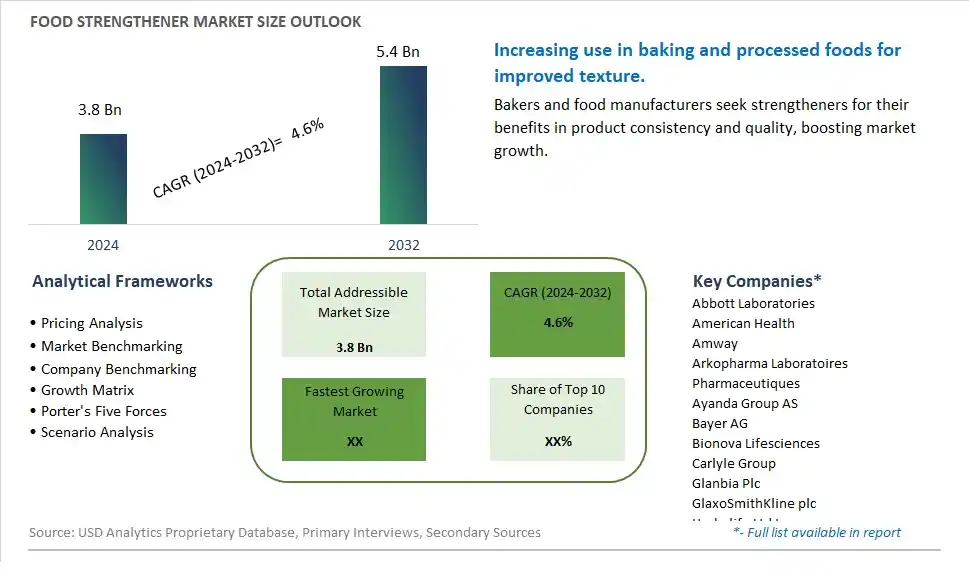
Global Food Strengthener Market Size is valued at $3.8 Billion in 2024 and is forecast to register a growth rate (CAGR) of 4.6% to reach $5.4 Billion by 2032.
The global Food Strengthener Market Comprehensive Study analyzes and forecasts the market size across 6 regions and 24 countries for diverse segments -By Type (Additional Fortifier, Medicinal Fortifier, Sports Nutrition), By Application (Infants, Children, Adults, Pregnant Women, Others)
An Introduction to Food Strengthener Market
The Food Strengthener market in 2024 is experiencing significant growth, driven by the increasing demand for ingredients that improve the texture, stability, and quality of food products. Food strengtheners, including stabilizers, thickeners, and gelling agents, are used in various applications such as dairy, bakery, and confectionery. The market benefits from advancements in ingredient formulation and processing technologies, the growing trend of convenience and processed foods, and the expansion of the global food processing sector. Additionally, the rising focus on clean label and natural strengtheners is contributing to market growth.
Food Strengthener Competitive Landscape
The market report analyses the leading companies in the industry including Abbott Laboratories, American Health, Amway, Arkopharma Laboratoires Pharmaceutiques, Ayanda Group AS, Bayer AG, Bionova Lifesciences, Carlyle Group, Glanbia Plc, GlaxoSmithKline plc, Herbalife Ltd Inc, Nature s Sunshine Products, Neutraceutics Corp, Pfizer Inc, XanGo LLC, and Others.
Food Strengthener Market Dynamics
Food Strengthener Market Trend: Increasing Demand for Functional Foods
The most prominent trend in the Food Strengthener Market is the increasing demand for functional foods. Consumers are seeking food products that offer additional health benefits, such as improved strength, endurance, and overall wellness. This trend is driven by the health and wellness movement, which emphasizes the role of nutrition in enhancing physical performance and supporting a healthy lifestyle. Food strengtheners, which enhance the nutritional profile of foods, align with this trend by providing targeted health benefits.
Food Strengthener Market Driver: Growth in Sports and Fitness Nutrition
The key driver of the Food Strengthener Market is the growth in sports and fitness nutrition. As more people engage in physical activities and adopt fitness regimes, there is a higher demand for food products that support muscle growth, recovery, and performance. Food strengtheners, such as protein powders and amino acid supplements, are increasingly used in sports nutrition products, driving their market growth.
Food Strengthener Market Opportunity: Innovation in Plant-Based Strengtheners
A significant opportunity in the Food Strengthener Market lies in innovation in plant-based strengtheners. As consumer preferences shift towards plant-based and sustainable diets, there is potential for developing strengtheners derived from plant sources. By offering plant-based strengtheners that cater to the growing demand for vegan and vegetarian options, companies can attract health-conscious consumers and expand their market reach.
Food Strengthener Market Share Analysis: Additional Fortifier segment generated the highest revenue share in the industry
Among the segments in the Food Strengthener market, Additional Fortifier stands out as the largest segment. Additional fortifiers are substances added to food products to enhance their nutritional value by increasing the content of essential vitamins, minerals, or other beneficial nutrients. These fortifiers are widely used in various food and beverage products, including breakfast cereals, dairy products, beverages, and nutritional supplements. The growing consumer demand for healthier food choices and nutritional supplements has significantly contributed to the prominence of additional fortifiers in the market. Manufacturers are increasingly focusing on fortifying their products to meet consumer preferences for enhanced nutrition and wellness benefits. Regulatory bodies also play a crucial role by establishing guidelines and standards for fortification, ensuring that fortified foods meet specific nutritional requirements without compromising safety. The versatility of additional fortifiers allows them to be incorporated into a wide range of food applications, catering to diverse consumer needs and dietary preferences. As consumer awareness about nutrition and health continues to grow, the demand for additional fortifiers is expected to expand, driving innovation and product development in the food strengthener market.
Food Strengthener Market Share Analysis: Adults is the fastest growing segment over the forecast period to 2032
The Adults segment is experiencing rapid growth in the Food Strengthener market, driven by increasing health consciousness and the growing trend towards personalized nutrition. As adults become more proactive about their health and well-being, there is a rising demand for food products fortified with additional nutrients such as vitamins, minerals, and protein. These fortifications aim to address specific health concerns, support immune function, and promote overall vitality. Manufacturers are responding to this trend by developing innovative food strengthener products tailored to the nutritional needs of adults, including fortified beverages, snacks, and dietary supplements. Regulatory support and advancements in food fortification technologies further facilitate the development of effective and safe products that meet stringent quality and safety standards. The adult demographic's diverse dietary preferences and lifestyles drive the versatility of fortified products, ranging from convenience foods to specialized nutrition solutions. As the awareness of preventive healthcare grows, the adult segment is expected to continue expanding, presenting opportunities for market growth and product innovation in the food strengthener industry.
Food Strengthener Market Segmentation
By Type
Additional Fortifier
Medicinal Fortifier
Sports Nutrition
By Application
Infants
Children
Adults
Pregnant Women
Others
Countries Analyzed
North America (US, Canada, Mexico)
Europe (Germany, UK, France, Spain, Italy, Russia, Rest of Europe)
Asia Pacific (China, India, Japan, South Korea, Australia, South East Asia, Rest of Asia)
South America (Brazil, Argentina, Rest of South America)
Middle East and Africa (Saudi Arabia, UAE, Rest of Middle East, South Africa, Egypt, Rest of Africa)
Food Strengthener Companies Profiled in the Study
Abbott Laboratories
American Health
Amway
Arkopharma Laboratoires Pharmaceutiques
Ayanda Group AS
Bayer AG
Bionova Lifesciences
Carlyle Group
Glanbia Plc
GlaxoSmithKline plc
Herbalife Ltd Inc
Nature s Sunshine Products
Neutraceutics Corp
Pfizer Inc
XanGo LLC
*- List Not Exhaustive
Chapter 1. TABLE OF CONTENTS
Chapter 2. Introduction to Food Strengthener Market
2.1. Market Overview
2.2. Key Statistics and Report Highlights
2.3. Scope of the Comprehensive Study
2.3.1. Market Definition
2.3.2 Countries and Regions Covered
2.3.3 Research Objective
2.3.4 Units, Currency, and Conversions
2.3.5 Industry Value Chain
2.4. Key Market Segments
2.5. Key Companies
2.6. Study Period
Chapter 3. Strategic Analysis Review
3.1. Food Strengthener Pricing Analysis and Forecast
3.2. Porter’s Five Forces
3.3. Market Ecosystem
3.4. SWOT Analysis
3.5. Regulatory Scenario
3.3. Effects of Inflation, Russia-Ukraine War, moderating economic growth, and other macroeconomic factors
Chapter 4. Competitive Landscape
4.1. Market Share Analysis
4.1.1. Global Food Strengthener Market Share by Company, 2023
4.1.2. Product Offerings of Leading Food Strengthener Companies
4.2. Market Entropy
4.2.1. New Product Launches in the Industry
4.2.2. Mergers, Acquisitions, Joint ventures, and Partnerships
4.3. Key Strategies and Best Practices
Chapter 5. Global Market Projections: Best, Reference, and Low Case Scenarios
5.1. Growth Analysis- Case Scenario Definitions
5.2. Low Growth Case Scenario Forecasts
5.3. Reference Growth Case Scenario Forecasts
5.4. High Growth Case Scenario Forecasts
Chapter 6. Market Dynamics
6.1. Food Strengthener Market Drivers
6.2. Food Strengthener Market Challenges
6.6. Food Strengthener Market Opportunities
6.4. Food Strengthener Market Trends
Chapter 7. Global Food Strengthener Market Outlook Trends
7.1. Global Food Strengthener Revenue (USD Million) and CAGR (%) by Type (2021-2032)
7.2. Global Food Strengthener Revenue (USD Million) and CAGR (%) by Application (2021-2032)
7.3. Global Food Strengthener Revenue (USD Million) and CAGR (%) by Product (2021-2032)
By Type
Additional Fortifier
Medicinal Fortifier
Sports Nutrition
By Application
Infants
Children
Adults
Pregnant Women
Others
Chapter 8. Global Food Strengthener Regional Analysis and Outlook
8.1. Global Food Strengthener Revenue (USD Million) By Regions (2021- 2032)
8.2. North America Food Strengthener Revenue (USD Million) by Country (2021-2032)
8.2.1. United States Food Strengthener Regional Analysis and Outlook
8.2.2. Canada Food Strengthener Regional Analysis and Outlook
8.2.3. Mexico Food Strengthener Regional Analysis and Outlook
8.3. Europe Food Strengthener Revenue (USD Million), by Country (2021-2032)
8.3.1. Germany Food Strengthener Regional Analysis and Outlook
8.3.2. France Food Strengthener Regional Analysis and Outlook
8.3.3. United Kingdom Food Strengthener Regional Analysis and Outlook
8.3.4. Spain Food Strengthener Regional Analysis and Outlook
8.3.5. Italy Food Strengthener Regional Analysis and Outlook
8.3.6. Russia Food Strengthener Regional Analysis and Outlook
8.3.7. Rest of Europe Food Strengthener Regional Analysis and Outlook
8.4. Asia Pacific Food Strengthener Revenue (USD Million) by Country (2021-2032)
8.4.1. China Food Strengthener Regional Analysis and Outlook
8.4.2. Japan Food Strengthener Regional Analysis and Outlook
8.4.3. India Food Strengthener Regional Analysis and Outlook
8.4.4. South Korea Food Strengthener Regional Analysis and Outlook
8.4.5. Australia Food Strengthener Regional Analysis and Outlook
8.4.6. South East Asia Food Strengthener Regional Analysis and Outlook
8.4.7. Rest of Asia Pacific Food Strengthener Regional Analysis and Outlook
8.5. South America Food Strengthener Revenue (USD Million), by Country (2021-2032)
8.5.1. Brazil Food Strengthener Regional Analysis and Outlook
8.5.2. Argentina Food Strengthener Regional Analysis and Outlook
8.5.3. Rest of South America Food Strengthener Regional Analysis and Outlook
8.6. Middle East and Africa Food Strengthener Revenue (USD Million) by Country (2021-2032)
8.6.1. Middle East Food Strengthener Regional Analysis and Outlook
8.6.2. Africa Food Strengthener Regional Analysis and Outlook
Chapter 9. North America Food Strengthener Analysis and Outlook
9.1. North America Food Strengthener Revenue (USD Million) by Segments (2021-2032)
9.1.1. North America Food Strengthener Revenue (USD Million) by Type (2021-2032)
9.1.2. North America Food Strengthener Revenue (USD Million) by Application (2021-2032)
9.1.3. North America Food Strengthener Revenue (USD Million) by Product (2021-2032)
By Type
Additional Fortifier
Medicinal Fortifier
Sports Nutrition
By Application
Infants
Children
Adults
Pregnant Women
Others
Chapter 10. Europe Food Strengthener Analysis and Outlook
10.1. Europe Food Strengthener Revenue (USD Million), by Segments (USD Million) (2021-2032)
10.1.1. Europe Food Strengthener Revenue (USD Million) by Type (2021-2032)
10.1.2. Europe Food Strengthener Revenue (USD Million) by Application (2021-2032)
10.1.3. Europe Food Strengthener Revenue (USD Million) by Product (2021-2032)
By Type
Additional Fortifier
Medicinal Fortifier
Sports Nutrition
By Application
Infants
Children
Adults
Pregnant Women
Others
Chapter 11. Asia Pacific Food Strengthener Analysis and Outlook
11.1. Asia Pacific Food Strengthener Revenue (USD Million), and Revenue (USD Million) by Segments (2021-2032)
11.1.1. Asia Pacific Food Strengthener Revenue (USD Million) by Type (2021-2032)
11.1.2. Asia Pacific Food Strengthener Revenue (USD Million) by Application (2021-2032)
11.1.3. Asia Pacific Food Strengthener Revenue (USD Million) by Product (2021-2032)
By Type
Additional Fortifier
Medicinal Fortifier
Sports Nutrition
By Application
Infants
Children
Adults
Pregnant Women
Others
Chapter 12. South America Food Strengthener Analysis and Outlook
12.1. South America Food Strengthener Revenue (USD Million), by Segments (2021-2032)
12.1.1. South America Food Strengthener Revenue (USD Million) by Type (2021-2032)
12.1.2. South America Food Strengthener Revenue (USD Million) by Application (2021-2032)
12.1.3. South America Food Strengthener Revenue (USD Million) by Product (2021-2032)
By Type
Additional Fortifier
Medicinal Fortifier
Sports Nutrition
By Application
Infants
Children
Adults
Pregnant Women
Others
Chapter 13. Middle East and Africa Food Strengthener Analysis and Outlook
13.1. Middle East and Africa Food Strengthener Revenue (USD Million), by Segments (2021-2032)
13.1.1. Middle East and Africa Food Strengthener Revenue (USD Million) by Type (2021-2032)
13.1.2. Middle East and Africa Food Strengthener Revenue (USD Million) by Application (2021-2032)
13.1.3. Middle East and Africa Food Strengthener Revenue (USD Million) by Product (2021-2032)
By Type
Additional Fortifier
Medicinal Fortifier
Sports Nutrition
By Application
Infants
Children
Adults
Pregnant Women
Others
Chapter 14. Food Strengthener Company Profiles
14.1 Business Overview
14.2 Product Profiles
14.3 SWOT Profiles
14.5 Recent Developments
14.6 Financial Profile
List of Companies
Abbott Laboratories
American Health
Amway
Arkopharma Laboratoires Pharmaceutiques
Ayanda Group AS
Bayer AG
Bionova Lifesciences
Carlyle Group
Glanbia Plc
GlaxoSmithKline plc
Herbalife Ltd Inc
Nature s Sunshine Products
Neutraceutics Corp
Pfizer Inc
XanGo LLC
15. Methodology and Data Sources
15.1 Customization Offerings
15.2 Subscription Services
15.3 Related Reports
15.4 Publisher Expertise
LIST OF TABLES
Table 1 Market Segmentation Analysis
Table 2 Global Food Strengthener Market Share of Leading Companies, 2023
Table 3 Product Offerings of Leading Companies
Table 4 Low Growth Scenario Forecasts
Table 5 Reference Case Growth Scenario
Table 6 High Growth Case Scenario
Table 7 Global Food Strengthener Revenue (USD Million) And CAGR (%) By Type (2021-2032)
Table 8 Global Food Strengthener Revenue (USD Million) And CAGR (%) By Application (2021-2032)
Table 9 Global Food Strengthener Revenue (USD Million) And CAGR (%) By Product (2021-2032)
Table 10 Global Food Strengthener Market Revenue (USD Million) By Regions (2021-2032)
Table 11 Global Food Strengthener Market Share (%) By Regions (2021-2032)
Table 12 North America Food Strengthener Revenue (USD Million) By Country (2021-2032)
Table 13 Europe Food Strengthener Revenue (USD Million) By Country (2021-2032)
Table 14 Asia Pacific Food Strengthener Revenue (USD Million) By Country (2021-2032)
Table 15 South America Food Strengthener Revenue (USD Million) By Country (2021-2032)
Table 16 Middle East and Africa Food Strengthener Revenue (USD Million) By Region (2021-2032)
Table 17 North America Food Strengthener Revenue (USD Million) By Type (2021-2032)
Table 18 North America Food Strengthener Revenue (USD Million) By Application (2021-2032)
Table 19 North America Food Strengthener Revenue (USD Million) By Product (2021-2032)
Table 20 Europe Food Strengthener Revenue (USD Million) By Type (2021-2032)
Table 21 Europe Food Strengthener Revenue (USD Million) By Application (2021-2032)
Table 22 Europe Food Strengthener Revenue (USD Million) By Product (2021-2032)
Table 23 Asia Pacific Food Strengthener Revenue (USD Million) By Type (2021-2032)
Table 24 Asia Pacific Food Strengthener Revenue (USD Million) By Application (2021-2032)
Table 25 Asia Pacific Food Strengthener Revenue (USD Million) By Product (2021-2032)
Table 26 South America Food Strengthener Revenue (USD Million) By Type (2021-2032)
Table 27 South America Food Strengthener Revenue (USD Million) By Application (2021-2032)
Table 28 South America Food Strengthener Revenue (USD Million) By Product (2021-2032)
Table 29 Middle East and Africa Food Strengthener Revenue (USD Million) By Type (2021-2032)
Table 30 Middle East and Africa Food Strengthener Revenue (USD Million) By Application (2021-2032)
Table 31 Middle East and Africa Food Strengthener Revenue (USD Million) By Product (2021-2032)
LIST OF FIGURES
Figure 1. Market Scope
Figure 2. Pricing Forecasts Per Unit, 2023- 2032
Figure 3. Porter’s Five Forces
Figure 4. Global Food Strengthener Market Revenue (USD Million) By Regions (2021-2032)
Figure 5. Global Food Strengthener Market Share (%) By Regions (2023)
Figure 6. North America Food Strengthener Revenue (USD Million) By Country (2021-2032)
Figure 7. United States Food Strengthener Revenue (USD Million) By Country (2021-2032)
Figure 8. Canada Food Strengthener Revenue (USD Million) By Country (2021-2032)
Figure 9. Mexico Food Strengthener Revenue (USD Million) By Country (2021-2032)
Figure 10. Europe Food Strengthener Revenue (USD Million) By Country (2021-2032)
Figure 11. Germany Food Strengthener Revenue (USD Million) By Country (2021-2032)
Figure 12. France Food Strengthener Revenue (USD Million) By Country (2021-2032)
Figure 13. United Kingdom Food Strengthener Revenue (USD Million) By Country (2021-2032)
Figure 14. Spain Food Strengthener Revenue (USD Million) By Country (2021-2032)
Figure 15. Italy Food Strengthener Revenue (USD Million) By Country (2021-2032)
Figure 16. Russia Food Strengthener Revenue (USD Million) By Country (2021-2032)
Figure 17. Rest of Europe Food Strengthener Revenue (USD Million) By Country (2021-2032)
Figure 11. Asia Pacific Food Strengthener Revenue (USD Million) By Country (2021-2032)
Figure 12. China Food Strengthener Revenue (USD Million) By Country (2021-2032)
Figure 13. Japan Food Strengthener Revenue (USD Million) By Country (2021-2032)
Figure 14. India Food Strengthener Revenue (USD Million) By Country (2021-2032)
Figure 15. South Korea Food Strengthener Revenue (USD Million) By Country (2021-2032)
Figure 16. Australia Food Strengthener Revenue (USD Million) By Country (2021-2032)
Figure 17. South East Asia Food Strengthener Revenue (USD Million) By Country (2021-2032)
Figure 18. South America Food Strengthener Revenue (USD Million) By Country (2021-2032)
Figure 19. Brazil Food Strengthener Revenue (USD Million) By Country (2021-2032)
Figure 20. Argentina Food Strengthener Revenue (USD Million) By Country (2021-2032)
Figure 21. Rest of Asia Pacific Food Strengthener Revenue (USD Million) By Country (2021-2032)
Figure 22. Middle East and Africa Food Strengthener Revenue (USD Million) By Region (2021-2032)
Figure 23. Saudi Arabia Food Strengthener Revenue (USD Million) By Region (2021-2032)
Figure 24. The UAE Food Strengthener Revenue (USD Million) By Region (2021-2032)
Figure 25. Rest of Middle East Food Strengthener Revenue (USD Million) By Region (2021-2032)
Figure 26. South Africa Food Strengthener Revenue (USD Million) By Region (2021-2032)
Figure 27. Africa Food Strengthener Revenue (USD Million) By Region (2021-2032)
Figure 28. North America Food Strengthener Revenue (USD Million) By Type (2021-2032)
Figure 29. North America Food Strengthener Revenue (USD Million) By Application (2021-2032)
Figure 30. North America Food Strengthener Revenue (USD Million) By Product (2021-2032)
Figure 31. Europe Food Strengthener Revenue (USD Million) By Type (2021-2032)
Figure 32. Europe Food Strengthener Revenue (USD Million) By Application (2021-2032)
Figure 33. Europe Food Strengthener Revenue (USD Million) By Product (2021-2032)
Figure 34. Asia Pacific Food Strengthener Revenue (USD Million) By Type (2021-2032)
Figure 35. Asia Pacific Food Strengthener Revenue (USD Million) By Application (2021-2032)
Figure 36. Asia Pacific Food Strengthener Revenue (USD Million) By Product (2021-2032)
Figure 37. South America Food Strengthener Revenue (USD Million) By Type (2021-2032)
Figure 38. South America Food Strengthener Revenue (USD Million) By Application (2021-2032)
Figure 39. South America Food Strengthener Revenue (USD Million) By Product (2021-2032)
Figure 40. Middle East and Africa Food Strengthener Revenue (USD Million) By Type (2021-2032)
Figure 41. Middle East and Africa Food Strengthener Revenue (USD Million) By Application (2021-2032)
Figure 42. Middle East and Africa Food Strengthener Revenue (USD Million) By Product (2021-2032)
By Type
Additional Fortifier
Medicinal Fortifier
Sports Nutrition
By Application
Infants
Children
Adults
Pregnant Women
Others
Countries Analyzed
North America (US, Canada, Mexico)
Europe (Germany, UK, France, Spain, Italy, Russia, Rest of Europe)
Asia Pacific (China, India, Japan, South Korea, Australia, South East Asia, Rest of Asia)
South America (Brazil, Argentina, Rest of South America)
Middle East and Africa (Saudi Arabia, UAE, Rest of Middle East, South Africa, Egypt, Rest of Africa)
