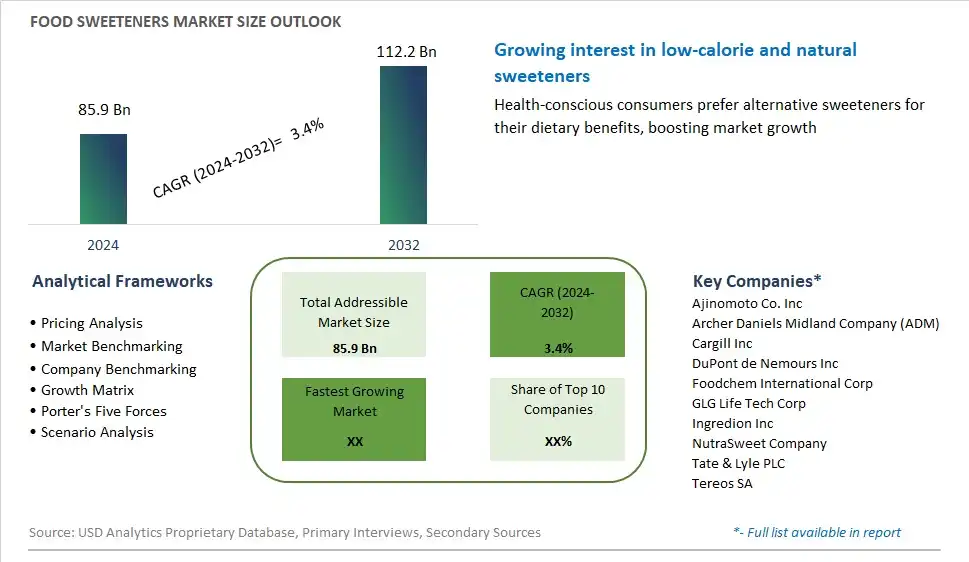
Global Food Sweeteners Market Size is valued at $85.9 Billion in 2024 and is forecast to register a growth rate (CAGR) of 3.4% to reach $112.2 Billion by 2032.
The global Food Sweeteners Market Comprehensive Study analyzes and forecasts the market size across 6 regions and 24 countries for diverse segments -By Product (Sucrose, Starch Sweeteners and Sugar Alcohols, High-intensity Sweeteners), By Application (Bakery and Confectionery, Dairy and Desserts, Beverages, Meat and Meat Products, Soups, Sauces, and Dressings, Others)
An Introduction to Food Sweeteners Market
Food sweeteners play a crucial role in the food and beverage industry, providing sweetness, flavor enhancement, and functionality to a wide range of products in With the increasing prevalence of health-conscious consumers and rising concerns about sugar consumption, the market for food sweeteners is undergoing significant evolution and innovation. Traditional sweeteners like sucrose and high-fructose corn syrup are facing scrutiny due to their association with health issues such as obesity, diabetes, and dental caries. In response, there is a growing demand for alternative sweeteners that offer sweetness without the negative health effects of sugar. Natural sweeteners like stevia, monk fruit, and erythritol are gaining popularity due to their zero-calorie profiles and perceived health benefits. Moreover, advancements in sweetener technology, including the development of novel extraction methods and formulations, are expanding the range of sweeteners available to consumers. Additionally, there is a trend towards sugar reduction and reformulation in food and beverage products, driven by regulatory pressures and consumer demand for healthier options. As the market for food sweeteners continues to evolve, manufacturers are exploring innovative solutions to meet the needs of health-conscious consumers while delivering the taste and functionality they crave.
Food Sweeteners Competitive Landscape
The market report analyses the leading companies in the industry including Ajinomoto Co. Inc, Archer Daniels Midland Company (ADM), Cargill Inc, DuPont de Nemours Inc, Foodchem International Corp, GLG Life Tech Corp, Ingredion Inc, NutraSweet Company, Tate & Lyle PLC, Tereos SA, and Others.
Food Sweeteners Market Dynamics
Food Sweeteners Market Trend: Shift Towards Natural and Low-Calorie Sweeteners
A prominent trend in the food sweeteners market is the shift towards natural and low-calorie sweeteners, driven by increasing consumer awareness of health concerns related to excessive sugar consumption and demand for cleaner label products. Consumers are seeking alternatives to traditional sugar that offer sweetness without the calories or negative health effects associated with high sugar intake. This has led to growing interest in natural sweeteners such as stevia, monk fruit, and erythritol, which provide sweetness derived from plant sources with minimal impact on blood sugar levels. Additionally, low-calorie sweeteners like sucralose and aspartame are gaining popularity as substitutes for sugar in various food and beverage applications, catering to consumers looking to reduce calorie intake without sacrificing taste. This trend reflects changing consumer preferences towards healthier eating habits and transparent labeling, driving manufacturers to reformulate products and innovate with alternative sweetening solutions.
Market Driver: Rising Demand for Health-Conscious and Diabetic-Friendly Products
A key driver of the food sweeteners market is the rising demand for health-conscious and diabetic-friendly products, fueled by increasing rates of obesity, diabetes, and lifestyle-related health conditions globally. As consumers become more aware of the link between sugar consumption and chronic diseases such as diabetes, obesity, and cardiovascular disease, there's growing interest in healthier alternatives to traditional sugar in food and beverage formulations. Low-glycemic index sweeteners, sugar alcohols, and artificial sweeteners provide options for individuals seeking to manage blood sugar levels, control weight, and reduce the risk of metabolic disorders. Moreover, the growing prevalence of diabetes and insulin resistance has created a niche market for diabetic-friendly products formulated with sugar alternatives that offer sweetness without spiking blood glucose levels. This driver underscores the importance of food sweeteners in addressing consumer health concerns and meeting the needs of specific dietary preferences and medical conditions.
Market Opportunity: Innovation in Functional and Natural Sweetening Solutions
An opportunity for growth in the food sweeteners market lies in innovation in functional and natural sweetening solutions, leveraging consumer demand for products that offer added health benefits and clean label formulations. Functional sweeteners fortified with vitamins, minerals, antioxidants, and prebiotic fibers provide additional nutritional value beyond sweetness, catering to consumers seeking functional foods and beverages that support overall well-being. Additionally, there's potential to develop natural sweeteners derived from novel sources such as fruits, vegetables, and seaweed, offering unique flavor profiles and nutritional advantages. Furthermore, the integration of natural sweeteners into functional food and beverage categories such as sports nutrition, functional drinks, and wellness products presents opportunities to differentiate products and capitalize on emerging dietary trends. By investing in research and development, collaboration with ingredient suppliers, and marketing strategies that emphasize health benefits and sustainability, food sweetener manufacturers can seize opportunities for innovation and market expansion in the evolving landscape of sweetening solutions.
Food Sweeteners Market Share Analysis: Starch Sweeteners and Sugar Alcohols held the dominant market share in 2024
In the Food Sweeteners Market, the Starch Sweeteners and Sugar Alcohols segment emerge as the largest due to several factors driving its dominance. This segment encompasses a diverse range of sweeteners, including dextrose, high fructose corn syrup, maltodextrin, sorbitol, xylitol, and others, derived from starch and sugar alcohols. Starch sweeteners and sugar alcohols are widely utilized in various food and beverage applications due to their versatility, affordability, and functional properties. They serve as key ingredients in the formulation of a wide range of products, including baked goods, confectionery, beverages, dairy products, and processed foods. Further, starch sweeteners and sugar alcohols offer numerous benefits such as enhancing texture, improving shelf-life, and providing sweetness without the high caloric content of sucrose. Additionally, the availability of diverse starch sources and technological advancements in sweetener production further bolster the dominance of this segment in the market. Furthermore, the increasing demand for reduced-calorie and sugar-free food products, driven by health-conscious consumers and regulatory initiatives, continues to fuel the growth of starch sweeteners and sugar alcohols. Consequently, the Starch Sweeteners and Sugar Alcohols segment maintain its leadership position in the Food Sweeteners Market, supported by its widespread applications, functional benefits, and continuous innovation.
Food Sweeteners Market Share Analysis: Bakery and Confectionery market is poised to register the fastest growth rae over the forecast period to 2032
In the Food Sweeteners Market, the Bakery and Confectionery segment is the fastest-growing segment due to several factors propelling its rapid expansion. The demand for sweeteners in bakery and confectionery applications is witnessing significant growth driven by consumer preferences for indulgent treats, coupled with the rising popularity of convenience foods and snacking. Sweeteners play a crucial role in enhancing the taste, texture, and shelf-life of baked goods and confectionery products, such as cakes, cookies, pastries, candies, and chocolates. Further, the increasing trend towards healthier alternatives and sugar reduction initiatives has spurred the development and adoption of low-calorie and natural sweeteners in bakery and confectionery formulations. Additionally, technological advancements in sweetener formulations and processing techniques enable manufacturers to create innovative products that meet consumer demands for taste, texture, and healthfulness. Furthermore, the globalization of food culture and the expansion of bakery and confectionery markets in emerging economies further contribute to the growth of this segment. Consequently, the Bakery and Confectionery segment are poised for robust expansion, driven by the growing demand for sweeteners in indulgent treats and the continuous innovation in product formulations catering to evolving consumer preferences.
Food Sweeteners Market Segmentation
By Product
Sucrose
Starch Sweeteners and Sugar Alcohols
-Dextrose
-High Fructose Corn Syrup
-Maltodextrin
-Sorbitol
-Xylitol
-Others
High-intensity Sweeteners
-Sucralose
-Aspartame
-Saccharin
-Neotame
-Stevia
-Cyclamate
-Ascesulfame Potassium
-Others
By Application
Bakery and Confectionery
Dairy and Desserts
Beverages
Meat and Meat Products
Soups, Sauces, and Dressings
Others
Countries Analyzed
North America (US, Canada, Mexico)
Europe (Germany, UK, France, Spain, Italy, Russia, Rest of Europe)
Asia Pacific (China, India, Japan, South Korea, Australia, South East Asia, Rest of Asia)
South America (Brazil, Argentina, Rest of South America)
Middle East and Africa (Saudi Arabia, UAE, Rest of Middle East, South Africa, Egypt, Rest of Africa)
Food Sweeteners Companies Profiled in the Study
Ajinomoto Co. Inc
Archer Daniels Midland Company (ADM)
Cargill Inc
DuPont de Nemours Inc
Foodchem International Corp
GLG Life Tech Corp
Ingredion Inc
NutraSweet Company
Tate & Lyle PLC
Tereos SA
*- List Not Exhaustive
Chapter 1. TABLE OF CONTENTS
Chapter 2. Introduction to Food Sweeteners Market
2.1. Market Overview
2.2. Key Statistics and Report Highlights
2.3. Scope of the Comprehensive Study
2.3.1. Market Definition
2.3.2 Countries and Regions Covered
2.3.3 Research Objective
2.3.4 Units, Currency, and Conversions
2.3.5 Industry Value Chain
2.4. Key Market Segments
2.5. Key Companies
2.6. Study Period
Chapter 3. Strategic Analysis Review
3.1. Food Sweeteners Pricing Analysis and Forecast
3.2. Porter’s Five Forces
3.3. Market Ecosystem
3.4. SWOT Analysis
3.5. Regulatory Scenario
3.3. Effects of Inflation, Russia-Ukraine War, moderating economic growth, and other macroeconomic factors
Chapter 4. Competitive Landscape
4.1. Market Share Analysis
4.1.1. Global Food Sweeteners Market Share by Company, 2023
4.1.2. Product Offerings of Leading Food Sweeteners Companies
4.2. Market Entropy
4.2.1. New Product Launches in the Industry
4.2.2. Mergers, Acquisitions, Joint ventures, and Partnerships
4.3. Key Strategies and Best Practices
Chapter 5. Global Market Projections: Best, Reference, and Low Case Scenarios
5.1. Growth Analysis- Case Scenario Definitions
5.2. Low Growth Case Scenario Forecasts
5.3. Reference Growth Case Scenario Forecasts
5.4. High Growth Case Scenario Forecasts
Chapter 6. Market Dynamics
6.1. Food Sweeteners Market Drivers
6.2. Food Sweeteners Market Challenges
6.6. Food Sweeteners Market Opportunities
6.4. Food Sweeteners Market Trends
Chapter 7. Global Food Sweeteners Market Outlook Trends
7.1. Global Food Sweeteners Revenue (USD Million) and CAGR (%) by Type (2021-2032)
7.2. Global Food Sweeteners Revenue (USD Million) and CAGR (%) by Application (2021-2032)
7.3. Global Food Sweeteners Revenue (USD Million) and CAGR (%) by Product (2021-2032)
By Product
Sucrose
Starch Sweeteners and Sugar Alcohols
-Dextrose
-High Fructose Corn Syrup
-Maltodextrin
-Sorbitol
-Xylitol
-Others
High-intensity Sweeteners
-Sucralose
-Aspartame
-Saccharin
-Neotame
-Stevia
-Cyclamate
-Ascesulfame Potassium
-Others
By Application
Bakery and Confectionery
Dairy and Desserts
Beverages
Meat and Meat Products
Soups, Sauces, and Dressings
Others
Chapter 8. Global Food Sweeteners Regional Analysis and Outlook
8.1. Global Food Sweeteners Revenue (USD Million) By Regions (2021- 2032)
8.2. North America Food Sweeteners Revenue (USD Million) by Country (2021-2032)
8.2.1. United States Food Sweeteners Regional Analysis and Outlook
8.2.2. Canada Food Sweeteners Regional Analysis and Outlook
8.2.3. Mexico Food Sweeteners Regional Analysis and Outlook
8.3. Europe Food Sweeteners Revenue (USD Million), by Country (2021-2032)
8.3.1. Germany Food Sweeteners Regional Analysis and Outlook
8.3.2. France Food Sweeteners Regional Analysis and Outlook
8.3.3. United Kingdom Food Sweeteners Regional Analysis and Outlook
8.3.4. Spain Food Sweeteners Regional Analysis and Outlook
8.3.5. Italy Food Sweeteners Regional Analysis and Outlook
8.3.6. Russia Food Sweeteners Regional Analysis and Outlook
8.3.7. Rest of Europe Food Sweeteners Regional Analysis and Outlook
8.4. Asia Pacific Food Sweeteners Revenue (USD Million) by Country (2021-2032)
8.4.1. China Food Sweeteners Regional Analysis and Outlook
8.4.2. Japan Food Sweeteners Regional Analysis and Outlook
8.4.3. India Food Sweeteners Regional Analysis and Outlook
8.4.4. South Korea Food Sweeteners Regional Analysis and Outlook
8.4.5. Australia Food Sweeteners Regional Analysis and Outlook
8.4.6. South East Asia Food Sweeteners Regional Analysis and Outlook
8.4.7. Rest of Asia Pacific Food Sweeteners Regional Analysis and Outlook
8.5. South America Food Sweeteners Revenue (USD Million), by Country (2021-2032)
8.5.1. Brazil Food Sweeteners Regional Analysis and Outlook
8.5.2. Argentina Food Sweeteners Regional Analysis and Outlook
8.5.3. Rest of South America Food Sweeteners Regional Analysis and Outlook
8.6. Middle East and Africa Food Sweeteners Revenue (USD Million) by Country (2021-2032)
8.6.1. Middle East Food Sweeteners Regional Analysis and Outlook
8.6.2. Africa Food Sweeteners Regional Analysis and Outlook
Chapter 9. North America Food Sweeteners Analysis and Outlook
9.1. North America Food Sweeteners Revenue (USD Million) by Segments (2021-2032)
9.1.1. North America Food Sweeteners Revenue (USD Million) by Type (2021-2032)
9.1.2. North America Food Sweeteners Revenue (USD Million) by Application (2021-2032)
9.1.3. North America Food Sweeteners Revenue (USD Million) by Product (2021-2032)
By Product
Sucrose
Starch Sweeteners and Sugar Alcohols
-Dextrose
-High Fructose Corn Syrup
-Maltodextrin
-Sorbitol
-Xylitol
-Others
High-intensity Sweeteners
-Sucralose
-Aspartame
-Saccharin
-Neotame
-Stevia
-Cyclamate
-Ascesulfame Potassium
-Others
By Application
Bakery and Confectionery
Dairy and Desserts
Beverages
Meat and Meat Products
Soups, Sauces, and Dressings
Others
Chapter 10. Europe Food Sweeteners Analysis and Outlook
10.1. Europe Food Sweeteners Revenue (USD Million), by Segments (USD Million) (2021-2032)
10.1.1. Europe Food Sweeteners Revenue (USD Million) by Type (2021-2032)
10.1.2. Europe Food Sweeteners Revenue (USD Million) by Application (2021-2032)
10.1.3. Europe Food Sweeteners Revenue (USD Million) by Product (2021-2032)
By Product
Sucrose
Starch Sweeteners and Sugar Alcohols
-Dextrose
-High Fructose Corn Syrup
-Maltodextrin
-Sorbitol
-Xylitol
-Others
High-intensity Sweeteners
-Sucralose
-Aspartame
-Saccharin
-Neotame
-Stevia
-Cyclamate
-Ascesulfame Potassium
-Others
By Application
Bakery and Confectionery
Dairy and Desserts
Beverages
Meat and Meat Products
Soups, Sauces, and Dressings
Others
Chapter 11. Asia Pacific Food Sweeteners Analysis and Outlook
11.1. Asia Pacific Food Sweeteners Revenue (USD Million), and Revenue (USD Million) by Segments (2021-2032)
11.1.1. Asia Pacific Food Sweeteners Revenue (USD Million) by Type (2021-2032)
11.1.2. Asia Pacific Food Sweeteners Revenue (USD Million) by Application (2021-2032)
11.1.3. Asia Pacific Food Sweeteners Revenue (USD Million) by Product (2021-2032)
By Product
Sucrose
Starch Sweeteners and Sugar Alcohols
-Dextrose
-High Fructose Corn Syrup
-Maltodextrin
-Sorbitol
-Xylitol
-Others
High-intensity Sweeteners
-Sucralose
-Aspartame
-Saccharin
-Neotame
-Stevia
-Cyclamate
-Ascesulfame Potassium
-Others
By Application
Bakery and Confectionery
Dairy and Desserts
Beverages
Meat and Meat Products
Soups, Sauces, and Dressings
Others
Chapter 12. South America Food Sweeteners Analysis and Outlook
12.1. South America Food Sweeteners Revenue (USD Million), by Segments (2021-2032)
12.1.1. South America Food Sweeteners Revenue (USD Million) by Type (2021-2032)
12.1.2. South America Food Sweeteners Revenue (USD Million) by Application (2021-2032)
12.1.3. South America Food Sweeteners Revenue (USD Million) by Product (2021-2032)
By Product
Sucrose
Starch Sweeteners and Sugar Alcohols
-Dextrose
-High Fructose Corn Syrup
-Maltodextrin
-Sorbitol
-Xylitol
-Others
High-intensity Sweeteners
-Sucralose
-Aspartame
-Saccharin
-Neotame
-Stevia
-Cyclamate
-Ascesulfame Potassium
-Others
By Application
Bakery and Confectionery
Dairy and Desserts
Beverages
Meat and Meat Products
Soups, Sauces, and Dressings
Others
Chapter 13. Middle East and Africa Food Sweeteners Analysis and Outlook
13.1. Middle East and Africa Food Sweeteners Revenue (USD Million), by Segments (2021-2032)
13.1.1. Middle East and Africa Food Sweeteners Revenue (USD Million) by Type (2021-2032)
13.1.2. Middle East and Africa Food Sweeteners Revenue (USD Million) by Application (2021-2032)
13.1.3. Middle East and Africa Food Sweeteners Revenue (USD Million) by Product (2021-2032)
By Product
Sucrose
Starch Sweeteners and Sugar Alcohols
-Dextrose
-High Fructose Corn Syrup
-Maltodextrin
-Sorbitol
-Xylitol
-Others
High-intensity Sweeteners
-Sucralose
-Aspartame
-Saccharin
-Neotame
-Stevia
-Cyclamate
-Ascesulfame Potassium
-Others
By Application
Bakery and Confectionery
Dairy and Desserts
Beverages
Meat and Meat Products
Soups, Sauces, and Dressings
Others
Chapter 14. Food Sweeteners Company Profiles
14.1 Business Overview
14.2 Product Profiles
14.3 SWOT Profiles
14.5 Recent Developments
14.6 Financial Profile
List of Companies
Ajinomoto Co. Inc
Archer Daniels Midland Company (ADM)
Cargill Inc
DuPont de Nemours Inc
Foodchem International Corp
GLG Life Tech Corp
Ingredion Inc
NutraSweet Company
Tate & Lyle PLC
Tereos SA
15. Methodology and Data Sources
15.1 Customization Offerings
15.2 Subscription Services
15.3 Related Reports
15.4 Publisher Expertise
LIST OF TABLES
Table 1 Market Segmentation Analysis
Table 2 Global Food Sweeteners Market Share of Leading Companies, 2023
Table 3 Product Offerings of Leading Companies
Table 4 Low Growth Scenario Forecasts
Table 5 Reference Case Growth Scenario
Table 6 High Growth Case Scenario
Table 7 Global Food Sweeteners Revenue (USD Million) And CAGR (%) By Type (2021-2032)
Table 8 Global Food Sweeteners Revenue (USD Million) And CAGR (%) By Application (2021-2032)
Table 9 Global Food Sweeteners Revenue (USD Million) And CAGR (%) By Product (2021-2032)
Table 10 Global Food Sweeteners Market Revenue (USD Million) By Regions (2021-2032)
Table 11 Global Food Sweeteners Market Share (%) By Regions (2021-2032)
Table 12 North America Food Sweeteners Revenue (USD Million) By Country (2021-2032)
Table 13 Europe Food Sweeteners Revenue (USD Million) By Country (2021-2032)
Table 14 Asia Pacific Food Sweeteners Revenue (USD Million) By Country (2021-2032)
Table 15 South America Food Sweeteners Revenue (USD Million) By Country (2021-2032)
Table 16 Middle East and Africa Food Sweeteners Revenue (USD Million) By Region (2021-2032)
Table 17 North America Food Sweeteners Revenue (USD Million) By Type (2021-2032)
Table 18 North America Food Sweeteners Revenue (USD Million) By Application (2021-2032)
Table 19 North America Food Sweeteners Revenue (USD Million) By Product (2021-2032)
Table 20 Europe Food Sweeteners Revenue (USD Million) By Type (2021-2032)
Table 21 Europe Food Sweeteners Revenue (USD Million) By Application (2021-2032)
Table 22 Europe Food Sweeteners Revenue (USD Million) By Product (2021-2032)
Table 23 Asia Pacific Food Sweeteners Revenue (USD Million) By Type (2021-2032)
Table 24 Asia Pacific Food Sweeteners Revenue (USD Million) By Application (2021-2032)
Table 25 Asia Pacific Food Sweeteners Revenue (USD Million) By Product (2021-2032)
Table 26 South America Food Sweeteners Revenue (USD Million) By Type (2021-2032)
Table 27 South America Food Sweeteners Revenue (USD Million) By Application (2021-2032)
Table 28 South America Food Sweeteners Revenue (USD Million) By Product (2021-2032)
Table 29 Middle East and Africa Food Sweeteners Revenue (USD Million) By Type (2021-2032)
Table 30 Middle East and Africa Food Sweeteners Revenue (USD Million) By Application (2021-2032)
Table 31 Middle East and Africa Food Sweeteners Revenue (USD Million) By Product (2021-2032)
LIST OF FIGURES
Figure 1. Market Scope
Figure 2. Pricing Forecasts Per Unit, 2023- 2032
Figure 3. Porter’s Five Forces
Figure 4. Global Food Sweeteners Market Revenue (USD Million) By Regions (2021-2032)
Figure 5. Global Food Sweeteners Market Share (%) By Regions (2023)
Figure 6. North America Food Sweeteners Revenue (USD Million) By Country (2021-2032)
Figure 7. United States Food Sweeteners Revenue (USD Million) By Country (2021-2032)
Figure 8. Canada Food Sweeteners Revenue (USD Million) By Country (2021-2032)
Figure 9. Mexico Food Sweeteners Revenue (USD Million) By Country (2021-2032)
Figure 10. Europe Food Sweeteners Revenue (USD Million) By Country (2021-2032)
Figure 11. Germany Food Sweeteners Revenue (USD Million) By Country (2021-2032)
Figure 12. France Food Sweeteners Revenue (USD Million) By Country (2021-2032)
Figure 13. United Kingdom Food Sweeteners Revenue (USD Million) By Country (2021-2032)
Figure 14. Spain Food Sweeteners Revenue (USD Million) By Country (2021-2032)
Figure 15. Italy Food Sweeteners Revenue (USD Million) By Country (2021-2032)
Figure 16. Russia Food Sweeteners Revenue (USD Million) By Country (2021-2032)
Figure 17. Rest of Europe Food Sweeteners Revenue (USD Million) By Country (2021-2032)
Figure 11. Asia Pacific Food Sweeteners Revenue (USD Million) By Country (2021-2032)
Figure 12. China Food Sweeteners Revenue (USD Million) By Country (2021-2032)
Figure 13. Japan Food Sweeteners Revenue (USD Million) By Country (2021-2032)
Figure 14. India Food Sweeteners Revenue (USD Million) By Country (2021-2032)
Figure 15. South Korea Food Sweeteners Revenue (USD Million) By Country (2021-2032)
Figure 16. Australia Food Sweeteners Revenue (USD Million) By Country (2021-2032)
Figure 17. South East Asia Food Sweeteners Revenue (USD Million) By Country (2021-2032)
Figure 18. South America Food Sweeteners Revenue (USD Million) By Country (2021-2032)
Figure 19. Brazil Food Sweeteners Revenue (USD Million) By Country (2021-2032)
Figure 20. Argentina Food Sweeteners Revenue (USD Million) By Country (2021-2032)
Figure 21. Rest of Asia Pacific Food Sweeteners Revenue (USD Million) By Country (2021-2032)
Figure 22. Middle East and Africa Food Sweeteners Revenue (USD Million) By Region (2021-2032)
Figure 23. Saudi Arabia Food Sweeteners Revenue (USD Million) By Region (2021-2032)
Figure 24. The UAE Food Sweeteners Revenue (USD Million) By Region (2021-2032)
Figure 25. Rest of Middle East Food Sweeteners Revenue (USD Million) By Region (2021-2032)
Figure 26. South Africa Food Sweeteners Revenue (USD Million) By Region (2021-2032)
Figure 27. Africa Food Sweeteners Revenue (USD Million) By Region (2021-2032)
Figure 28. North America Food Sweeteners Revenue (USD Million) By Type (2021-2032)
Figure 29. North America Food Sweeteners Revenue (USD Million) By Application (2021-2032)
Figure 30. North America Food Sweeteners Revenue (USD Million) By Product (2021-2032)
Figure 31. Europe Food Sweeteners Revenue (USD Million) By Type (2021-2032)
Figure 32. Europe Food Sweeteners Revenue (USD Million) By Application (2021-2032)
Figure 33. Europe Food Sweeteners Revenue (USD Million) By Product (2021-2032)
Figure 34. Asia Pacific Food Sweeteners Revenue (USD Million) By Type (2021-2032)
Figure 35. Asia Pacific Food Sweeteners Revenue (USD Million) By Application (2021-2032)
Figure 36. Asia Pacific Food Sweeteners Revenue (USD Million) By Product (2021-2032)
Figure 37. South America Food Sweeteners Revenue (USD Million) By Type (2021-2032)
Figure 38. South America Food Sweeteners Revenue (USD Million) By Application (2021-2032)
Figure 39. South America Food Sweeteners Revenue (USD Million) By Product (2021-2032)
Figure 40. Middle East and Africa Food Sweeteners Revenue (USD Million) By Type (2021-2032)
Figure 41. Middle East and Africa Food Sweeteners Revenue (USD Million) By Application (2021-2032)
Figure 42. Middle East and Africa Food Sweeteners Revenue (USD Million) By Product (2021-2032)
By Product
Sucrose
Starch Sweeteners and Sugar Alcohols
-Dextrose
-High Fructose Corn Syrup
-Maltodextrin
-Sorbitol
-Xylitol
-Others
High-intensity Sweeteners
-Sucralose
-Aspartame
-Saccharin
-Neotame
-Stevia
-Cyclamate
-Ascesulfame Potassium
-Others
By Application
Bakery and Confectionery
Dairy and Desserts
Beverages
Meat and Meat Products
Soups, Sauces, and Dressings
Others
Countries Analyzed
North America (US, Canada, Mexico)
Europe (Germany, UK, France, Spain, Italy, Russia, Rest of Europe)
Asia Pacific (China, India, Japan, South Korea, Australia, South East Asia, Rest of Asia)
South America (Brazil, Argentina, Rest of South America)
Middle East and Africa (Saudi Arabia, UAE, Rest of Middle East, South Africa, Egypt, Rest of Africa)
