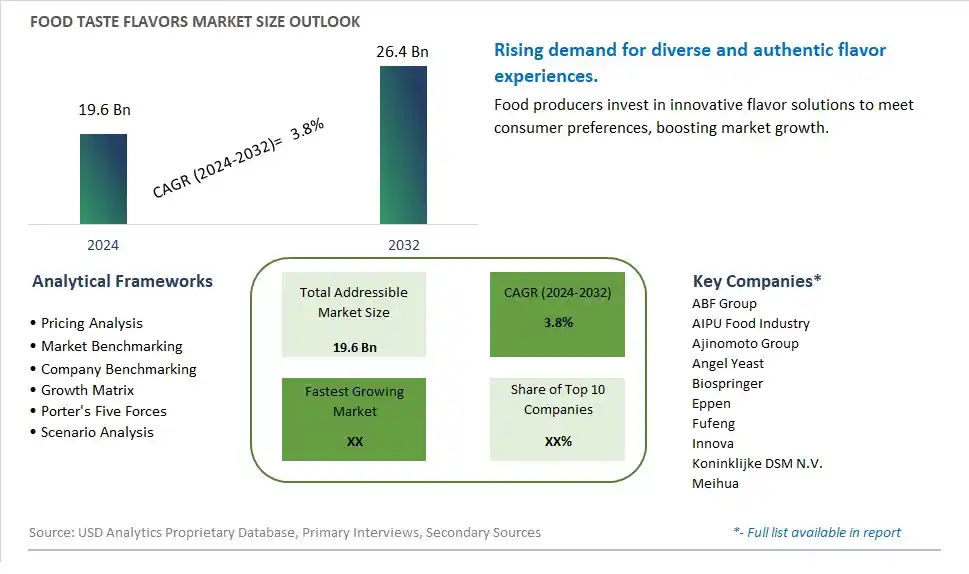
Global Food Taste Flavors Market Size is valued at $19.6 Billion in 2024 and is forecast to register a growth rate (CAGR) of 3.8% to reach $26.4 Billion by 2032.
The global Food Taste Flavors Market Comprehensive Study analyzes and forecasts the market size across 6 regions and 24 countries for diverse segments -By Type (Monosodium Glutamate (MSG), Hydrolyzed Vegetable Protein (HVP), Yeast Extract, Others), By Application (Food Processing Industry, Restaurants, Home Cooking)
An Introduction to Food Taste Flavors Market
The Food Taste Flavors market in 2024 is witnessing robust growth, driven by the increasing demand for innovative and authentic taste experiences in food and beverage products. Food taste flavors, including sweet, savory, and umami, are used to enhance the sensory attributes of products. The market benefits from advancements in flavor formulation and delivery technologies, the growing trend of global and ethnic cuisines, and the expansion of the functional and specialty food sectors. Additionally, the rising focus on clean label and natural flavor solutions is contributing to market growth.
Food Taste Flavors Competitive Landscape
The market report analyses the leading companies in the industry including ABF Group, AIPU Food Industry, Ajinomoto Group, Angel Yeast, Biospringer, Eppen, Fufeng, Innova, Koninklijke DSM N.V., Meihua, and Others.
Food Taste Flavors Market Dynamics
Food Taste Flavors Market Trend: Rising Demand for Natural and Authentic Flavors
The most prominent trend in the Food Taste Flavors Market is the rising demand for natural and authentic flavors. Consumers are increasingly seeking food products that offer genuine and recognizable flavors, free from artificial additives and synthetic ingredients. This trend is driven by the clean label movement and the desire for more natural and transparent food choices. Manufacturers are responding by developing flavors derived from natural sources that meet consumer expectations for authenticity and quality.
Food Taste Flavors Market Driver: Increase in Global Culinary Exploration
The key driver of the Food Taste Flavors Market is the increase in global culinary exploration. As consumers become more adventurous in their food choices, there is a growing demand for diverse and exotic flavors from different cultures and cuisines. This driver is encouraging manufacturers to innovate and introduce new and unique flavors that cater to the evolving tastes of consumers, driving market growth.
Food Taste Flavors Market Opportunity: Innovation in Flavor Extraction and Enhancement Technologies
A significant opportunity in the Food Taste Flavors Market lies in innovation in flavor extraction and enhancement technologies. By developing advanced techniques to extract and enhance natural flavors, companies can create high-quality flavor products that deliver intense and authentic taste experiences. Investing in research and development to improve flavor technologies can help manufacturers differentiate their products and capture a larger share of the competitive flavor market.
Food Taste Flavors Market Share Analysis: Monosodium Glutamate (MSG) segment generated the highest revenue share in the industry
Monosodium Glutamate (MSG) stands out as the largest segment in the Food Taste Flavors market. MSG is a flavor enhancer widely used in various cuisines globally to amplify the savory taste, known as umami, in dishes. Its popularity stems from its ability to intensify and round out flavors, making it a staple in processed foods, soups, sauces, and snacks. MSG is derived from glutamic acid, a naturally occurring amino acid found in many foods like tomatoes, cheese, and mushrooms. In food processing, MSG is added to enhance the overall taste profile by balancing and enhancing existing flavors without imparting its own taste. Despite some controversies surrounding its health effects, MSG continues to be a preferred choice for food manufacturers due to its cost-effectiveness and effectiveness in improving flavor perception. As consumer preferences for savory and umami flavors grow, especially in Asian and international cuisines, the demand for MSG is expected to maintain its dominance in the food taste flavors market. This trend underscores MSG's crucial role in meeting consumer expectations for taste enhancement and its integral part in the global food industry's flavor innovation efforts.
Food Taste Flavors Market Share Analysis: Food Processing Industry is the fastest growing segment over the forecast period to 2032
The Food Processing Industry emerges as the fastest growing segment in the Food Taste Flavors market to 2032. This sector encompasses a wide range of applications where flavor enhancement plays a crucial role in product development and consumer satisfaction. Food processors utilize taste flavors extensively to improve the sensory appeal of packaged foods, snacks, beverages, and ready-to-eat meals. The demand is driven by the growing consumer preference for convenience foods and the need for consistent taste profiles across global markets. Taste flavors not only mask undesirable tastes that may arise during processing but also help in maintaining flavor integrity and enhancing palatability. As food manufacturers continue to innovate and expand their product offerings to meet diverse consumer tastes and preferences, the use of taste flavors in food processing is expected to grow significantly. This growth is supported by advancements in flavor technology, regulatory approvals for new flavor formulations, and increasing investments in research and development by food companies aiming to stay competitive in the dynamic global market landscape.
Food Taste Flavors Market Segmentation
By Type
Monosodium Glutamate (MSG)
Hydrolyzed Vegetable Protein (HVP)
Yeast Extract
Others
By Application
Food Processing Industry
Restaurants
Home Cooking
Countries Analyzed
North America (US, Canada, Mexico)
Europe (Germany, UK, France, Spain, Italy, Russia, Rest of Europe)
Asia Pacific (China, India, Japan, South Korea, Australia, South East Asia, Rest of Asia)
South America (Brazil, Argentina, Rest of South America)
Middle East and Africa (Saudi Arabia, UAE, Rest of Middle East, South Africa, Egypt, Rest of Africa)
Food Taste Flavors Companies Profiled in the Study
ABF Group
AIPU Food Industry
Ajinomoto Group
Angel Yeast
Biospringer
Eppen
Fufeng
Innova
Koninklijke DSM N.V.
Meihua
*- List Not Exhaustive
Chapter 1. TABLE OF CONTENTS
Chapter 2. Introduction to Food Taste Flavors Market
2.1. Market Overview
2.2. Key Statistics and Report Highlights
2.3. Scope of the Comprehensive Study
2.3.1. Market Definition
2.3.2 Countries and Regions Covered
2.3.3 Research Objective
2.3.4 Units, Currency, and Conversions
2.3.5 Industry Value Chain
2.4. Key Market Segments
2.5. Key Companies
2.6. Study Period
Chapter 3. Strategic Analysis Review
3.1. Food Taste Flavors Pricing Analysis and Forecast
3.2. Porter’s Five Forces
3.3. Market Ecosystem
3.4. SWOT Analysis
3.5. Regulatory Scenario
3.3. Effects of Inflation, Russia-Ukraine War, moderating economic growth, and other macroeconomic factors
Chapter 4. Competitive Landscape
4.1. Market Share Analysis
4.1.1. Global Food Taste Flavors Market Share by Company, 2023
4.1.2. Product Offerings of Leading Food Taste Flavors Companies
4.2. Market Entropy
4.2.1. New Product Launches in the Industry
4.2.2. Mergers, Acquisitions, Joint ventures, and Partnerships
4.3. Key Strategies and Best Practices
Chapter 5. Global Market Projections: Best, Reference, and Low Case Scenarios
5.1. Growth Analysis- Case Scenario Definitions
5.2. Low Growth Case Scenario Forecasts
5.3. Reference Growth Case Scenario Forecasts
5.4. High Growth Case Scenario Forecasts
Chapter 6. Market Dynamics
6.1. Food Taste Flavors Market Drivers
6.2. Food Taste Flavors Market Challenges
6.6. Food Taste Flavors Market Opportunities
6.4. Food Taste Flavors Market Trends
Chapter 7. Global Food Taste Flavors Market Outlook Trends
7.1. Global Food Taste Flavors Revenue (USD Million) and CAGR (%) by Type (2021-2032)
7.2. Global Food Taste Flavors Revenue (USD Million) and CAGR (%) by Application (2021-2032)
7.3. Global Food Taste Flavors Revenue (USD Million) and CAGR (%) by Product (2021-2032)
By Type
Monosodium Glutamate (MSG)
Hydrolyzed Vegetable Protein (HVP)
Yeast Extract
Others
By Application
Food Processing Industry
Restaurants
Home Cooking
Chapter 8. Global Food Taste Flavors Regional Analysis and Outlook
8.1. Global Food Taste Flavors Revenue (USD Million) By Regions (2021- 2032)
8.2. North America Food Taste Flavors Revenue (USD Million) by Country (2021-2032)
8.2.1. United States Food Taste Flavors Regional Analysis and Outlook
8.2.2. Canada Food Taste Flavors Regional Analysis and Outlook
8.2.3. Mexico Food Taste Flavors Regional Analysis and Outlook
8.3. Europe Food Taste Flavors Revenue (USD Million), by Country (2021-2032)
8.3.1. Germany Food Taste Flavors Regional Analysis and Outlook
8.3.2. France Food Taste Flavors Regional Analysis and Outlook
8.3.3. United Kingdom Food Taste Flavors Regional Analysis and Outlook
8.3.4. Spain Food Taste Flavors Regional Analysis and Outlook
8.3.5. Italy Food Taste Flavors Regional Analysis and Outlook
8.3.6. Russia Food Taste Flavors Regional Analysis and Outlook
8.3.7. Rest of Europe Food Taste Flavors Regional Analysis and Outlook
8.4. Asia Pacific Food Taste Flavors Revenue (USD Million) by Country (2021-2032)
8.4.1. China Food Taste Flavors Regional Analysis and Outlook
8.4.2. Japan Food Taste Flavors Regional Analysis and Outlook
8.4.3. India Food Taste Flavors Regional Analysis and Outlook
8.4.4. South Korea Food Taste Flavors Regional Analysis and Outlook
8.4.5. Australia Food Taste Flavors Regional Analysis and Outlook
8.4.6. South East Asia Food Taste Flavors Regional Analysis and Outlook
8.4.7. Rest of Asia Pacific Food Taste Flavors Regional Analysis and Outlook
8.5. South America Food Taste Flavors Revenue (USD Million), by Country (2021-2032)
8.5.1. Brazil Food Taste Flavors Regional Analysis and Outlook
8.5.2. Argentina Food Taste Flavors Regional Analysis and Outlook
8.5.3. Rest of South America Food Taste Flavors Regional Analysis and Outlook
8.6. Middle East and Africa Food Taste Flavors Revenue (USD Million) by Country (2021-2032)
8.6.1. Middle East Food Taste Flavors Regional Analysis and Outlook
8.6.2. Africa Food Taste Flavors Regional Analysis and Outlook
Chapter 9. North America Food Taste Flavors Analysis and Outlook
9.1. North America Food Taste Flavors Revenue (USD Million) by Segments (2021-2032)
9.1.1. North America Food Taste Flavors Revenue (USD Million) by Type (2021-2032)
9.1.2. North America Food Taste Flavors Revenue (USD Million) by Application (2021-2032)
9.1.3. North America Food Taste Flavors Revenue (USD Million) by Product (2021-2032)
By Type
Monosodium Glutamate (MSG)
Hydrolyzed Vegetable Protein (HVP)
Yeast Extract
Others
By Application
Food Processing Industry
Restaurants
Home Cooking
Chapter 10. Europe Food Taste Flavors Analysis and Outlook
10.1. Europe Food Taste Flavors Revenue (USD Million), by Segments (USD Million) (2021-2032)
10.1.1. Europe Food Taste Flavors Revenue (USD Million) by Type (2021-2032)
10.1.2. Europe Food Taste Flavors Revenue (USD Million) by Application (2021-2032)
10.1.3. Europe Food Taste Flavors Revenue (USD Million) by Product (2021-2032)
By Type
Monosodium Glutamate (MSG)
Hydrolyzed Vegetable Protein (HVP)
Yeast Extract
Others
By Application
Food Processing Industry
Restaurants
Home Cooking
Chapter 11. Asia Pacific Food Taste Flavors Analysis and Outlook
11.1. Asia Pacific Food Taste Flavors Revenue (USD Million), and Revenue (USD Million) by Segments (2021-2032)
11.1.1. Asia Pacific Food Taste Flavors Revenue (USD Million) by Type (2021-2032)
11.1.2. Asia Pacific Food Taste Flavors Revenue (USD Million) by Application (2021-2032)
11.1.3. Asia Pacific Food Taste Flavors Revenue (USD Million) by Product (2021-2032)
By Type
Monosodium Glutamate (MSG)
Hydrolyzed Vegetable Protein (HVP)
Yeast Extract
Others
By Application
Food Processing Industry
Restaurants
Home Cooking
Chapter 12. South America Food Taste Flavors Analysis and Outlook
12.1. South America Food Taste Flavors Revenue (USD Million), by Segments (2021-2032)
12.1.1. South America Food Taste Flavors Revenue (USD Million) by Type (2021-2032)
12.1.2. South America Food Taste Flavors Revenue (USD Million) by Application (2021-2032)
12.1.3. South America Food Taste Flavors Revenue (USD Million) by Product (2021-2032)
By Type
Monosodium Glutamate (MSG)
Hydrolyzed Vegetable Protein (HVP)
Yeast Extract
Others
By Application
Food Processing Industry
Restaurants
Home Cooking
Chapter 13. Middle East and Africa Food Taste Flavors Analysis and Outlook
13.1. Middle East and Africa Food Taste Flavors Revenue (USD Million), by Segments (2021-2032)
13.1.1. Middle East and Africa Food Taste Flavors Revenue (USD Million) by Type (2021-2032)
13.1.2. Middle East and Africa Food Taste Flavors Revenue (USD Million) by Application (2021-2032)
13.1.3. Middle East and Africa Food Taste Flavors Revenue (USD Million) by Product (2021-2032)
By Type
Monosodium Glutamate (MSG)
Hydrolyzed Vegetable Protein (HVP)
Yeast Extract
Others
By Application
Food Processing Industry
Restaurants
Home Cooking
Chapter 14. Food Taste Flavors Company Profiles
14.1 Business Overview
14.2 Product Profiles
14.3 SWOT Profiles
14.5 Recent Developments
14.6 Financial Profile
List of Companies
ABF Group
AIPU Food Industry
Ajinomoto Group
Angel Yeast
Biospringer
Eppen
Fufeng
Innova
Koninklijke DSM N.V.
Meihua
15. Methodology and Data Sources
15.1 Customization Offerings
15.2 Subscription Services
15.3 Related Reports
15.4 Publisher Expertise
LIST OF TABLES
Table 1 Market Segmentation Analysis
Table 2 Global Food Taste Flavors Market Share of Leading Companies, 2023
Table 3 Product Offerings of Leading Companies
Table 4 Low Growth Scenario Forecasts
Table 5 Reference Case Growth Scenario
Table 6 High Growth Case Scenario
Table 7 Global Food Taste Flavors Revenue (USD Million) And CAGR (%) By Type (2021-2032)
Table 8 Global Food Taste Flavors Revenue (USD Million) And CAGR (%) By Application (2021-2032)
Table 9 Global Food Taste Flavors Revenue (USD Million) And CAGR (%) By Product (2021-2032)
Table 10 Global Food Taste Flavors Market Revenue (USD Million) By Regions (2021-2032)
Table 11 Global Food Taste Flavors Market Share (%) By Regions (2021-2032)
Table 12 North America Food Taste Flavors Revenue (USD Million) By Country (2021-2032)
Table 13 Europe Food Taste Flavors Revenue (USD Million) By Country (2021-2032)
Table 14 Asia Pacific Food Taste Flavors Revenue (USD Million) By Country (2021-2032)
Table 15 South America Food Taste Flavors Revenue (USD Million) By Country (2021-2032)
Table 16 Middle East and Africa Food Taste Flavors Revenue (USD Million) By Region (2021-2032)
Table 17 North America Food Taste Flavors Revenue (USD Million) By Type (2021-2032)
Table 18 North America Food Taste Flavors Revenue (USD Million) By Application (2021-2032)
Table 19 North America Food Taste Flavors Revenue (USD Million) By Product (2021-2032)
Table 20 Europe Food Taste Flavors Revenue (USD Million) By Type (2021-2032)
Table 21 Europe Food Taste Flavors Revenue (USD Million) By Application (2021-2032)
Table 22 Europe Food Taste Flavors Revenue (USD Million) By Product (2021-2032)
Table 23 Asia Pacific Food Taste Flavors Revenue (USD Million) By Type (2021-2032)
Table 24 Asia Pacific Food Taste Flavors Revenue (USD Million) By Application (2021-2032)
Table 25 Asia Pacific Food Taste Flavors Revenue (USD Million) By Product (2021-2032)
Table 26 South America Food Taste Flavors Revenue (USD Million) By Type (2021-2032)
Table 27 South America Food Taste Flavors Revenue (USD Million) By Application (2021-2032)
Table 28 South America Food Taste Flavors Revenue (USD Million) By Product (2021-2032)
Table 29 Middle East and Africa Food Taste Flavors Revenue (USD Million) By Type (2021-2032)
Table 30 Middle East and Africa Food Taste Flavors Revenue (USD Million) By Application (2021-2032)
Table 31 Middle East and Africa Food Taste Flavors Revenue (USD Million) By Product (2021-2032)
LIST OF FIGURES
Figure 1. Market Scope
Figure 2. Pricing Forecasts Per Unit, 2023- 2032
Figure 3. Porter’s Five Forces
Figure 4. Global Food Taste Flavors Market Revenue (USD Million) By Regions (2021-2032)
Figure 5. Global Food Taste Flavors Market Share (%) By Regions (2023)
Figure 6. North America Food Taste Flavors Revenue (USD Million) By Country (2021-2032)
Figure 7. United States Food Taste Flavors Revenue (USD Million) By Country (2021-2032)
Figure 8. Canada Food Taste Flavors Revenue (USD Million) By Country (2021-2032)
Figure 9. Mexico Food Taste Flavors Revenue (USD Million) By Country (2021-2032)
Figure 10. Europe Food Taste Flavors Revenue (USD Million) By Country (2021-2032)
Figure 11. Germany Food Taste Flavors Revenue (USD Million) By Country (2021-2032)
Figure 12. France Food Taste Flavors Revenue (USD Million) By Country (2021-2032)
Figure 13. United Kingdom Food Taste Flavors Revenue (USD Million) By Country (2021-2032)
Figure 14. Spain Food Taste Flavors Revenue (USD Million) By Country (2021-2032)
Figure 15. Italy Food Taste Flavors Revenue (USD Million) By Country (2021-2032)
Figure 16. Russia Food Taste Flavors Revenue (USD Million) By Country (2021-2032)
Figure 17. Rest of Europe Food Taste Flavors Revenue (USD Million) By Country (2021-2032)
Figure 11. Asia Pacific Food Taste Flavors Revenue (USD Million) By Country (2021-2032)
Figure 12. China Food Taste Flavors Revenue (USD Million) By Country (2021-2032)
Figure 13. Japan Food Taste Flavors Revenue (USD Million) By Country (2021-2032)
Figure 14. India Food Taste Flavors Revenue (USD Million) By Country (2021-2032)
Figure 15. South Korea Food Taste Flavors Revenue (USD Million) By Country (2021-2032)
Figure 16. Australia Food Taste Flavors Revenue (USD Million) By Country (2021-2032)
Figure 17. South East Asia Food Taste Flavors Revenue (USD Million) By Country (2021-2032)
Figure 18. South America Food Taste Flavors Revenue (USD Million) By Country (2021-2032)
Figure 19. Brazil Food Taste Flavors Revenue (USD Million) By Country (2021-2032)
Figure 20. Argentina Food Taste Flavors Revenue (USD Million) By Country (2021-2032)
Figure 21. Rest of Asia Pacific Food Taste Flavors Revenue (USD Million) By Country (2021-2032)
Figure 22. Middle East and Africa Food Taste Flavors Revenue (USD Million) By Region (2021-2032)
Figure 23. Saudi Arabia Food Taste Flavors Revenue (USD Million) By Region (2021-2032)
Figure 24. The UAE Food Taste Flavors Revenue (USD Million) By Region (2021-2032)
Figure 25. Rest of Middle East Food Taste Flavors Revenue (USD Million) By Region (2021-2032)
Figure 26. South Africa Food Taste Flavors Revenue (USD Million) By Region (2021-2032)
Figure 27. Africa Food Taste Flavors Revenue (USD Million) By Region (2021-2032)
Figure 28. North America Food Taste Flavors Revenue (USD Million) By Type (2021-2032)
Figure 29. North America Food Taste Flavors Revenue (USD Million) By Application (2021-2032)
Figure 30. North America Food Taste Flavors Revenue (USD Million) By Product (2021-2032)
Figure 31. Europe Food Taste Flavors Revenue (USD Million) By Type (2021-2032)
Figure 32. Europe Food Taste Flavors Revenue (USD Million) By Application (2021-2032)
Figure 33. Europe Food Taste Flavors Revenue (USD Million) By Product (2021-2032)
Figure 34. Asia Pacific Food Taste Flavors Revenue (USD Million) By Type (2021-2032)
Figure 35. Asia Pacific Food Taste Flavors Revenue (USD Million) By Application (2021-2032)
Figure 36. Asia Pacific Food Taste Flavors Revenue (USD Million) By Product (2021-2032)
Figure 37. South America Food Taste Flavors Revenue (USD Million) By Type (2021-2032)
Figure 38. South America Food Taste Flavors Revenue (USD Million) By Application (2021-2032)
Figure 39. South America Food Taste Flavors Revenue (USD Million) By Product (2021-2032)
Figure 40. Middle East and Africa Food Taste Flavors Revenue (USD Million) By Type (2021-2032)
Figure 41. Middle East and Africa Food Taste Flavors Revenue (USD Million) By Application (2021-2032)
Figure 42. Middle East and Africa Food Taste Flavors Revenue (USD Million) By Product (2021-2032)
By Type
Monosodium Glutamate (MSG)
Hydrolyzed Vegetable Protein (HVP)
Yeast Extract
Others
By Application
Food Processing Industry
Restaurants
Home Cooking
Countries Analyzed
North America (US, Canada, Mexico)
Europe (Germany, UK, France, Spain, Italy, Russia, Rest of Europe)
Asia Pacific (China, India, Japan, South Korea, Australia, South East Asia, Rest of Asia)
South America (Brazil, Argentina, Rest of South America)
Middle East and Africa (Saudi Arabia, UAE, Rest of Middle East, South Africa, Egypt, Rest of Africa)
