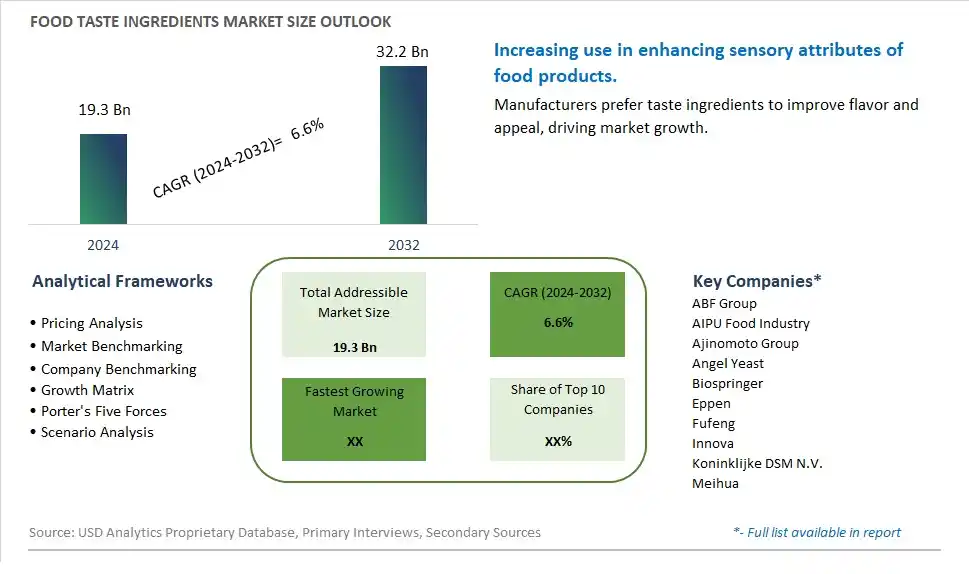
Global Food Taste Ingredients Market Size is valued at $19.3 Billion in 2024 and is forecast to register a growth rate (CAGR) of 6.6% to reach $32.2 Billion by 2032.
The global Food Taste Ingredients Market Comprehensive Study analyzes and forecasts the market size across 6 regions and 24 countries for diverse segments -By Type (Monosodium Glutamate (MSG), Hydrolyzed Vegetable Protein (HVP), Yeast Extract, Others), By Application (Food Processing Industry, Restaurants, Home Cooking)
An Introduction to Food Taste Ingredients Market
The Food Taste Ingredients market in 2024 is experiencing significant growth, driven by the increasing demand for ingredients that enhance the flavor and sensory profile of food and beverages. Taste ingredients, such as flavor enhancers, sweeteners, and spices, are essential for creating appealing taste profiles. The market benefits from advancements in ingredient formulation and processing technologies, the growing trend of convenience and processed foods, and the expansion of the global food industry. Additionally, the rising consumer preference for high-quality and authentic flavors is contributing to market growth.
Food Taste Ingredients Competitive Landscape
The market report analyses the leading companies in the industry including ABF Group, AIPU Food Industry, Ajinomoto Group, Angel Yeast, Biospringer, Eppen, Fufeng, Innova, Koninklijke DSM N.V., Meihua, and Others.
Food Taste Ingredients Market Dynamics
Food Taste Ingredients Market Trend: Increasing Focus on Health and Wellness
The most prominent trend in the Food Taste Ingredients Market is the increasing focus on health and wellness. As consumers become more health-conscious, there is a growing demand for taste ingredients that not only enhance flavor but also offer nutritional benefits. This trend is driven by the desire for healthier food choices that do not compromise on taste. Manufacturers are developing taste ingredients that align with health and wellness trends, such as low-sodium, low-sugar, and high-fiber options.
Food Taste Ingredients Market Driver: Growth in Processed and Convenience Foods
The key driver of the Food Taste Ingredients Market is the growth in processed and convenience foods. As busy lifestyles lead to higher consumption of ready-to-eat and easy-to-prepare food products, there is a corresponding increase in the need for taste ingredients that improve the flavor and appeal of these foods. Taste ingredients play a crucial role in making processed foods more palatable and enjoyable, driving their demand in the food industry.
Food Taste Ingredients Market Opportunity: Development of Functional Taste Ingredients
A significant opportunity in the Food Taste Ingredients Market lies in the development of functional taste ingredients. By creating ingredients that offer both taste and health benefits, such as natural sweeteners, flavor enhancers with added nutrients, and taste modulators that reduce unhealthy components, companies can cater to the growing demand for functional foods. This approach can help manufacturers attract health-conscious consumers and differentiate their products in the competitive market.
Food Taste Ingredients Market Share Analysis: Monosodium Glutamate (MSG) is the fastest growing segment over the forecast period to 2032
Monosodium Glutamate (MSG) stands out as a rapidly growing segment in the Food Taste Ingredients market. MSG, known for its ability to enhance savory flavors, is widely used across various food applications globally. It is a flavor enhancer that boosts the umami taste, making food more palatable without overshadowing other flavors. The demand for MSG is driven by its effectiveness in improving taste perception in processed foods, snacks, soups, sauces, and ready-to-eat meals. As consumer preferences shift towards convenient and flavorful food options, manufacturers increasingly rely on MSG to enhance the overall taste experience of their products. Further, MSG is valued for its cost-effectiveness and ability to improve shelf stability, which are crucial factors for food manufacturers aiming to meet market demands efficiently. The growth in MSG usage is also supported by technological advancements in flavor extraction and formulation, ensuring consistent quality and taste across diverse food products. As the food industry continues to innovate and respond to evolving consumer preferences, the demand for MSG is expected to rise, driving growth in the Food Taste Ingredients market.
Food Taste Ingredients Market Share Analysis: Home Cooking is the fastest growing segment over the forecast period to 2032
The Home Cooking segment is experiencing significant growth in the Food Taste Ingredients market as more consumers opt to cook at home. This trend has been accelerated by various factors, including increased awareness of health and wellness, economic fluctuations influencing dining-out habits, and the rise of culinary interest among home cooks. As people spend more time cooking meals at home, there is a growing demand for high-quality taste ingredients that can replicate restaurant-like flavors or enhance homemade dishes. Ingredients such as Monosodium Glutamate (MSG), yeast extracts, and hydrolyzed vegetable proteins (HVP) are particularly sought after for their ability to intensify flavors and improve the overall taste profile of home-cooked meals. Manufacturers are responding to this demand by offering convenient and versatile taste enhancers that cater to diverse culinary preferences and dietary needs. The Home Cooking segment's growth is also supported by the proliferation of cooking shows, social media influencers sharing recipes, and online platforms offering culinary inspiration, all contributing to an increased interest in experimenting with flavors and enhancing home-cooked dishes. As this trend continues, the Food Taste Ingredients market is poised for continued expansion in the Home Cooking segment, driven by consumer preferences for flavorful, nutritious, and enjoyable homemade meals.
Food Taste Ingredients Market Segmentation
By Type
Monosodium Glutamate (MSG)
Hydrolyzed Vegetable Protein (HVP)
Yeast Extract
Others
By Application
Food Processing Industry
Restaurants
Home Cooking
Countries Analyzed
North America (US, Canada, Mexico)
Europe (Germany, UK, France, Spain, Italy, Russia, Rest of Europe)
Asia Pacific (China, India, Japan, South Korea, Australia, South East Asia, Rest of Asia)
South America (Brazil, Argentina, Rest of South America)
Middle East and Africa (Saudi Arabia, UAE, Rest of Middle East, South Africa, Egypt, Rest of Africa)
Food Taste Ingredients Companies Profiled in the Study
ABF Group
AIPU Food Industry
Ajinomoto Group
Angel Yeast
Biospringer
Eppen
Fufeng
Innova
Koninklijke DSM N.V.
Meihua
*- List Not Exhaustive
Chapter 1. TABLE OF CONTENTS
Chapter 2. Introduction to Food Taste Ingredients Market
2.1. Market Overview
2.2. Key Statistics and Report Highlights
2.3. Scope of the Comprehensive Study
2.3.1. Market Definition
2.3.2 Countries and Regions Covered
2.3.3 Research Objective
2.3.4 Units, Currency, and Conversions
2.3.5 Industry Value Chain
2.4. Key Market Segments
2.5. Key Companies
2.6. Study Period
Chapter 3. Strategic Analysis Review
3.1. Food Taste Ingredients Pricing Analysis and Forecast
3.2. Porter’s Five Forces
3.3. Market Ecosystem
3.4. SWOT Analysis
3.5. Regulatory Scenario
3.3. Effects of Inflation, Russia-Ukraine War, moderating economic growth, and other macroeconomic factors
Chapter 4. Competitive Landscape
4.1. Market Share Analysis
4.1.1. Global Food Taste Ingredients Market Share by Company, 2023
4.1.2. Product Offerings of Leading Food Taste Ingredients Companies
4.2. Market Entropy
4.2.1. New Product Launches in the Industry
4.2.2. Mergers, Acquisitions, Joint ventures, and Partnerships
4.3. Key Strategies and Best Practices
Chapter 5. Global Market Projections: Best, Reference, and Low Case Scenarios
5.1. Growth Analysis- Case Scenario Definitions
5.2. Low Growth Case Scenario Forecasts
5.3. Reference Growth Case Scenario Forecasts
5.4. High Growth Case Scenario Forecasts
Chapter 6. Market Dynamics
6.1. Food Taste Ingredients Market Drivers
6.2. Food Taste Ingredients Market Challenges
6.6. Food Taste Ingredients Market Opportunities
6.4. Food Taste Ingredients Market Trends
Chapter 7. Global Food Taste Ingredients Market Outlook Trends
7.1. Global Food Taste Ingredients Revenue (USD Million) and CAGR (%) by Type (2021-2032)
7.2. Global Food Taste Ingredients Revenue (USD Million) and CAGR (%) by Application (2021-2032)
7.3. Global Food Taste Ingredients Revenue (USD Million) and CAGR (%) by Product (2021-2032)
By Type
Monosodium Glutamate (MSG)
Hydrolyzed Vegetable Protein (HVP)
Yeast Extract
Others
By Application
Food Processing Industry
Restaurants
Home Cooking
Chapter 8. Global Food Taste Ingredients Regional Analysis and Outlook
8.1. Global Food Taste Ingredients Revenue (USD Million) By Regions (2021- 2032)
8.2. North America Food Taste Ingredients Revenue (USD Million) by Country (2021-2032)
8.2.1. United States Food Taste Ingredients Regional Analysis and Outlook
8.2.2. Canada Food Taste Ingredients Regional Analysis and Outlook
8.2.3. Mexico Food Taste Ingredients Regional Analysis and Outlook
8.3. Europe Food Taste Ingredients Revenue (USD Million), by Country (2021-2032)
8.3.1. Germany Food Taste Ingredients Regional Analysis and Outlook
8.3.2. France Food Taste Ingredients Regional Analysis and Outlook
8.3.3. United Kingdom Food Taste Ingredients Regional Analysis and Outlook
8.3.4. Spain Food Taste Ingredients Regional Analysis and Outlook
8.3.5. Italy Food Taste Ingredients Regional Analysis and Outlook
8.3.6. Russia Food Taste Ingredients Regional Analysis and Outlook
8.3.7. Rest of Europe Food Taste Ingredients Regional Analysis and Outlook
8.4. Asia Pacific Food Taste Ingredients Revenue (USD Million) by Country (2021-2032)
8.4.1. China Food Taste Ingredients Regional Analysis and Outlook
8.4.2. Japan Food Taste Ingredients Regional Analysis and Outlook
8.4.3. India Food Taste Ingredients Regional Analysis and Outlook
8.4.4. South Korea Food Taste Ingredients Regional Analysis and Outlook
8.4.5. Australia Food Taste Ingredients Regional Analysis and Outlook
8.4.6. South East Asia Food Taste Ingredients Regional Analysis and Outlook
8.4.7. Rest of Asia Pacific Food Taste Ingredients Regional Analysis and Outlook
8.5. South America Food Taste Ingredients Revenue (USD Million), by Country (2021-2032)
8.5.1. Brazil Food Taste Ingredients Regional Analysis and Outlook
8.5.2. Argentina Food Taste Ingredients Regional Analysis and Outlook
8.5.3. Rest of South America Food Taste Ingredients Regional Analysis and Outlook
8.6. Middle East and Africa Food Taste Ingredients Revenue (USD Million) by Country (2021-2032)
8.6.1. Middle East Food Taste Ingredients Regional Analysis and Outlook
8.6.2. Africa Food Taste Ingredients Regional Analysis and Outlook
Chapter 9. North America Food Taste Ingredients Analysis and Outlook
9.1. North America Food Taste Ingredients Revenue (USD Million) by Segments (2021-2032)
9.1.1. North America Food Taste Ingredients Revenue (USD Million) by Type (2021-2032)
9.1.2. North America Food Taste Ingredients Revenue (USD Million) by Application (2021-2032)
9.1.3. North America Food Taste Ingredients Revenue (USD Million) by Product (2021-2032)
By Type
Monosodium Glutamate (MSG)
Hydrolyzed Vegetable Protein (HVP)
Yeast Extract
Others
By Application
Food Processing Industry
Restaurants
Home Cooking
Chapter 10. Europe Food Taste Ingredients Analysis and Outlook
10.1. Europe Food Taste Ingredients Revenue (USD Million), by Segments (USD Million) (2021-2032)
10.1.1. Europe Food Taste Ingredients Revenue (USD Million) by Type (2021-2032)
10.1.2. Europe Food Taste Ingredients Revenue (USD Million) by Application (2021-2032)
10.1.3. Europe Food Taste Ingredients Revenue (USD Million) by Product (2021-2032)
By Type
Monosodium Glutamate (MSG)
Hydrolyzed Vegetable Protein (HVP)
Yeast Extract
Others
By Application
Food Processing Industry
Restaurants
Home Cooking
Chapter 11. Asia Pacific Food Taste Ingredients Analysis and Outlook
11.1. Asia Pacific Food Taste Ingredients Revenue (USD Million), and Revenue (USD Million) by Segments (2021-2032)
11.1.1. Asia Pacific Food Taste Ingredients Revenue (USD Million) by Type (2021-2032)
11.1.2. Asia Pacific Food Taste Ingredients Revenue (USD Million) by Application (2021-2032)
11.1.3. Asia Pacific Food Taste Ingredients Revenue (USD Million) by Product (2021-2032)
By Type
Monosodium Glutamate (MSG)
Hydrolyzed Vegetable Protein (HVP)
Yeast Extract
Others
By Application
Food Processing Industry
Restaurants
Home Cooking
Chapter 12. South America Food Taste Ingredients Analysis and Outlook
12.1. South America Food Taste Ingredients Revenue (USD Million), by Segments (2021-2032)
12.1.1. South America Food Taste Ingredients Revenue (USD Million) by Type (2021-2032)
12.1.2. South America Food Taste Ingredients Revenue (USD Million) by Application (2021-2032)
12.1.3. South America Food Taste Ingredients Revenue (USD Million) by Product (2021-2032)
By Type
Monosodium Glutamate (MSG)
Hydrolyzed Vegetable Protein (HVP)
Yeast Extract
Others
By Application
Food Processing Industry
Restaurants
Home Cooking
Chapter 13. Middle East and Africa Food Taste Ingredients Analysis and Outlook
13.1. Middle East and Africa Food Taste Ingredients Revenue (USD Million), by Segments (2021-2032)
13.1.1. Middle East and Africa Food Taste Ingredients Revenue (USD Million) by Type (2021-2032)
13.1.2. Middle East and Africa Food Taste Ingredients Revenue (USD Million) by Application (2021-2032)
13.1.3. Middle East and Africa Food Taste Ingredients Revenue (USD Million) by Product (2021-2032)
By Type
Monosodium Glutamate (MSG)
Hydrolyzed Vegetable Protein (HVP)
Yeast Extract
Others
By Application
Food Processing Industry
Restaurants
Home Cooking
Chapter 14. Food Taste Ingredients Company Profiles
14.1 Business Overview
14.2 Product Profiles
14.3 SWOT Profiles
14.5 Recent Developments
14.6 Financial Profile
List of Companies
ABF Group
AIPU Food Industry
Ajinomoto Group
Angel Yeast
Biospringer
Eppen
Fufeng
Innova
Koninklijke DSM N.V.
Meihua
15. Methodology and Data Sources
15.1 Customization Offerings
15.2 Subscription Services
15.3 Related Reports
15.4 Publisher Expertise
LIST OF TABLES
Table 1 Market Segmentation Analysis
Table 2 Global Food Taste Ingredients Market Share of Leading Companies, 2023
Table 3 Product Offerings of Leading Companies
Table 4 Low Growth Scenario Forecasts
Table 5 Reference Case Growth Scenario
Table 6 High Growth Case Scenario
Table 7 Global Food Taste Ingredients Revenue (USD Million) And CAGR (%) By Type (2021-2032)
Table 8 Global Food Taste Ingredients Revenue (USD Million) And CAGR (%) By Application (2021-2032)
Table 9 Global Food Taste Ingredients Revenue (USD Million) And CAGR (%) By Product (2021-2032)
Table 10 Global Food Taste Ingredients Market Revenue (USD Million) By Regions (2021-2032)
Table 11 Global Food Taste Ingredients Market Share (%) By Regions (2021-2032)
Table 12 North America Food Taste Ingredients Revenue (USD Million) By Country (2021-2032)
Table 13 Europe Food Taste Ingredients Revenue (USD Million) By Country (2021-2032)
Table 14 Asia Pacific Food Taste Ingredients Revenue (USD Million) By Country (2021-2032)
Table 15 South America Food Taste Ingredients Revenue (USD Million) By Country (2021-2032)
Table 16 Middle East and Africa Food Taste Ingredients Revenue (USD Million) By Region (2021-2032)
Table 17 North America Food Taste Ingredients Revenue (USD Million) By Type (2021-2032)
Table 18 North America Food Taste Ingredients Revenue (USD Million) By Application (2021-2032)
Table 19 North America Food Taste Ingredients Revenue (USD Million) By Product (2021-2032)
Table 20 Europe Food Taste Ingredients Revenue (USD Million) By Type (2021-2032)
Table 21 Europe Food Taste Ingredients Revenue (USD Million) By Application (2021-2032)
Table 22 Europe Food Taste Ingredients Revenue (USD Million) By Product (2021-2032)
Table 23 Asia Pacific Food Taste Ingredients Revenue (USD Million) By Type (2021-2032)
Table 24 Asia Pacific Food Taste Ingredients Revenue (USD Million) By Application (2021-2032)
Table 25 Asia Pacific Food Taste Ingredients Revenue (USD Million) By Product (2021-2032)
Table 26 South America Food Taste Ingredients Revenue (USD Million) By Type (2021-2032)
Table 27 South America Food Taste Ingredients Revenue (USD Million) By Application (2021-2032)
Table 28 South America Food Taste Ingredients Revenue (USD Million) By Product (2021-2032)
Table 29 Middle East and Africa Food Taste Ingredients Revenue (USD Million) By Type (2021-2032)
Table 30 Middle East and Africa Food Taste Ingredients Revenue (USD Million) By Application (2021-2032)
Table 31 Middle East and Africa Food Taste Ingredients Revenue (USD Million) By Product (2021-2032)
LIST OF FIGURES
Figure 1. Market Scope
Figure 2. Pricing Forecasts Per Unit, 2023- 2032
Figure 3. Porter’s Five Forces
Figure 4. Global Food Taste Ingredients Market Revenue (USD Million) By Regions (2021-2032)
Figure 5. Global Food Taste Ingredients Market Share (%) By Regions (2023)
Figure 6. North America Food Taste Ingredients Revenue (USD Million) By Country (2021-2032)
Figure 7. United States Food Taste Ingredients Revenue (USD Million) By Country (2021-2032)
Figure 8. Canada Food Taste Ingredients Revenue (USD Million) By Country (2021-2032)
Figure 9. Mexico Food Taste Ingredients Revenue (USD Million) By Country (2021-2032)
Figure 10. Europe Food Taste Ingredients Revenue (USD Million) By Country (2021-2032)
Figure 11. Germany Food Taste Ingredients Revenue (USD Million) By Country (2021-2032)
Figure 12. France Food Taste Ingredients Revenue (USD Million) By Country (2021-2032)
Figure 13. United Kingdom Food Taste Ingredients Revenue (USD Million) By Country (2021-2032)
Figure 14. Spain Food Taste Ingredients Revenue (USD Million) By Country (2021-2032)
Figure 15. Italy Food Taste Ingredients Revenue (USD Million) By Country (2021-2032)
Figure 16. Russia Food Taste Ingredients Revenue (USD Million) By Country (2021-2032)
Figure 17. Rest of Europe Food Taste Ingredients Revenue (USD Million) By Country (2021-2032)
Figure 11. Asia Pacific Food Taste Ingredients Revenue (USD Million) By Country (2021-2032)
Figure 12. China Food Taste Ingredients Revenue (USD Million) By Country (2021-2032)
Figure 13. Japan Food Taste Ingredients Revenue (USD Million) By Country (2021-2032)
Figure 14. India Food Taste Ingredients Revenue (USD Million) By Country (2021-2032)
Figure 15. South Korea Food Taste Ingredients Revenue (USD Million) By Country (2021-2032)
Figure 16. Australia Food Taste Ingredients Revenue (USD Million) By Country (2021-2032)
Figure 17. South East Asia Food Taste Ingredients Revenue (USD Million) By Country (2021-2032)
Figure 18. South America Food Taste Ingredients Revenue (USD Million) By Country (2021-2032)
Figure 19. Brazil Food Taste Ingredients Revenue (USD Million) By Country (2021-2032)
Figure 20. Argentina Food Taste Ingredients Revenue (USD Million) By Country (2021-2032)
Figure 21. Rest of Asia Pacific Food Taste Ingredients Revenue (USD Million) By Country (2021-2032)
Figure 22. Middle East and Africa Food Taste Ingredients Revenue (USD Million) By Region (2021-2032)
Figure 23. Saudi Arabia Food Taste Ingredients Revenue (USD Million) By Region (2021-2032)
Figure 24. The UAE Food Taste Ingredients Revenue (USD Million) By Region (2021-2032)
Figure 25. Rest of Middle East Food Taste Ingredients Revenue (USD Million) By Region (2021-2032)
Figure 26. South Africa Food Taste Ingredients Revenue (USD Million) By Region (2021-2032)
Figure 27. Africa Food Taste Ingredients Revenue (USD Million) By Region (2021-2032)
Figure 28. North America Food Taste Ingredients Revenue (USD Million) By Type (2021-2032)
Figure 29. North America Food Taste Ingredients Revenue (USD Million) By Application (2021-2032)
Figure 30. North America Food Taste Ingredients Revenue (USD Million) By Product (2021-2032)
Figure 31. Europe Food Taste Ingredients Revenue (USD Million) By Type (2021-2032)
Figure 32. Europe Food Taste Ingredients Revenue (USD Million) By Application (2021-2032)
Figure 33. Europe Food Taste Ingredients Revenue (USD Million) By Product (2021-2032)
Figure 34. Asia Pacific Food Taste Ingredients Revenue (USD Million) By Type (2021-2032)
Figure 35. Asia Pacific Food Taste Ingredients Revenue (USD Million) By Application (2021-2032)
Figure 36. Asia Pacific Food Taste Ingredients Revenue (USD Million) By Product (2021-2032)
Figure 37. South America Food Taste Ingredients Revenue (USD Million) By Type (2021-2032)
Figure 38. South America Food Taste Ingredients Revenue (USD Million) By Application (2021-2032)
Figure 39. South America Food Taste Ingredients Revenue (USD Million) By Product (2021-2032)
Figure 40. Middle East and Africa Food Taste Ingredients Revenue (USD Million) By Type (2021-2032)
Figure 41. Middle East and Africa Food Taste Ingredients Revenue (USD Million) By Application (2021-2032)
Figure 42. Middle East and Africa Food Taste Ingredients Revenue (USD Million) By Product (2021-2032)
By Type
Monosodium Glutamate (MSG)
Hydrolyzed Vegetable Protein (HVP)
Yeast Extract
Others
By Application
Food Processing Industry
Restaurants
Home Cooking
Countries Analyzed
North America (US, Canada, Mexico)
Europe (Germany, UK, France, Spain, Italy, Russia, Rest of Europe)
Asia Pacific (China, India, Japan, South Korea, Australia, South East Asia, Rest of Asia)
South America (Brazil, Argentina, Rest of South America)
Middle East and Africa (Saudi Arabia, UAE, Rest of Middle East, South Africa, Egypt, Rest of Africa)
