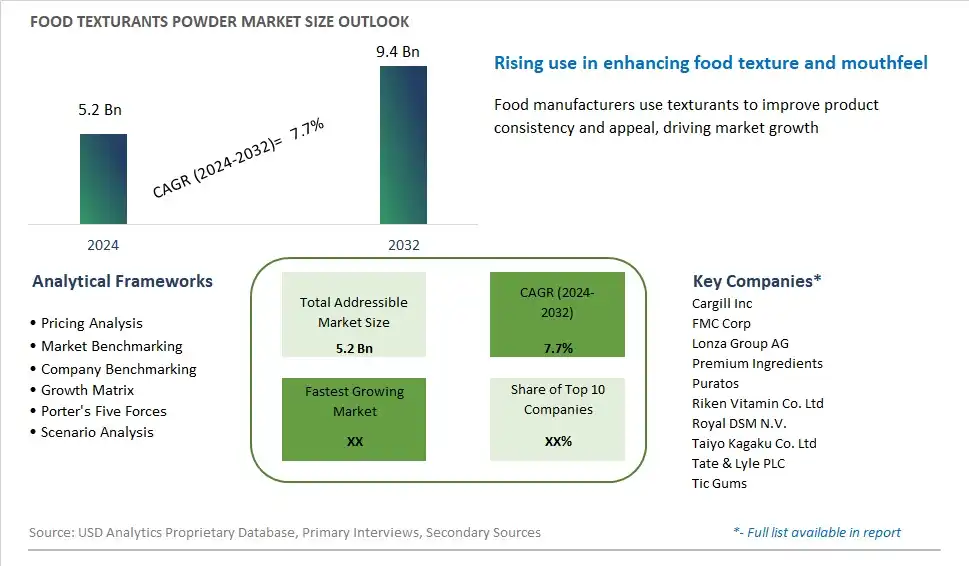
Global Food Texturants Powder Market Size is valued at $5.2 Billion in 2024 and is forecast to register a growth rate (CAGR) of 7.7% to reach $9.4 Billion by 2032.
The global Food Texturants Powder Market Comprehensive Study analyzes and forecasts the market size across 6 regions and 24 countries for diverse segments -By Type (Hydrocolloids, Emulsifiers, Stabilizers), By Source (Bakery and Confectionery, Dairy Products, Meat and Seafood, Beverages), By Application (Natural, Synthetic)
An Introduction to Food Texturants Powder Market
In 2024, the food texturants powder market is experiencing significant growth, driven by the rising demand for processed foods with appealing textures. Food texturants, which include ingredients such as starches, gums, and proteins, are used to modify and enhance the texture, stability, and mouthfeel of food products. The market benefits from the increasing production of convenience foods, dairy products, and plant-based alternatives, where texturants are essential for product quality. Advances in texturant technology have led to the development of innovative solutions that cater to the trend towards natural and clean-label ingredients. Additionally, the growing focus on health and wellness has spurred interest in texturants derived from natural sources, such as seaweed and legumes. As food manufacturers continue to innovate and meet consumer preferences, the market for food texturants powder is set to expand significantly.
Food Texturants Powder Competitive Landscape
The market report analyses the leading companies in the industry including Cargill Inc, FMC Corp, Lonza Group AG, Premium Ingredients, Puratos, Riken Vitamin Co. Ltd, Royal DSM N.V., Taiyo Kagaku Co. Ltd, Tate & Lyle PLC, Tic Gums, and Others.
Food Texturants Powder Market Dynamics
Food Texturants Powder Market Trend: Demand for Clean Label and Natural Ingredients
A prominent trend in the food texturants powder market is the increasing demand for clean label and natural ingredients. With growing consumer awareness of food additives and their potential health implications, there's a shift towards cleaner, more transparent ingredient lists in food products. This trend is driven by consumer preferences for wholesome, minimally processed foods that are free from artificial additives, preservatives, and synthetic ingredients. As a result, there's a rising demand for food texturants powders derived from natural sources such as plant-based gums, starches, and fibers that offer texture modification and stability without compromising on product quality or safety. Manufacturers are responding to this trend by reformulating their products to incorporate natural texturants and by promoting the use of clean label ingredients to meet consumer expectations for healthier, more transparent food choices.
Market Driver: Growth in Processed Food Industry and Functional Foods Segment
An essential driver fueling the food texturants powder market is the growth in the processed food industry and functional foods segment. With changing consumer lifestyles, urbanization, and increasing demand for convenience, there's a rising consumption of processed and functional food products worldwide. This driver is reinforced by factors such as busy lifestyles, on-the-go consumption habits, and the desire for nutritionally enhanced foods that offer added health benefits. Food texturants powders play a crucial role in the formulation of processed and functional foods by improving texture, mouthfeel, and stability, thereby enhancing the overall sensory experience and nutritional profile of the products. As the processed food industry continues to expand globally, driven by factors such as urbanization, rising disposable incomes, and changing dietary preferences, the demand for food texturants powders is expected to grow, presenting opportunities for manufacturers to innovate and develop new texturizing solutions to meet the evolving needs of food producers and consumers.
Market Opportunity: Development of Clean Label and Functional Texturants
A significant opportunity within the food texturants powder market lies in the development of clean label and functional texturants. With the increasing demand for clean label ingredients and functional food products, there's a growing need for texturants powders that not only provide texture enhancement and stability but also offer additional health benefits and nutritional value. This opportunity encompasses the development of texturants derived from natural sources such as fruits, vegetables, grains, and legumes, as well as the incorporation of functional ingredients such as dietary fibers, protein isolates, and antioxidants that contribute to the overall healthfulness of the products. By focusing on clean label formulations and functional attributes, manufacturers can differentiate their texturants powders in the market, meet consumer demand for healthier food options, and capitalize on opportunities to partner with food producers in developing innovative, value-added products that resonate with today's health-conscious consumers.
Food Texturants Powder Market Share Analysis: Hydrocolloids held the dominant market share in 2024
Within the Food Texturants Powder Market, the Hydrocolloids segment stands out as the largest due to its versatile functionality and widespread application across various food products. Hydrocolloids, such as agar, carrageenan, and xanthan gum, play a crucial role in modifying and enhancing the texture, stability, and sensory attributes of food formulations. They are extensively used in a diverse range of food products, including dairy, bakery, confectionery, and sauces, to impart desirable textures, improve mouthfeel, and extend shelf life. Further, the growing consumer demand for clean label and plant-based ingredients has further boosted the popularity of hydrocolloids, as they are often derived from natural sources and are perceived as more wholesome alternatives to synthetic additives. As food manufacturers continue to innovate and develop products that meet evolving consumer preferences for texture and quality, the hydrocolloids segment is poised to maintain its dominance in the food texturants powder market.
Food Texturants Powder Market Share Analysis: Beverages market is poised to register the fastest growth rae over the forecast period to 2032
In the Food Texturants Powder Market, the Beverages segment is the fastest growing due to shifting consumer preferences towards functional and indulgent beverages. With the rising demand for innovative and premium beverage options, food manufacturers are increasingly incorporating texturants powders to enhance the mouthfeel, stability, and overall sensory experience of beverages. Whether in traditional categories like juices and soft drinks or emerging segments such as plant-based and functional beverages, texturants play a pivotal role in creating desired textures and suspending ingredients like proteins and fibers. Further, as consumers seek healthier alternatives to sugary drinks, texturants enable the development of low-sugar and reduced-calorie beverage formulations without compromising on taste or texture. With the beverage market witnessing continuous innovation and diversification, the Beverages segment is expected to experience rapid growth in the food texturants powder market.
Food Texturants Powder Market Share Analysis: Natural held the dominant market share in 2024
Within the Food Texturants Powder Market, the Natural segment reigns supreme as the largest, driven by increasing consumer demand for clean label and minimally processed food products. Natural texturants powders, derived from plant-based sources like starches, gums, and pectin, resonate with health-conscious consumers seeking wholesome and transparent ingredient lists. As awareness grows regarding the potential health risks associated with synthetic additives, food manufacturers are under pressure to reformulate products with natural alternatives. Additionally, natural texturants offer functional properties similar to their synthetic counterparts, such as emulsification, thickening, and stabilizing, while also aligning with sustainability and ethical sourcing initiatives. The Natural segment's dominance reflects a broader industry shift towards cleaner, more sustainable ingredient solutions, positioning it as the cornerstone of growth in the food texturants powder market.
Food Texturants Powder Market Segmentation
By Type
Hydrocolloids
Emulsifiers
Stabilizers
By Source
Bakery and Confectionery
Dairy Products
Meat and Seafood
Beverages
By Application
Natural
Synthetic
Countries Analyzed
North America (US, Canada, Mexico)
Europe (Germany, UK, France, Spain, Italy, Russia, Rest of Europe)
Asia Pacific (China, India, Japan, South Korea, Australia, South East Asia, Rest of Asia)
South America (Brazil, Argentina, Rest of South America)
Middle East and Africa (Saudi Arabia, UAE, Rest of Middle East, South Africa, Egypt, Rest of Africa)
Food Texturants Powder Companies Profiled in the Study
Cargill Inc
FMC Corp
Lonza Group AG
Premium Ingredients
Puratos
Riken Vitamin Co. Ltd
Royal DSM N.V.
Taiyo Kagaku Co. Ltd
Tate & Lyle PLC
Tic Gums
*- List Not Exhaustive
Chapter 1. TABLE OF CONTENTS
Chapter 2. Introduction to Food Texturants Powder Market
2.1. Market Overview
2.2. Key Statistics and Report Highlights
2.3. Scope of the Comprehensive Study
2.3.1. Market Definition
2.3.2 Countries and Regions Covered
2.3.3 Research Objective
2.3.4 Units, Currency, and Conversions
2.3.5 Industry Value Chain
2.4. Key Market Segments
2.5. Key Companies
2.6. Study Period
Chapter 3. Strategic Analysis Review
3.1. Food Texturants Powder Pricing Analysis and Forecast
3.2. Porter’s Five Forces
3.3. Market Ecosystem
3.4. SWOT Analysis
3.5. Regulatory Scenario
3.3. Effects of Inflation, Russia-Ukraine War, moderating economic growth, and other macroeconomic factors
Chapter 4. Competitive Landscape
4.1. Market Share Analysis
4.1.1. Global Food Texturants Powder Market Share by Company, 2023
4.1.2. Product Offerings of Leading Food Texturants Powder Companies
4.2. Market Entropy
4.2.1. New Product Launches in the Industry
4.2.2. Mergers, Acquisitions, Joint ventures, and Partnerships
4.3. Key Strategies and Best Practices
Chapter 5. Global Market Projections: Best, Reference, and Low Case Scenarios
5.1. Growth Analysis- Case Scenario Definitions
5.2. Low Growth Case Scenario Forecasts
5.3. Reference Growth Case Scenario Forecasts
5.4. High Growth Case Scenario Forecasts
Chapter 6. Market Dynamics
6.1. Food Texturants Powder Market Drivers
6.2. Food Texturants Powder Market Challenges
6.6. Food Texturants Powder Market Opportunities
6.4. Food Texturants Powder Market Trends
Chapter 7. Global Food Texturants Powder Market Outlook Trends
7.1. Global Food Texturants Powder Revenue (USD Million) and CAGR (%) by Type (2021-2032)
7.2. Global Food Texturants Powder Revenue (USD Million) and CAGR (%) by Application (2021-2032)
7.3. Global Food Texturants Powder Revenue (USD Million) and CAGR (%) by Product (2021-2032)
By Type
Hydrocolloids
Emulsifiers
Stabilizers
By Source
Bakery and Confectionery
Dairy Products
Meat and Seafood
Beverages
By Application
Natural
Synthetic
Chapter 8. Global Food Texturants Powder Regional Analysis and Outlook
8.1. Global Food Texturants Powder Revenue (USD Million) By Regions (2021- 2032)
8.2. North America Food Texturants Powder Revenue (USD Million) by Country (2021-2032)
8.2.1. United States Food Texturants Powder Regional Analysis and Outlook
8.2.2. Canada Food Texturants Powder Regional Analysis and Outlook
8.2.3. Mexico Food Texturants Powder Regional Analysis and Outlook
8.3. Europe Food Texturants Powder Revenue (USD Million), by Country (2021-2032)
8.3.1. Germany Food Texturants Powder Regional Analysis and Outlook
8.3.2. France Food Texturants Powder Regional Analysis and Outlook
8.3.3. United Kingdom Food Texturants Powder Regional Analysis and Outlook
8.3.4. Spain Food Texturants Powder Regional Analysis and Outlook
8.3.5. Italy Food Texturants Powder Regional Analysis and Outlook
8.3.6. Russia Food Texturants Powder Regional Analysis and Outlook
8.3.7. Rest of Europe Food Texturants Powder Regional Analysis and Outlook
8.4. Asia Pacific Food Texturants Powder Revenue (USD Million) by Country (2021-2032)
8.4.1. China Food Texturants Powder Regional Analysis and Outlook
8.4.2. Japan Food Texturants Powder Regional Analysis and Outlook
8.4.3. India Food Texturants Powder Regional Analysis and Outlook
8.4.4. South Korea Food Texturants Powder Regional Analysis and Outlook
8.4.5. Australia Food Texturants Powder Regional Analysis and Outlook
8.4.6. South East Asia Food Texturants Powder Regional Analysis and Outlook
8.4.7. Rest of Asia Pacific Food Texturants Powder Regional Analysis and Outlook
8.5. South America Food Texturants Powder Revenue (USD Million), by Country (2021-2032)
8.5.1. Brazil Food Texturants Powder Regional Analysis and Outlook
8.5.2. Argentina Food Texturants Powder Regional Analysis and Outlook
8.5.3. Rest of South America Food Texturants Powder Regional Analysis and Outlook
8.6. Middle East and Africa Food Texturants Powder Revenue (USD Million) by Country (2021-2032)
8.6.1. Middle East Food Texturants Powder Regional Analysis and Outlook
8.6.2. Africa Food Texturants Powder Regional Analysis and Outlook
Chapter 9. North America Food Texturants Powder Analysis and Outlook
9.1. North America Food Texturants Powder Revenue (USD Million) by Segments (2021-2032)
9.1.1. North America Food Texturants Powder Revenue (USD Million) by Type (2021-2032)
9.1.2. North America Food Texturants Powder Revenue (USD Million) by Application (2021-2032)
9.1.3. North America Food Texturants Powder Revenue (USD Million) by Product (2021-2032)
By Type
Hydrocolloids
Emulsifiers
Stabilizers
By Source
Bakery and Confectionery
Dairy Products
Meat and Seafood
Beverages
By Application
Natural
Synthetic
Chapter 10. Europe Food Texturants Powder Analysis and Outlook
10.1. Europe Food Texturants Powder Revenue (USD Million), by Segments (USD Million) (2021-2032)
10.1.1. Europe Food Texturants Powder Revenue (USD Million) by Type (2021-2032)
10.1.2. Europe Food Texturants Powder Revenue (USD Million) by Application (2021-2032)
10.1.3. Europe Food Texturants Powder Revenue (USD Million) by Product (2021-2032)
By Type
Hydrocolloids
Emulsifiers
Stabilizers
By Source
Bakery and Confectionery
Dairy Products
Meat and Seafood
Beverages
By Application
Natural
Synthetic
Chapter 11. Asia Pacific Food Texturants Powder Analysis and Outlook
11.1. Asia Pacific Food Texturants Powder Revenue (USD Million), and Revenue (USD Million) by Segments (2021-2032)
11.1.1. Asia Pacific Food Texturants Powder Revenue (USD Million) by Type (2021-2032)
11.1.2. Asia Pacific Food Texturants Powder Revenue (USD Million) by Application (2021-2032)
11.1.3. Asia Pacific Food Texturants Powder Revenue (USD Million) by Product (2021-2032)
By Type
Hydrocolloids
Emulsifiers
Stabilizers
By Source
Bakery and Confectionery
Dairy Products
Meat and Seafood
Beverages
By Application
Natural
Synthetic
Chapter 12. South America Food Texturants Powder Analysis and Outlook
12.1. South America Food Texturants Powder Revenue (USD Million), by Segments (2021-2032)
12.1.1. South America Food Texturants Powder Revenue (USD Million) by Type (2021-2032)
12.1.2. South America Food Texturants Powder Revenue (USD Million) by Application (2021-2032)
12.1.3. South America Food Texturants Powder Revenue (USD Million) by Product (2021-2032)
By Type
Hydrocolloids
Emulsifiers
Stabilizers
By Source
Bakery and Confectionery
Dairy Products
Meat and Seafood
Beverages
By Application
Natural
Synthetic
Chapter 13. Middle East and Africa Food Texturants Powder Analysis and Outlook
13.1. Middle East and Africa Food Texturants Powder Revenue (USD Million), by Segments (2021-2032)
13.1.1. Middle East and Africa Food Texturants Powder Revenue (USD Million) by Type (2021-2032)
13.1.2. Middle East and Africa Food Texturants Powder Revenue (USD Million) by Application (2021-2032)
13.1.3. Middle East and Africa Food Texturants Powder Revenue (USD Million) by Product (2021-2032)
By Type
Hydrocolloids
Emulsifiers
Stabilizers
By Source
Bakery and Confectionery
Dairy Products
Meat and Seafood
Beverages
By Application
Natural
Synthetic
Chapter 14. Food Texturants Powder Company Profiles
14.1 Business Overview
14.2 Product Profiles
14.3 SWOT Profiles
14.5 Recent Developments
14.6 Financial Profile
List of Companies
Cargill Inc
FMC Corp
Lonza Group AG
Premium Ingredients
Puratos
Riken Vitamin Co. Ltd
Royal DSM N.V.
Taiyo Kagaku Co. Ltd
Tate & Lyle PLC
Tic Gums
15. Methodology and Data Sources
15.1 Customization Offerings
15.2 Subscription Services
15.3 Related Reports
15.4 Publisher Expertise
LIST OF TABLES
Table 1 Market Segmentation Analysis
Table 2 Global Food Texturants Powder Market Share of Leading Companies, 2023
Table 3 Product Offerings of Leading Companies
Table 4 Low Growth Scenario Forecasts
Table 5 Reference Case Growth Scenario
Table 6 High Growth Case Scenario
Table 7 Global Food Texturants Powder Revenue (USD Million) And CAGR (%) By Type (2021-2032)
Table 8 Global Food Texturants Powder Revenue (USD Million) And CAGR (%) By Application (2021-2032)
Table 9 Global Food Texturants Powder Revenue (USD Million) And CAGR (%) By Product (2021-2032)
Table 10 Global Food Texturants Powder Market Revenue (USD Million) By Regions (2021-2032)
Table 11 Global Food Texturants Powder Market Share (%) By Regions (2021-2032)
Table 12 North America Food Texturants Powder Revenue (USD Million) By Country (2021-2032)
Table 13 Europe Food Texturants Powder Revenue (USD Million) By Country (2021-2032)
Table 14 Asia Pacific Food Texturants Powder Revenue (USD Million) By Country (2021-2032)
Table 15 South America Food Texturants Powder Revenue (USD Million) By Country (2021-2032)
Table 16 Middle East and Africa Food Texturants Powder Revenue (USD Million) By Region (2021-2032)
Table 17 North America Food Texturants Powder Revenue (USD Million) By Type (2021-2032)
Table 18 North America Food Texturants Powder Revenue (USD Million) By Application (2021-2032)
Table 19 North America Food Texturants Powder Revenue (USD Million) By Product (2021-2032)
Table 20 Europe Food Texturants Powder Revenue (USD Million) By Type (2021-2032)
Table 21 Europe Food Texturants Powder Revenue (USD Million) By Application (2021-2032)
Table 22 Europe Food Texturants Powder Revenue (USD Million) By Product (2021-2032)
Table 23 Asia Pacific Food Texturants Powder Revenue (USD Million) By Type (2021-2032)
Table 24 Asia Pacific Food Texturants Powder Revenue (USD Million) By Application (2021-2032)
Table 25 Asia Pacific Food Texturants Powder Revenue (USD Million) By Product (2021-2032)
Table 26 South America Food Texturants Powder Revenue (USD Million) By Type (2021-2032)
Table 27 South America Food Texturants Powder Revenue (USD Million) By Application (2021-2032)
Table 28 South America Food Texturants Powder Revenue (USD Million) By Product (2021-2032)
Table 29 Middle East and Africa Food Texturants Powder Revenue (USD Million) By Type (2021-2032)
Table 30 Middle East and Africa Food Texturants Powder Revenue (USD Million) By Application (2021-2032)
Table 31 Middle East and Africa Food Texturants Powder Revenue (USD Million) By Product (2021-2032)
LIST OF FIGURES
Figure 1. Market Scope
Figure 2. Pricing Forecasts Per Unit, 2023- 2032
Figure 3. Porter’s Five Forces
Figure 4. Global Food Texturants Powder Market Revenue (USD Million) By Regions (2021-2032)
Figure 5. Global Food Texturants Powder Market Share (%) By Regions (2023)
Figure 6. North America Food Texturants Powder Revenue (USD Million) By Country (2021-2032)
Figure 7. United States Food Texturants Powder Revenue (USD Million) By Country (2021-2032)
Figure 8. Canada Food Texturants Powder Revenue (USD Million) By Country (2021-2032)
Figure 9. Mexico Food Texturants Powder Revenue (USD Million) By Country (2021-2032)
Figure 10. Europe Food Texturants Powder Revenue (USD Million) By Country (2021-2032)
Figure 11. Germany Food Texturants Powder Revenue (USD Million) By Country (2021-2032)
Figure 12. France Food Texturants Powder Revenue (USD Million) By Country (2021-2032)
Figure 13. United Kingdom Food Texturants Powder Revenue (USD Million) By Country (2021-2032)
Figure 14. Spain Food Texturants Powder Revenue (USD Million) By Country (2021-2032)
Figure 15. Italy Food Texturants Powder Revenue (USD Million) By Country (2021-2032)
Figure 16. Russia Food Texturants Powder Revenue (USD Million) By Country (2021-2032)
Figure 17. Rest of Europe Food Texturants Powder Revenue (USD Million) By Country (2021-2032)
Figure 11. Asia Pacific Food Texturants Powder Revenue (USD Million) By Country (2021-2032)
Figure 12. China Food Texturants Powder Revenue (USD Million) By Country (2021-2032)
Figure 13. Japan Food Texturants Powder Revenue (USD Million) By Country (2021-2032)
Figure 14. India Food Texturants Powder Revenue (USD Million) By Country (2021-2032)
Figure 15. South Korea Food Texturants Powder Revenue (USD Million) By Country (2021-2032)
Figure 16. Australia Food Texturants Powder Revenue (USD Million) By Country (2021-2032)
Figure 17. South East Asia Food Texturants Powder Revenue (USD Million) By Country (2021-2032)
Figure 18. South America Food Texturants Powder Revenue (USD Million) By Country (2021-2032)
Figure 19. Brazil Food Texturants Powder Revenue (USD Million) By Country (2021-2032)
Figure 20. Argentina Food Texturants Powder Revenue (USD Million) By Country (2021-2032)
Figure 21. Rest of Asia Pacific Food Texturants Powder Revenue (USD Million) By Country (2021-2032)
Figure 22. Middle East and Africa Food Texturants Powder Revenue (USD Million) By Region (2021-2032)
Figure 23. Saudi Arabia Food Texturants Powder Revenue (USD Million) By Region (2021-2032)
Figure 24. The UAE Food Texturants Powder Revenue (USD Million) By Region (2021-2032)
Figure 25. Rest of Middle East Food Texturants Powder Revenue (USD Million) By Region (2021-2032)
Figure 26. South Africa Food Texturants Powder Revenue (USD Million) By Region (2021-2032)
Figure 27. Africa Food Texturants Powder Revenue (USD Million) By Region (2021-2032)
Figure 28. North America Food Texturants Powder Revenue (USD Million) By Type (2021-2032)
Figure 29. North America Food Texturants Powder Revenue (USD Million) By Application (2021-2032)
Figure 30. North America Food Texturants Powder Revenue (USD Million) By Product (2021-2032)
Figure 31. Europe Food Texturants Powder Revenue (USD Million) By Type (2021-2032)
Figure 32. Europe Food Texturants Powder Revenue (USD Million) By Application (2021-2032)
Figure 33. Europe Food Texturants Powder Revenue (USD Million) By Product (2021-2032)
Figure 34. Asia Pacific Food Texturants Powder Revenue (USD Million) By Type (2021-2032)
Figure 35. Asia Pacific Food Texturants Powder Revenue (USD Million) By Application (2021-2032)
Figure 36. Asia Pacific Food Texturants Powder Revenue (USD Million) By Product (2021-2032)
Figure 37. South America Food Texturants Powder Revenue (USD Million) By Type (2021-2032)
Figure 38. South America Food Texturants Powder Revenue (USD Million) By Application (2021-2032)
Figure 39. South America Food Texturants Powder Revenue (USD Million) By Product (2021-2032)
Figure 40. Middle East and Africa Food Texturants Powder Revenue (USD Million) By Type (2021-2032)
Figure 41. Middle East and Africa Food Texturants Powder Revenue (USD Million) By Application (2021-2032)
Figure 42. Middle East and Africa Food Texturants Powder Revenue (USD Million) By Product (2021-2032)
By Type
Hydrocolloids
Emulsifiers
Stabilizers
By Source
Bakery and Confectionery
Dairy Products
Meat and Seafood
Beverages
By Application
Natural
Synthetic
Countries Analyzed
North America (US, Canada, Mexico)
Europe (Germany, UK, France, Spain, Italy, Russia, Rest of Europe)
Asia Pacific (China, India, Japan, South Korea, Australia, South East Asia, Rest of Asia)
South America (Brazil, Argentina, Rest of South America)
Middle East and Africa (Saudi Arabia, UAE, Rest of Middle East, South Africa, Egypt, Rest of Africa)
