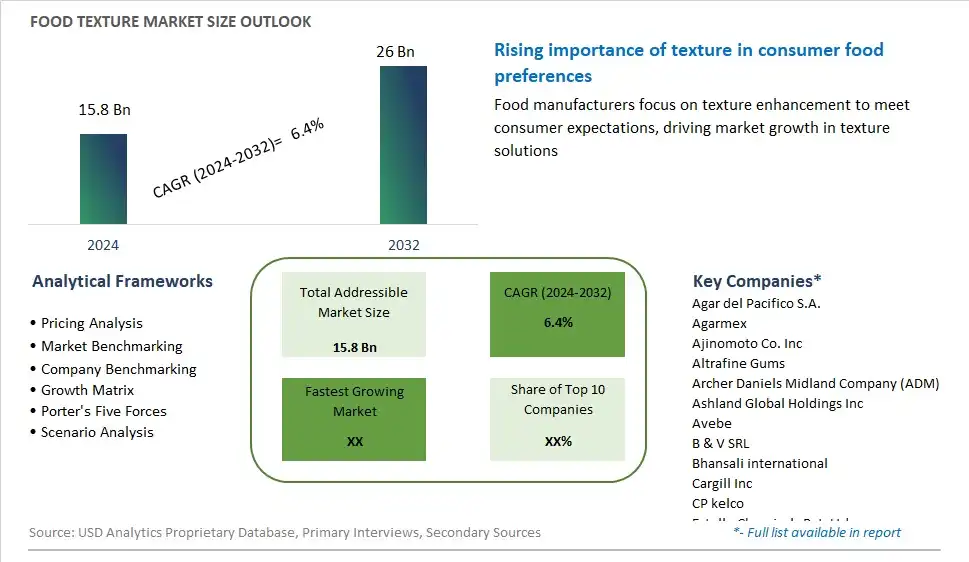
Global Food Texture Market Size is valued at $15.8 Billion in 2024 and is forecast to register a growth rate (CAGR) of 6.4% to reach $26 Billion by 2032.
The global Food Texture Market Comprehensive Study analyzes and forecasts the market size across 6 regions and 24 countries for diverse segments -By Type (Cellulose Derivatives, Gums, Pectin, Gelatin, Starch, Inulin, Dextrin, Others), By Source (Natural, Synthetic), By Form (Dry, Liquid), By Application (Bakery & Confectionery Products, Dairy & Frozen Foods, Meat & Poultry Products, Beverages, Snacks & Savory, Sauces & Dressings, Others), By Functionality (Thickening, Gelling, Emulsifying, Stabilizing, Others)
An Introduction to Food Texture Market
Food texture refers to the physical properties of food products that contribute to their mouthfeel, palatability, and overall sensory experience in 2024. Texture plays a critical role in consumer acceptance and preference, influencing perceptions of freshness, quality, and indulgence in a wide range of food and beverage products. Factors that contribute to food texture include viscosity, hardness, cohesiveness, adhesiveness, and elasticity, which are influenced by ingredients, processing techniques, and formulation parameters. Whether crispy chips, creamy yogurt, or chewy candies, food manufacturers carefully control texture attributes to meet consumer expectations and differentiate their products in the market. With advancements in food science and technology, manufacturers have access to a wide range of ingredients, additives, and processing methods to manipulate texture properties and create novel sensory experiences. As consumer preferences for texture diversity, clean label, and natural ingredients grow, the market for food texture solutions is expected to evolve, driven by innovations in ingredient functionality, texture analysis, and consumer insights that enable manufacturers to meet changing market trends and consumer demands.
Food Texture Competitive Landscape
The market report analyses the leading companies in the industry including Agar del Pacifico S.A., Agarmex, Ajinomoto Co. Inc, Altrafine Gums, Archer Daniels Midland Company (ADM), Ashland Global Holdings Inc, Avebe, B & V SRL, Bhansali international, Cargill Inc, CP kelco, Estelle Chemicals Pvt. Ltd, Fiberstar Inc, IFF, Ingredion Inc, Kerry Group Plc, Naturex, Nexira SAS, Palsgaard A/S, Puratos, Riken Vitamin Co Ltd, Roquette Frères, Royal DSM N.V., Tate & Lyle Plc, and Others.
Food Texture Market Dynamics
Food Texture Market Trend: Growing Demand for Plant-Based and Alternative Protein Products
One prominent trend in the food texture market is the growing demand for plant-based and alternative protein products. As consumers increasingly seek healthier and more sustainable food options, there is a rising interest in plant-based proteins derived from sources such as peas, soy, lentils, and quinoa. These plant-based ingredients are being incorporated into a variety of food products, including meat substitutes, dairy alternatives, snacks, and baked goods. Manufacturers are focusing on enhancing the texture of plant-based products to mimic the mouthfeel and sensory experience of traditional animal-derived foods. Innovative texture-modifying ingredients and processing techniques are being employed to improve the taste, texture, and overall sensory appeal of plant-based products, driving the adoption of food texture solutions tailored for plant-based formulations.
Market Driver: Consumer Preference for Texture-enhanced Foods
A key driver propelling the growth of the food texture market is the consumer preference for texture-enhanced foods. Texture plays a crucial role in shaping consumers' sensory experience and perception of food products, influencing factors such as taste, mouthfeel, and overall enjoyment. Consumers seek foods with desirable texture attributes such as creaminess, crispiness, crunchiness, chewiness, and smoothness. Food manufacturers are responding to these preferences by incorporating texture-modifying ingredients and processing techniques to optimize the texture profile of their products. Texture-enhanced foods not only offer superior sensory properties but also create differentiation and competitive advantage in the market, driving consumer loyalty and repeat purchases. As consumer demand for enjoyable and indulgent eating experiences continues to rise, the focus on texture-enhanced foods is expected to remain a significant driver of innovation and product development in the food industry.
Market Opportunity: Development of Clean Label Texture Solutions
An opportunity within the food texture market lies in the development of clean label texture solutions that meet consumer demand for natural and transparent ingredient labels. With growing awareness of health and wellness, consumers are increasingly scrutinizing food labels and seeking products with clean, recognizable ingredients. There is a rising demand for texture-modifying ingredients derived from natural sources such as starches, gums, fibers, and proteins, as well as clean label alternatives to conventional additives and stabilizers. Manufacturers of food texture solutions have the opportunity to innovate and formulate clean label texture systems that deliver the desired texture characteristics while aligning with clean label requirements. By offering clean label texture solutions free from artificial additives, preservatives, and synthetic chemicals, suppliers can cater to the needs of health-conscious consumers and capitalize on the growing market demand for clean and transparent food products.
Food Texture Market Share Analysis: Gums held the dominant market share in 2024
In the Food Texture market segmented by Type, the Gums segment is the largest category. This dominance is attributed to the extensive utilization of gums, such as xanthan gum, guar gum, and locust bean gum, across various food applications due to their functional versatility and ability to modify texture, viscosity, and stability. Gums serve as essential hydrocolloids in food formulation, offering benefits such as thickening, emulsification, stabilization, and moisture retention, which are critical for achieving desired sensory attributes and product quality. Further, gums find widespread application in a range of food products, including dairy, bakery, confectionery, sauces, dressings, and beverages, where they contribute to enhancing mouthfeel, suspension, and overall consumer appeal. Additionally, gums are favored by food manufacturers for their clean label appeal as natural ingredients derived from plant sources. As consumers increasingly seek products with improved texture and sensory experiences, the demand for gums in food formulation continues to grow, driving innovation and market expansion. As stakeholders prioritize product differentiation and consumer preferences, the Gums segment maintains its leadership position in the Food Texture market, driving growth and innovation to meet the diverse needs of the food industry.
Food Texture Market Share Analysis: Natural Source market is poised to register the fastest growth rae over the forecast period to 2032
In the Food Texture market segmented by Source, the Natural segment is the fastest-growing category. This accelerated growth is propelled by the increasing consumer preference for clean label products and natural ingredients in food formulations. Natural texture modifiers sourced from plants, seaweed, and microbial sources are gaining traction as consumers seek transparency and simplicity in ingredient lists. These natural sources offer functional properties such as thickening, gelling, and stabilizing without the use of synthetic additives, aligning with clean label trends and health-conscious consumer preferences. Further, natural texture ingredients contribute to improved product texture, mouthfeel, and overall sensory experience, driving their adoption across various food categories. Additionally, stringent regulations and growing consumer awareness regarding the potential health risks associated with synthetic additives further bolster the demand for natural texture modifiers. As food manufacturers prioritize product innovation and respond to evolving consumer demands, the Natural Source segment experiences rapid growth, underscoring its significance in driving innovation and sustainability within the Food Texture market.
Food Texture Market Share Analysis: Dry Form Segment held the dominant market share in 2024
In the Food Texture market segmented by Form, the Dry segment is the largest category. This dominance is attributed to the widespread use of dry texture modifiers, such as powders, flakes, and granules, across various food applications due to their ease of handling, storage, and versatility. Dry texture ingredients offer several advantages, including longer shelf life, convenient transportation, and easy integration into food formulations without altering the product's moisture content or sensory attributes. Further, dry texture modifiers are preferred by food manufacturers for their ability to provide consistent texture and functionality in a wide range of products, including bakery, snacks, soups, sauces, and powdered beverages. Additionally, advancements in spray drying and granulation technologies have led to the development of innovative dry texture ingredients with improved dispersibility, solubility, and functionality, further driving their adoption in food processing. As stakeholders seek to optimize production efficiency, minimize waste, and meet consumer preferences for diverse and innovative food offerings, the Dry Form segment maintains its leadership position in the Food Texture market, driving growth and innovation to meet the evolving needs of the food industry.
Food Texture Market Segmentation
By Type
Cellulose Derivatives
Gums
Pectin
Gelatin
Starch
Inulin
Dextrin
Others
By Source
Natural
Synthetic
By Form
Dry
Liquid
By Application
Bakery & Confectionery Products
Dairy & Frozen Foods
Meat & Poultry Products
Beverages
Snacks & Savory
Sauces & Dressings
Others
By Functionality
Thickening
Gelling
Emulsifying
Stabilizing
Others
Countries Analyzed
North America (US, Canada, Mexico)
Europe (Germany, UK, France, Spain, Italy, Russia, Rest of Europe)
Asia Pacific (China, India, Japan, South Korea, Australia, South East Asia, Rest of Asia)
South America (Brazil, Argentina, Rest of South America)
Middle East and Africa (Saudi Arabia, UAE, Rest of Middle East, South Africa, Egypt, Rest of Africa)
Food Texture Companies Profiled in the Study
Agar del Pacifico S.A.
Agarmex
Ajinomoto Co. Inc
Altrafine Gums
Archer Daniels Midland Company (ADM)
Ashland Global Holdings Inc
Avebe
B & V SRL
Bhansali international
Cargill Inc
CP kelco
Estelle Chemicals Pvt. Ltd
Fiberstar Inc
IFF
Ingredion Inc
Kerry Group Plc
Naturex
Nexira SAS
Palsgaard A/S
Puratos
Riken Vitamin Co Ltd
Roquette Frères
Royal DSM N.V.
Tate & Lyle Plc
*- List Not Exhaustive
Chapter 1. TABLE OF CONTENTS
Chapter 2. Introduction to Food Texture Market
2.1. Market Overview
2.2. Key Statistics and Report Highlights
2.3. Scope of the Comprehensive Study
2.3.1. Market Definition
2.3.2 Countries and Regions Covered
2.3.3 Research Objective
2.3.4 Units, Currency, and Conversions
2.3.5 Industry Value Chain
2.4. Key Market Segments
2.5. Key Companies
2.6. Study Period
Chapter 3. Strategic Analysis Review
3.1. Food Texture Pricing Analysis and Forecast
3.2. Porter’s Five Forces
3.3. Market Ecosystem
3.4. SWOT Analysis
3.5. Regulatory Scenario
3.3. Effects of Inflation, Russia-Ukraine War, moderating economic growth, and other macroeconomic factors
Chapter 4. Competitive Landscape
4.1. Market Share Analysis
4.1.1. Global Food Texture Market Share by Company, 2023
4.1.2. Product Offerings of Leading Food Texture Companies
4.2. Market Entropy
4.2.1. New Product Launches in the Industry
4.2.2. Mergers, Acquisitions, Joint ventures, and Partnerships
4.3. Key Strategies and Best Practices
Chapter 5. Global Market Projections: Best, Reference, and Low Case Scenarios
5.1. Growth Analysis- Case Scenario Definitions
5.2. Low Growth Case Scenario Forecasts
5.3. Reference Growth Case Scenario Forecasts
5.4. High Growth Case Scenario Forecasts
Chapter 6. Market Dynamics
6.1. Food Texture Market Drivers
6.2. Food Texture Market Challenges
6.6. Food Texture Market Opportunities
6.4. Food Texture Market Trends
Chapter 7. Global Food Texture Market Outlook Trends
7.1. Global Food Texture Revenue (USD Million) and CAGR (%) by Type (2021-2032)
7.2. Global Food Texture Revenue (USD Million) and CAGR (%) by Application (2021-2032)
7.3. Global Food Texture Revenue (USD Million) and CAGR (%) by Product (2021-2032)
By Type
Cellulose Derivatives
Gums
Pectin
Gelatin
Starch
Inulin
Dextrin
Others
By Source
Natural
Synthetic
By Form
Dry
Liquid
By Application
Bakery & Confectionery Products
Dairy & Frozen Foods
Meat & Poultry Products
Beverages
Snacks & Savory
Sauces & Dressings
Others
By Functionality
Thickening
Gelling
Emulsifying
Stabilizing
Others
Chapter 8. Global Food Texture Regional Analysis and Outlook
8.1. Global Food Texture Revenue (USD Million) By Regions (2021- 2032)
8.2. North America Food Texture Revenue (USD Million) by Country (2021-2032)
8.2.1. United States Food Texture Regional Analysis and Outlook
8.2.2. Canada Food Texture Regional Analysis and Outlook
8.2.3. Mexico Food Texture Regional Analysis and Outlook
8.3. Europe Food Texture Revenue (USD Million), by Country (2021-2032)
8.3.1. Germany Food Texture Regional Analysis and Outlook
8.3.2. France Food Texture Regional Analysis and Outlook
8.3.3. United Kingdom Food Texture Regional Analysis and Outlook
8.3.4. Spain Food Texture Regional Analysis and Outlook
8.3.5. Italy Food Texture Regional Analysis and Outlook
8.3.6. Russia Food Texture Regional Analysis and Outlook
8.3.7. Rest of Europe Food Texture Regional Analysis and Outlook
8.4. Asia Pacific Food Texture Revenue (USD Million) by Country (2021-2032)
8.4.1. China Food Texture Regional Analysis and Outlook
8.4.2. Japan Food Texture Regional Analysis and Outlook
8.4.3. India Food Texture Regional Analysis and Outlook
8.4.4. South Korea Food Texture Regional Analysis and Outlook
8.4.5. Australia Food Texture Regional Analysis and Outlook
8.4.6. South East Asia Food Texture Regional Analysis and Outlook
8.4.7. Rest of Asia Pacific Food Texture Regional Analysis and Outlook
8.5. South America Food Texture Revenue (USD Million), by Country (2021-2032)
8.5.1. Brazil Food Texture Regional Analysis and Outlook
8.5.2. Argentina Food Texture Regional Analysis and Outlook
8.5.3. Rest of South America Food Texture Regional Analysis and Outlook
8.6. Middle East and Africa Food Texture Revenue (USD Million) by Country (2021-2032)
8.6.1. Middle East Food Texture Regional Analysis and Outlook
8.6.2. Africa Food Texture Regional Analysis and Outlook
Chapter 9. North America Food Texture Analysis and Outlook
9.1. North America Food Texture Revenue (USD Million) by Segments (2021-2032)
9.1.1. North America Food Texture Revenue (USD Million) by Type (2021-2032)
9.1.2. North America Food Texture Revenue (USD Million) by Application (2021-2032)
9.1.3. North America Food Texture Revenue (USD Million) by Product (2021-2032)
By Type
Cellulose Derivatives
Gums
Pectin
Gelatin
Starch
Inulin
Dextrin
Others
By Source
Natural
Synthetic
By Form
Dry
Liquid
By Application
Bakery & Confectionery Products
Dairy & Frozen Foods
Meat & Poultry Products
Beverages
Snacks & Savory
Sauces & Dressings
Others
By Functionality
Thickening
Gelling
Emulsifying
Stabilizing
Others
Chapter 10. Europe Food Texture Analysis and Outlook
10.1. Europe Food Texture Revenue (USD Million), by Segments (USD Million) (2021-2032)
10.1.1. Europe Food Texture Revenue (USD Million) by Type (2021-2032)
10.1.2. Europe Food Texture Revenue (USD Million) by Application (2021-2032)
10.1.3. Europe Food Texture Revenue (USD Million) by Product (2021-2032)
By Type
Cellulose Derivatives
Gums
Pectin
Gelatin
Starch
Inulin
Dextrin
Others
By Source
Natural
Synthetic
By Form
Dry
Liquid
By Application
Bakery & Confectionery Products
Dairy & Frozen Foods
Meat & Poultry Products
Beverages
Snacks & Savory
Sauces & Dressings
Others
By Functionality
Thickening
Gelling
Emulsifying
Stabilizing
Others
Chapter 11. Asia Pacific Food Texture Analysis and Outlook
11.1. Asia Pacific Food Texture Revenue (USD Million), and Revenue (USD Million) by Segments (2021-2032)
11.1.1. Asia Pacific Food Texture Revenue (USD Million) by Type (2021-2032)
11.1.2. Asia Pacific Food Texture Revenue (USD Million) by Application (2021-2032)
11.1.3. Asia Pacific Food Texture Revenue (USD Million) by Product (2021-2032)
By Type
Cellulose Derivatives
Gums
Pectin
Gelatin
Starch
Inulin
Dextrin
Others
By Source
Natural
Synthetic
By Form
Dry
Liquid
By Application
Bakery & Confectionery Products
Dairy & Frozen Foods
Meat & Poultry Products
Beverages
Snacks & Savory
Sauces & Dressings
Others
By Functionality
Thickening
Gelling
Emulsifying
Stabilizing
Others
Chapter 12. South America Food Texture Analysis and Outlook
12.1. South America Food Texture Revenue (USD Million), by Segments (2021-2032)
12.1.1. South America Food Texture Revenue (USD Million) by Type (2021-2032)
12.1.2. South America Food Texture Revenue (USD Million) by Application (2021-2032)
12.1.3. South America Food Texture Revenue (USD Million) by Product (2021-2032)
By Type
Cellulose Derivatives
Gums
Pectin
Gelatin
Starch
Inulin
Dextrin
Others
By Source
Natural
Synthetic
By Form
Dry
Liquid
By Application
Bakery & Confectionery Products
Dairy & Frozen Foods
Meat & Poultry Products
Beverages
Snacks & Savory
Sauces & Dressings
Others
By Functionality
Thickening
Gelling
Emulsifying
Stabilizing
Others
Chapter 13. Middle East and Africa Food Texture Analysis and Outlook
13.1. Middle East and Africa Food Texture Revenue (USD Million), by Segments (2021-2032)
13.1.1. Middle East and Africa Food Texture Revenue (USD Million) by Type (2021-2032)
13.1.2. Middle East and Africa Food Texture Revenue (USD Million) by Application (2021-2032)
13.1.3. Middle East and Africa Food Texture Revenue (USD Million) by Product (2021-2032)
By Type
Cellulose Derivatives
Gums
Pectin
Gelatin
Starch
Inulin
Dextrin
Others
By Source
Natural
Synthetic
By Form
Dry
Liquid
By Application
Bakery & Confectionery Products
Dairy & Frozen Foods
Meat & Poultry Products
Beverages
Snacks & Savory
Sauces & Dressings
Others
By Functionality
Thickening
Gelling
Emulsifying
Stabilizing
Others
Chapter 14. Food Texture Company Profiles
14.1 Business Overview
14.2 Product Profiles
14.3 SWOT Profiles
14.5 Recent Developments
14.6 Financial Profile
List of Companies
Agar del Pacifico S.A.
Agarmex
Ajinomoto Co. Inc
Altrafine Gums
Archer Daniels Midland Company (ADM)
Ashland Global Holdings Inc
Avebe
B & V SRL
Bhansali international
Cargill Inc
CP kelco
Estelle Chemicals Pvt. Ltd
Fiberstar Inc
IFF
Ingredion Inc
Kerry Group Plc
Naturex
Nexira SAS
Palsgaard A/S
Puratos
Riken Vitamin Co Ltd
Roquette Frères
Royal DSM N.V.
Tate & Lyle Plc
15. Methodology and Data Sources
15.1 Customization Offerings
15.2 Subscription Services
15.3 Related Reports
15.4 Publisher Expertise
LIST OF TABLES
Table 1 Market Segmentation Analysis
Table 2 Global Food Texture Market Share of Leading Companies, 2023
Table 3 Product Offerings of Leading Companies
Table 4 Low Growth Scenario Forecasts
Table 5 Reference Case Growth Scenario
Table 6 High Growth Case Scenario
Table 7 Global Food Texture Revenue (USD Million) And CAGR (%) By Type (2021-2032)
Table 8 Global Food Texture Revenue (USD Million) And CAGR (%) By Application (2021-2032)
Table 9 Global Food Texture Revenue (USD Million) And CAGR (%) By Product (2021-2032)
Table 10 Global Food Texture Market Revenue (USD Million) By Regions (2021-2032)
Table 11 Global Food Texture Market Share (%) By Regions (2021-2032)
Table 12 North America Food Texture Revenue (USD Million) By Country (2021-2032)
Table 13 Europe Food Texture Revenue (USD Million) By Country (2021-2032)
Table 14 Asia Pacific Food Texture Revenue (USD Million) By Country (2021-2032)
Table 15 South America Food Texture Revenue (USD Million) By Country (2021-2032)
Table 16 Middle East and Africa Food Texture Revenue (USD Million) By Region (2021-2032)
Table 17 North America Food Texture Revenue (USD Million) By Type (2021-2032)
Table 18 North America Food Texture Revenue (USD Million) By Application (2021-2032)
Table 19 North America Food Texture Revenue (USD Million) By Product (2021-2032)
Table 20 Europe Food Texture Revenue (USD Million) By Type (2021-2032)
Table 21 Europe Food Texture Revenue (USD Million) By Application (2021-2032)
Table 22 Europe Food Texture Revenue (USD Million) By Product (2021-2032)
Table 23 Asia Pacific Food Texture Revenue (USD Million) By Type (2021-2032)
Table 24 Asia Pacific Food Texture Revenue (USD Million) By Application (2021-2032)
Table 25 Asia Pacific Food Texture Revenue (USD Million) By Product (2021-2032)
Table 26 South America Food Texture Revenue (USD Million) By Type (2021-2032)
Table 27 South America Food Texture Revenue (USD Million) By Application (2021-2032)
Table 28 South America Food Texture Revenue (USD Million) By Product (2021-2032)
Table 29 Middle East and Africa Food Texture Revenue (USD Million) By Type (2021-2032)
Table 30 Middle East and Africa Food Texture Revenue (USD Million) By Application (2021-2032)
Table 31 Middle East and Africa Food Texture Revenue (USD Million) By Product (2021-2032)
LIST OF FIGURES
Figure 1. Market Scope
Figure 2. Pricing Forecasts Per Unit, 2023- 2032
Figure 3. Porter’s Five Forces
Figure 4. Global Food Texture Market Revenue (USD Million) By Regions (2021-2032)
Figure 5. Global Food Texture Market Share (%) By Regions (2023)
Figure 6. North America Food Texture Revenue (USD Million) By Country (2021-2032)
Figure 7. United States Food Texture Revenue (USD Million) By Country (2021-2032)
Figure 8. Canada Food Texture Revenue (USD Million) By Country (2021-2032)
Figure 9. Mexico Food Texture Revenue (USD Million) By Country (2021-2032)
Figure 10. Europe Food Texture Revenue (USD Million) By Country (2021-2032)
Figure 11. Germany Food Texture Revenue (USD Million) By Country (2021-2032)
Figure 12. France Food Texture Revenue (USD Million) By Country (2021-2032)
Figure 13. United Kingdom Food Texture Revenue (USD Million) By Country (2021-2032)
Figure 14. Spain Food Texture Revenue (USD Million) By Country (2021-2032)
Figure 15. Italy Food Texture Revenue (USD Million) By Country (2021-2032)
Figure 16. Russia Food Texture Revenue (USD Million) By Country (2021-2032)
Figure 17. Rest of Europe Food Texture Revenue (USD Million) By Country (2021-2032)
Figure 11. Asia Pacific Food Texture Revenue (USD Million) By Country (2021-2032)
Figure 12. China Food Texture Revenue (USD Million) By Country (2021-2032)
Figure 13. Japan Food Texture Revenue (USD Million) By Country (2021-2032)
Figure 14. India Food Texture Revenue (USD Million) By Country (2021-2032)
Figure 15. South Korea Food Texture Revenue (USD Million) By Country (2021-2032)
Figure 16. Australia Food Texture Revenue (USD Million) By Country (2021-2032)
Figure 17. South East Asia Food Texture Revenue (USD Million) By Country (2021-2032)
Figure 18. South America Food Texture Revenue (USD Million) By Country (2021-2032)
Figure 19. Brazil Food Texture Revenue (USD Million) By Country (2021-2032)
Figure 20. Argentina Food Texture Revenue (USD Million) By Country (2021-2032)
Figure 21. Rest of Asia Pacific Food Texture Revenue (USD Million) By Country (2021-2032)
Figure 22. Middle East and Africa Food Texture Revenue (USD Million) By Region (2021-2032)
Figure 23. Saudi Arabia Food Texture Revenue (USD Million) By Region (2021-2032)
Figure 24. The UAE Food Texture Revenue (USD Million) By Region (2021-2032)
Figure 25. Rest of Middle East Food Texture Revenue (USD Million) By Region (2021-2032)
Figure 26. South Africa Food Texture Revenue (USD Million) By Region (2021-2032)
Figure 27. Africa Food Texture Revenue (USD Million) By Region (2021-2032)
Figure 28. North America Food Texture Revenue (USD Million) By Type (2021-2032)
Figure 29. North America Food Texture Revenue (USD Million) By Application (2021-2032)
Figure 30. North America Food Texture Revenue (USD Million) By Product (2021-2032)
Figure 31. Europe Food Texture Revenue (USD Million) By Type (2021-2032)
Figure 32. Europe Food Texture Revenue (USD Million) By Application (2021-2032)
Figure 33. Europe Food Texture Revenue (USD Million) By Product (2021-2032)
Figure 34. Asia Pacific Food Texture Revenue (USD Million) By Type (2021-2032)
Figure 35. Asia Pacific Food Texture Revenue (USD Million) By Application (2021-2032)
Figure 36. Asia Pacific Food Texture Revenue (USD Million) By Product (2021-2032)
Figure 37. South America Food Texture Revenue (USD Million) By Type (2021-2032)
Figure 38. South America Food Texture Revenue (USD Million) By Application (2021-2032)
Figure 39. South America Food Texture Revenue (USD Million) By Product (2021-2032)
Figure 40. Middle East and Africa Food Texture Revenue (USD Million) By Type (2021-2032)
Figure 41. Middle East and Africa Food Texture Revenue (USD Million) By Application (2021-2032)
Figure 42. Middle East and Africa Food Texture Revenue (USD Million) By Product (2021-2032)
By Type
Cellulose Derivatives
Gums
Pectin
Gelatin
Starch
Inulin
Dextrin
Others
By Source
Natural
Synthetic
By Form
Dry
Liquid
By Application
Bakery & Confectionery Products
Dairy & Frozen Foods
Meat & Poultry Products
Beverages
Snacks & Savory
Sauces & Dressings
Others
By Functionality
Thickening
Gelling
Emulsifying
Stabilizing
Others
Countries Analyzed
North America (US, Canada, Mexico)
Europe (Germany, UK, France, Spain, Italy, Russia, Rest of Europe)
Asia Pacific (China, India, Japan, South Korea, Australia, South East Asia, Rest of Asia)
South America (Brazil, Argentina, Rest of South America)
Middle East and Africa (Saudi Arabia, UAE, Rest of Middle East, South Africa, Egypt, Rest of Africa)
