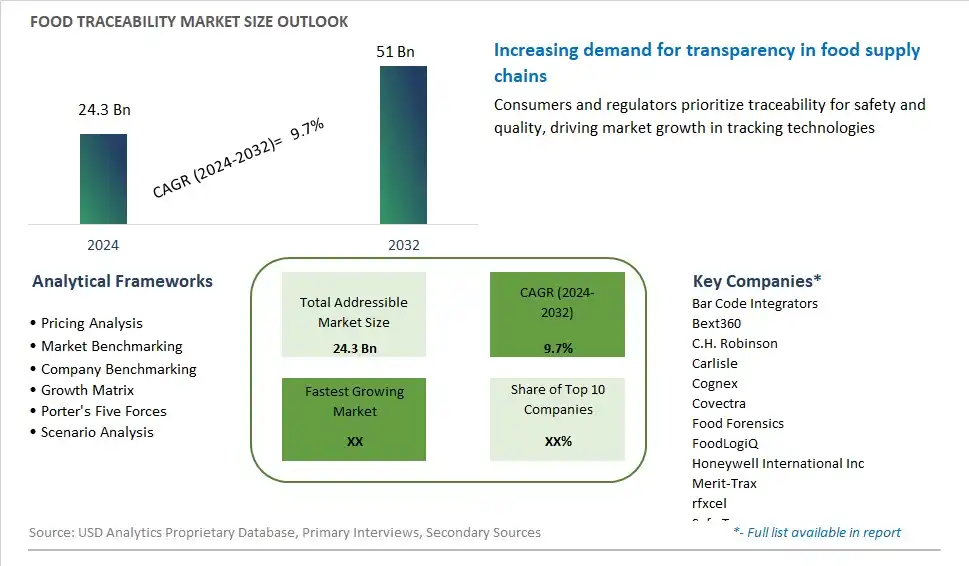
Global Food Traceability Market Size is valued at $24.3 Billion in 2024 and is forecast to register a growth rate (CAGR) of 9.7% to reach $51 Billion by 2032.
The global Food Traceability Market Comprehensive Study analyzes and forecasts the market size across 6 regions and 24 countries for diverse segments -By Type (Radio Frequency Identification, Barcodes, Infrared, Biometrics, Global Positioning Systems, Others), By Software (Enterprise Resources Planning (ERP), Friction Welding, Laboratory Information Systems, Warehouse Software, Supply Chain Management (SCM), Others), By End-User (Fruits & Vegetables, Fruit Pulp & Concentrates, Dairy Products, Fish, Meat, Seafood, Processed Food, Bakery & Confectionary, Others)
An Introduction to Food Traceability Market
Food traceability refers to the ability to track and trace the movement of food products and ingredients throughout the supply chain, from farm to fork, to ensure transparency, accountability, and safety in 2024. With increasing concerns about food safety, fraud, and sustainability, traceability systems are becoming essential tools for regulators, manufacturers, and consumers to identify the origin, processing history, and distribution of food products. Traceability systems utilize technologies such as barcodes, RFID tags, blockchain, and cloud-based databases to capture and record relevant information at each stage of the supply chain, including production, processing, distribution, and retail. By enabling rapid identification and targeted recall of contaminated or compromised products, traceability systems help mitigate foodborne illness outbreaks, minimize economic losses, and protect public health. With growing consumer demand for transparency, authenticity, and ethical sourcing, the adoption of traceability solutions is expected to increase across the food industry, driving innovation and collaboration in supply chain management, data interoperability, and regulatory compliance.
Food Traceability Competitive Landscape
The market report analyses the leading companies in the industry including Bar Code Integrators, Bext360, C.H. Robinson, Carlisle, Cognex, Covectra, Food Forensics, FoodLogiQ, Honeywell International Inc, Merit-Trax, rfxcel, Safe Traces, SGS SA, Zebra Technologies, and Others.
Food Traceability Market Dynamics
Food Traceability Market Trend: Increasing Focus on Transparency and Food Safety
One prominent trend in the food traceability market is the increasing focus on transparency and food safety throughout the supply chain. With rising concerns over foodborne illnesses, product recalls, and food fraud incidents, consumers, regulators, and industry stakeholders are placing greater emphasis on traceability solutions to track the journey of food products from farm to fork. There is a growing demand for robust traceability systems that enable real-time monitoring, traceability, and authentication of food products at every stage of production, processing, distribution, and retail. Advanced technologies such as blockchain, RFID (Radio Frequency Identification), IoT (Internet of Things), and AI (Artificial Intelligence) are being leveraged to enhance traceability, ensure product authenticity, and mitigate risks related to food safety and quality.
Market Driver: Regulatory Compliance and Quality Assurance Requirements
A key driver fueling the growth of the food traceability market is the increasing regulatory compliance and quality assurance requirements imposed by governments and regulatory bodies worldwide. Stringent regulations and standards mandating traceability, labeling, and documentation of food products are driving the adoption of traceability solutions across the food industry. Requirements such as the Food Safety Modernization Act (FSMA) in the United States, the General Food Law in the European Union, and similar regulations in other regions necessitate comprehensive traceability systems to enable rapid identification and recall of contaminated or adulterated food products. Additionally, food manufacturers, retailers, and suppliers are investing in traceability solutions to uphold brand reputation, mitigate legal risks, and demonstrate compliance with food safety standards, thereby driving the demand for food traceability technologies and services.
Market Opportunity: Integration of Blockchain Technology for Enhanced Traceability
An opportunity within the food traceability market lies in the integration of blockchain technology to enable enhanced traceability, transparency, and trust across the food supply chain. Blockchain offers a decentralized and immutable ledger that records transactions and data exchanges in a secure and transparent manner, making it well-suited for traceability applications in the food industry. By leveraging blockchain-based traceability platforms, stakeholders can securely capture and share critical information related to the origin, production, processing, distribution, and authentication of food products. Blockchain enables end-to-end visibility and auditability, allowing consumers to access detailed information about the journey of their food, including farming practices, processing methods, certifications, and sustainability initiatives. By embracing blockchain-enabled traceability solutions, food companies can enhance consumer trust, address food safety concerns, reduce fraud and counterfeit products, and unlock new opportunities for product differentiation and market competitiveness.
Food Traceability Market Share Analysis: Barcodes Segment held the dominant market share in 2024
In the Food Traceability market segmented by Type, the Barcodes segment is the largest category. This dominance is attributed to the widespread adoption of barcoding technology across the food industry due to its simplicity, reliability, and cost-effectiveness. Barcodes provide a straightforward and efficient method for tracking and tracing food products throughout the supply chain, from production and processing to distribution and retail. Further, barcodes are compatible with existing infrastructure and systems, making them easily implementable for food manufacturers, distributors, and retailers of all sizes. Additionally, barcodes offer versatility in encoding various types of information, including product identification, batch numbers, expiration dates, and origin details, facilitating accurate and efficient traceability. As food safety regulations become more stringent and consumers demand greater transparency and accountability in the food supply chain, the use of barcodes for traceability purposes continues to grow. Furthermore, advancements in barcode technology, such as 2D barcodes and smartphone scanning capabilities, enhance the capabilities and accessibility of barcode-based traceability solutions. As stakeholders prioritize food safety, quality, and compliance with regulatory requirements, the Barcodes segment maintains its leadership position in the Food Traceability market, driving growth and innovation to ensure the integrity and safety of the global food supply.
Food Traceability Market Share Analysis: Supply Chain Management (SCM) Software market is poised to register the fastest growth rae over the forecast period to 2032
In the Food Traceability market segmented by Software, the Supply Chain Management (SCM) segment is the fastest-growing category. This accelerated growth is propelled by the increasing demand for comprehensive traceability solutions that offer end-to-end visibility and control over the food supply chain. SCM software provides food manufacturers, distributors, and retailers with robust tools and capabilities to track and trace food products at every stage of the supply chain, from raw materials sourcing to final delivery. Additionally, SCM software integrates data from various sources, including production facilities, warehouses, transportation vehicles, and retail outlets, to provide real-time insights into product movement, inventory levels, and compliance status. Further, SCM software enables stakeholders to efficiently manage recalls, mitigate risks, and ensure regulatory compliance, enhancing operational efficiency and customer trust. As food safety regulations become more stringent and consumer expectations for transparency and accountability rise, the adoption of SCM software for food traceability purposes continues to grow. Furthermore, advancements in SCM technology, such as blockchain and IoT integration, further enhance the capabilities and effectiveness of SCM solutions in ensuring food safety and quality throughout the supply chain. As stakeholders prioritize food safety, compliance, and operational efficiency, the Supply Chain Management (SCM) Software segment experiences rapid growth, driving innovation and transformation in the Food Traceability market.
Food Traceability Market Share Analysis: Meat Segment held the dominant market share in 2024
In the Food Traceability market segmented by End-User, the Meat segment is the largest category. This dominance is primarily attributed to the stringent regulatory requirements and heightened consumer demands for transparency and safety in the meat industry. Meat products are highly perishable and prone to contamination, making traceability essential to ensure food safety and quality throughout the supply chain. Further, incidents of foodborne illnesses and product recalls have raised awareness among consumers, prompting them to seek reassurance about the origin and handling of meat products. Additionally, regulatory bodies worldwide mandate traceability measures for meat products to enable quick and accurate identification of sources in the event of contamination or outbreak. As a result, meat producers, processors, and retailers invest significantly in traceability systems and technologies to comply with regulations, minimize risks, and maintain consumer trust. Furthermore, advancements in traceability technologies, such as blockchain and RFID tagging, enhance the accuracy and efficiency of traceability solutions in the meat industry. As stakeholders prioritize food safety and compliance, the Meat segment retains its leadership position in the Food Traceability market, driving growth and innovation to meet the evolving needs of the global meat supply chain.
Food Traceability Market Segmentation
By Type
Radio Frequency Identification
Barcodes
Infrared
Biometrics
Global Positioning Systems
Others
By Software
Enterprise Resources Planning (ERP)
Friction Welding
Laboratory Information Systems
Warehouse Software
Supply Chain Management (SCM)
Others
By End-User
Fruits & Vegetables
Fruit Pulp & Concentrates
Dairy Products
Fish
Meat
Seafood
Processed Food
Bakery & Confectionary
Others
Countries Analyzed
North America (US, Canada, Mexico)
Europe (Germany, UK, France, Spain, Italy, Russia, Rest of Europe)
Asia Pacific (China, India, Japan, South Korea, Australia, South East Asia, Rest of Asia)
South America (Brazil, Argentina, Rest of South America)
Middle East and Africa (Saudi Arabia, UAE, Rest of Middle East, South Africa, Egypt, Rest of Africa)
Food Traceability Companies Profiled in the Study
Bar Code Integrators
Bext360
C.H. Robinson
Carlisle
Cognex
Covectra
Food Forensics
FoodLogiQ
Honeywell International Inc
Merit-Trax
rfxcel
Safe Traces
SGS SA
Zebra Technologies
*- List Not Exhaustive
Chapter 1. TABLE OF CONTENTS
Chapter 2. Introduction to Food Traceability Market
2.1. Market Overview
2.2. Key Statistics and Report Highlights
2.3. Scope of the Comprehensive Study
2.3.1. Market Definition
2.3.2 Countries and Regions Covered
2.3.3 Research Objective
2.3.4 Units, Currency, and Conversions
2.3.5 Industry Value Chain
2.4. Key Market Segments
2.5. Key Companies
2.6. Study Period
Chapter 3. Strategic Analysis Review
3.1. Food Traceability Pricing Analysis and Forecast
3.2. Porter’s Five Forces
3.3. Market Ecosystem
3.4. SWOT Analysis
3.5. Regulatory Scenario
3.3. Effects of Inflation, Russia-Ukraine War, moderating economic growth, and other macroeconomic factors
Chapter 4. Competitive Landscape
4.1. Market Share Analysis
4.1.1. Global Food Traceability Market Share by Company, 2023
4.1.2. Product Offerings of Leading Food Traceability Companies
4.2. Market Entropy
4.2.1. New Product Launches in the Industry
4.2.2. Mergers, Acquisitions, Joint ventures, and Partnerships
4.3. Key Strategies and Best Practices
Chapter 5. Global Market Projections: Best, Reference, and Low Case Scenarios
5.1. Growth Analysis- Case Scenario Definitions
5.2. Low Growth Case Scenario Forecasts
5.3. Reference Growth Case Scenario Forecasts
5.4. High Growth Case Scenario Forecasts
Chapter 6. Market Dynamics
6.1. Food Traceability Market Drivers
6.2. Food Traceability Market Challenges
6.6. Food Traceability Market Opportunities
6.4. Food Traceability Market Trends
Chapter 7. Global Food Traceability Market Outlook Trends
7.1. Global Food Traceability Revenue (USD Million) and CAGR (%) by Type (2021-2032)
7.2. Global Food Traceability Revenue (USD Million) and CAGR (%) by Application (2021-2032)
7.3. Global Food Traceability Revenue (USD Million) and CAGR (%) by Product (2021-2032)
By Type
Radio Frequency Identification
Barcodes
Infrared
Biometrics
Global Positioning Systems
Others
By Software
Enterprise Resources Planning (ERP)
Friction Welding
Laboratory Information Systems
Warehouse Software
Supply Chain Management (SCM)
Others
By End-User
Fruits & Vegetables
Fruit Pulp & Concentrates
Dairy Products
Fish
Meat
Seafood
Processed Food
Bakery & Confectionary
Others
Chapter 8. Global Food Traceability Regional Analysis and Outlook
8.1. Global Food Traceability Revenue (USD Million) By Regions (2021- 2032)
8.2. North America Food Traceability Revenue (USD Million) by Country (2021-2032)
8.2.1. United States Food Traceability Regional Analysis and Outlook
8.2.2. Canada Food Traceability Regional Analysis and Outlook
8.2.3. Mexico Food Traceability Regional Analysis and Outlook
8.3. Europe Food Traceability Revenue (USD Million), by Country (2021-2032)
8.3.1. Germany Food Traceability Regional Analysis and Outlook
8.3.2. France Food Traceability Regional Analysis and Outlook
8.3.3. United Kingdom Food Traceability Regional Analysis and Outlook
8.3.4. Spain Food Traceability Regional Analysis and Outlook
8.3.5. Italy Food Traceability Regional Analysis and Outlook
8.3.6. Russia Food Traceability Regional Analysis and Outlook
8.3.7. Rest of Europe Food Traceability Regional Analysis and Outlook
8.4. Asia Pacific Food Traceability Revenue (USD Million) by Country (2021-2032)
8.4.1. China Food Traceability Regional Analysis and Outlook
8.4.2. Japan Food Traceability Regional Analysis and Outlook
8.4.3. India Food Traceability Regional Analysis and Outlook
8.4.4. South Korea Food Traceability Regional Analysis and Outlook
8.4.5. Australia Food Traceability Regional Analysis and Outlook
8.4.6. South East Asia Food Traceability Regional Analysis and Outlook
8.4.7. Rest of Asia Pacific Food Traceability Regional Analysis and Outlook
8.5. South America Food Traceability Revenue (USD Million), by Country (2021-2032)
8.5.1. Brazil Food Traceability Regional Analysis and Outlook
8.5.2. Argentina Food Traceability Regional Analysis and Outlook
8.5.3. Rest of South America Food Traceability Regional Analysis and Outlook
8.6. Middle East and Africa Food Traceability Revenue (USD Million) by Country (2021-2032)
8.6.1. Middle East Food Traceability Regional Analysis and Outlook
8.6.2. Africa Food Traceability Regional Analysis and Outlook
Chapter 9. North America Food Traceability Analysis and Outlook
9.1. North America Food Traceability Revenue (USD Million) by Segments (2021-2032)
9.1.1. North America Food Traceability Revenue (USD Million) by Type (2021-2032)
9.1.2. North America Food Traceability Revenue (USD Million) by Application (2021-2032)
9.1.3. North America Food Traceability Revenue (USD Million) by Product (2021-2032)
By Type
Radio Frequency Identification
Barcodes
Infrared
Biometrics
Global Positioning Systems
Others
By Software
Enterprise Resources Planning (ERP)
Friction Welding
Laboratory Information Systems
Warehouse Software
Supply Chain Management (SCM)
Others
By End-User
Fruits & Vegetables
Fruit Pulp & Concentrates
Dairy Products
Fish
Meat
Seafood
Processed Food
Bakery & Confectionary
Others
Chapter 10. Europe Food Traceability Analysis and Outlook
10.1. Europe Food Traceability Revenue (USD Million), by Segments (USD Million) (2021-2032)
10.1.1. Europe Food Traceability Revenue (USD Million) by Type (2021-2032)
10.1.2. Europe Food Traceability Revenue (USD Million) by Application (2021-2032)
10.1.3. Europe Food Traceability Revenue (USD Million) by Product (2021-2032)
By Type
Radio Frequency Identification
Barcodes
Infrared
Biometrics
Global Positioning Systems
Others
By Software
Enterprise Resources Planning (ERP)
Friction Welding
Laboratory Information Systems
Warehouse Software
Supply Chain Management (SCM)
Others
By End-User
Fruits & Vegetables
Fruit Pulp & Concentrates
Dairy Products
Fish
Meat
Seafood
Processed Food
Bakery & Confectionary
Others
Chapter 11. Asia Pacific Food Traceability Analysis and Outlook
11.1. Asia Pacific Food Traceability Revenue (USD Million), and Revenue (USD Million) by Segments (2021-2032)
11.1.1. Asia Pacific Food Traceability Revenue (USD Million) by Type (2021-2032)
11.1.2. Asia Pacific Food Traceability Revenue (USD Million) by Application (2021-2032)
11.1.3. Asia Pacific Food Traceability Revenue (USD Million) by Product (2021-2032)
By Type
Radio Frequency Identification
Barcodes
Infrared
Biometrics
Global Positioning Systems
Others
By Software
Enterprise Resources Planning (ERP)
Friction Welding
Laboratory Information Systems
Warehouse Software
Supply Chain Management (SCM)
Others
By End-User
Fruits & Vegetables
Fruit Pulp & Concentrates
Dairy Products
Fish
Meat
Seafood
Processed Food
Bakery & Confectionary
Others
Chapter 12. South America Food Traceability Analysis and Outlook
12.1. South America Food Traceability Revenue (USD Million), by Segments (2021-2032)
12.1.1. South America Food Traceability Revenue (USD Million) by Type (2021-2032)
12.1.2. South America Food Traceability Revenue (USD Million) by Application (2021-2032)
12.1.3. South America Food Traceability Revenue (USD Million) by Product (2021-2032)
By Type
Radio Frequency Identification
Barcodes
Infrared
Biometrics
Global Positioning Systems
Others
By Software
Enterprise Resources Planning (ERP)
Friction Welding
Laboratory Information Systems
Warehouse Software
Supply Chain Management (SCM)
Others
By End-User
Fruits & Vegetables
Fruit Pulp & Concentrates
Dairy Products
Fish
Meat
Seafood
Processed Food
Bakery & Confectionary
Others
Chapter 13. Middle East and Africa Food Traceability Analysis and Outlook
13.1. Middle East and Africa Food Traceability Revenue (USD Million), by Segments (2021-2032)
13.1.1. Middle East and Africa Food Traceability Revenue (USD Million) by Type (2021-2032)
13.1.2. Middle East and Africa Food Traceability Revenue (USD Million) by Application (2021-2032)
13.1.3. Middle East and Africa Food Traceability Revenue (USD Million) by Product (2021-2032)
By Type
Radio Frequency Identification
Barcodes
Infrared
Biometrics
Global Positioning Systems
Others
By Software
Enterprise Resources Planning (ERP)
Friction Welding
Laboratory Information Systems
Warehouse Software
Supply Chain Management (SCM)
Others
By End-User
Fruits & Vegetables
Fruit Pulp & Concentrates
Dairy Products
Fish
Meat
Seafood
Processed Food
Bakery & Confectionary
Others
Chapter 14. Food Traceability Company Profiles
14.1 Business Overview
14.2 Product Profiles
14.3 SWOT Profiles
14.5 Recent Developments
14.6 Financial Profile
List of Companies
Bar Code Integrators
Bext360
C.H. Robinson
Carlisle
Cognex
Covectra
Food Forensics
FoodLogiQ
Honeywell International Inc
Merit-Trax
rfxcel
Safe Traces
SGS SA
Zebra Technologies
15. Methodology and Data Sources
15.1 Customization Offerings
15.2 Subscription Services
15.3 Related Reports
15.4 Publisher Expertise
LIST OF TABLES
Table 1 Market Segmentation Analysis
Table 2 Global Food Traceability Market Share of Leading Companies, 2023
Table 3 Product Offerings of Leading Companies
Table 4 Low Growth Scenario Forecasts
Table 5 Reference Case Growth Scenario
Table 6 High Growth Case Scenario
Table 7 Global Food Traceability Revenue (USD Million) And CAGR (%) By Type (2021-2032)
Table 8 Global Food Traceability Revenue (USD Million) And CAGR (%) By Application (2021-2032)
Table 9 Global Food Traceability Revenue (USD Million) And CAGR (%) By Product (2021-2032)
Table 10 Global Food Traceability Market Revenue (USD Million) By Regions (2021-2032)
Table 11 Global Food Traceability Market Share (%) By Regions (2021-2032)
Table 12 North America Food Traceability Revenue (USD Million) By Country (2021-2032)
Table 13 Europe Food Traceability Revenue (USD Million) By Country (2021-2032)
Table 14 Asia Pacific Food Traceability Revenue (USD Million) By Country (2021-2032)
Table 15 South America Food Traceability Revenue (USD Million) By Country (2021-2032)
Table 16 Middle East and Africa Food Traceability Revenue (USD Million) By Region (2021-2032)
Table 17 North America Food Traceability Revenue (USD Million) By Type (2021-2032)
Table 18 North America Food Traceability Revenue (USD Million) By Application (2021-2032)
Table 19 North America Food Traceability Revenue (USD Million) By Product (2021-2032)
Table 20 Europe Food Traceability Revenue (USD Million) By Type (2021-2032)
Table 21 Europe Food Traceability Revenue (USD Million) By Application (2021-2032)
Table 22 Europe Food Traceability Revenue (USD Million) By Product (2021-2032)
Table 23 Asia Pacific Food Traceability Revenue (USD Million) By Type (2021-2032)
Table 24 Asia Pacific Food Traceability Revenue (USD Million) By Application (2021-2032)
Table 25 Asia Pacific Food Traceability Revenue (USD Million) By Product (2021-2032)
Table 26 South America Food Traceability Revenue (USD Million) By Type (2021-2032)
Table 27 South America Food Traceability Revenue (USD Million) By Application (2021-2032)
Table 28 South America Food Traceability Revenue (USD Million) By Product (2021-2032)
Table 29 Middle East and Africa Food Traceability Revenue (USD Million) By Type (2021-2032)
Table 30 Middle East and Africa Food Traceability Revenue (USD Million) By Application (2021-2032)
Table 31 Middle East and Africa Food Traceability Revenue (USD Million) By Product (2021-2032)
LIST OF FIGURES
Figure 1. Market Scope
Figure 2. Pricing Forecasts Per Unit, 2023- 2032
Figure 3. Porter’s Five Forces
Figure 4. Global Food Traceability Market Revenue (USD Million) By Regions (2021-2032)
Figure 5. Global Food Traceability Market Share (%) By Regions (2023)
Figure 6. North America Food Traceability Revenue (USD Million) By Country (2021-2032)
Figure 7. United States Food Traceability Revenue (USD Million) By Country (2021-2032)
Figure 8. Canada Food Traceability Revenue (USD Million) By Country (2021-2032)
Figure 9. Mexico Food Traceability Revenue (USD Million) By Country (2021-2032)
Figure 10. Europe Food Traceability Revenue (USD Million) By Country (2021-2032)
Figure 11. Germany Food Traceability Revenue (USD Million) By Country (2021-2032)
Figure 12. France Food Traceability Revenue (USD Million) By Country (2021-2032)
Figure 13. United Kingdom Food Traceability Revenue (USD Million) By Country (2021-2032)
Figure 14. Spain Food Traceability Revenue (USD Million) By Country (2021-2032)
Figure 15. Italy Food Traceability Revenue (USD Million) By Country (2021-2032)
Figure 16. Russia Food Traceability Revenue (USD Million) By Country (2021-2032)
Figure 17. Rest of Europe Food Traceability Revenue (USD Million) By Country (2021-2032)
Figure 11. Asia Pacific Food Traceability Revenue (USD Million) By Country (2021-2032)
Figure 12. China Food Traceability Revenue (USD Million) By Country (2021-2032)
Figure 13. Japan Food Traceability Revenue (USD Million) By Country (2021-2032)
Figure 14. India Food Traceability Revenue (USD Million) By Country (2021-2032)
Figure 15. South Korea Food Traceability Revenue (USD Million) By Country (2021-2032)
Figure 16. Australia Food Traceability Revenue (USD Million) By Country (2021-2032)
Figure 17. South East Asia Food Traceability Revenue (USD Million) By Country (2021-2032)
Figure 18. South America Food Traceability Revenue (USD Million) By Country (2021-2032)
Figure 19. Brazil Food Traceability Revenue (USD Million) By Country (2021-2032)
Figure 20. Argentina Food Traceability Revenue (USD Million) By Country (2021-2032)
Figure 21. Rest of Asia Pacific Food Traceability Revenue (USD Million) By Country (2021-2032)
Figure 22. Middle East and Africa Food Traceability Revenue (USD Million) By Region (2021-2032)
Figure 23. Saudi Arabia Food Traceability Revenue (USD Million) By Region (2021-2032)
Figure 24. The UAE Food Traceability Revenue (USD Million) By Region (2021-2032)
Figure 25. Rest of Middle East Food Traceability Revenue (USD Million) By Region (2021-2032)
Figure 26. South Africa Food Traceability Revenue (USD Million) By Region (2021-2032)
Figure 27. Africa Food Traceability Revenue (USD Million) By Region (2021-2032)
Figure 28. North America Food Traceability Revenue (USD Million) By Type (2021-2032)
Figure 29. North America Food Traceability Revenue (USD Million) By Application (2021-2032)
Figure 30. North America Food Traceability Revenue (USD Million) By Product (2021-2032)
Figure 31. Europe Food Traceability Revenue (USD Million) By Type (2021-2032)
Figure 32. Europe Food Traceability Revenue (USD Million) By Application (2021-2032)
Figure 33. Europe Food Traceability Revenue (USD Million) By Product (2021-2032)
Figure 34. Asia Pacific Food Traceability Revenue (USD Million) By Type (2021-2032)
Figure 35. Asia Pacific Food Traceability Revenue (USD Million) By Application (2021-2032)
Figure 36. Asia Pacific Food Traceability Revenue (USD Million) By Product (2021-2032)
Figure 37. South America Food Traceability Revenue (USD Million) By Type (2021-2032)
Figure 38. South America Food Traceability Revenue (USD Million) By Application (2021-2032)
Figure 39. South America Food Traceability Revenue (USD Million) By Product (2021-2032)
Figure 40. Middle East and Africa Food Traceability Revenue (USD Million) By Type (2021-2032)
Figure 41. Middle East and Africa Food Traceability Revenue (USD Million) By Application (2021-2032)
Figure 42. Middle East and Africa Food Traceability Revenue (USD Million) By Product (2021-2032)
By Type
Radio Frequency Identification
Barcodes
Infrared
Biometrics
Global Positioning Systems
Others
By Software
Enterprise Resources Planning (ERP)
Friction Welding
Laboratory Information Systems
Warehouse Software
Supply Chain Management (SCM)
Others
By End-User
Fruits & Vegetables
Fruit Pulp & Concentrates
Dairy Products
Fish
Meat
Seafood
Processed Food
Bakery & Confectionary
Others
Countries Analyzed
North America (US, Canada, Mexico)
Europe (Germany, UK, France, Spain, Italy, Russia, Rest of Europe)
Asia Pacific (China, India, Japan, South Korea, Australia, South East Asia, Rest of Asia)
South America (Brazil, Argentina, Rest of South America)
Middle East and Africa (Saudi Arabia, UAE, Rest of Middle East, South Africa, Egypt, Rest of Africa)
