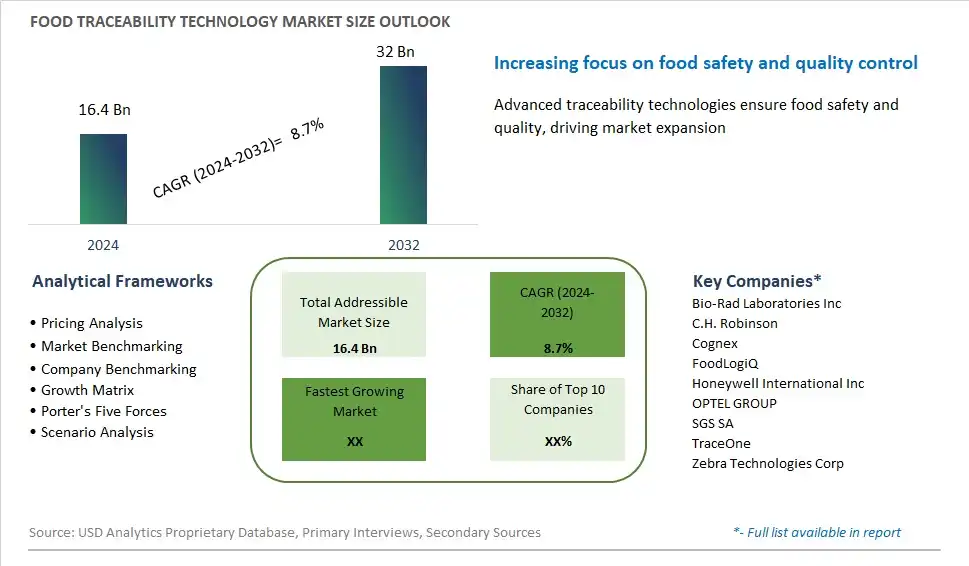
Global Food Traceability Technology Market Size is valued at $16.4 Billion in 2024 and is forecast to register a growth rate (CAGR) of 8.7% to reach $32 Billion by 2032.
The global Food Traceability Technology Market Comprehensive Study analyzes and forecasts the market size across 6 regions and 24 countries for diverse segments -By Technology (Barcoding, RFID (Radio-Frequency Identification)), By Application (Fresh Food, Processed Food, Meat and Poultry), By End-User (Food Manufacturers, Retailers, Logistics and Distribution)
An Introduction to Food Traceability Technology Market
In 2024, the food traceability technology market is witnessing significant growth, propelled by the increasing emphasis on food safety, regulatory compliance, and consumer transparency. Traceability technologies, including blockchain, RFID, IoT sensors, and data analytics, are essential for tracking and verifying the journey of food products from farm to fork. These technologies enhance supply chain visibility, mitigate risks of contamination and fraud, and ensure compliance with safety standards. The market benefits from the growing consumer demand for transparency and the assurance of food quality and origin. Innovations in traceability solutions, such as real-time tracking and predictive analytics, are further driving market growth. As the food industry adapts to stricter regulations and evolving consumer expectations, the adoption of advanced traceability technologies is set to increase, driving market expansion and innovation.
Food Traceability Technology Competitive Landscape
The market report analyses the leading companies in the industry including Bio-Rad Laboratories Inc, C.H. Robinson, Cognex, FoodLogiQ, Honeywell International Inc, OPTEL GROUP, SGS SA, TraceOne, Zebra Technologies Corp, and Others.
Food Traceability Technology Market Dynamics
Food Traceability Technology Market Trend: Adoption of Blockchain for Enhanced Traceability
A prominent trend in the food traceability technology market is the increasing adoption of blockchain technology for enhanced traceability throughout the food supply chain. Blockchain offers a decentralized, immutable ledger that records transactions and data exchanges in a secure and transparent manner, enabling stakeholders to track the journey of food products from farm to fork. This trend is driven by the need for greater transparency, trust, and accountability in food supply chains, as well as regulatory requirements and consumer demand for safe and authentic food products. Blockchain-based traceability solutions provide end-to-end visibility, enabling rapid identification and trace-back of potentially unsafe products in the event of food safety incidents or recalls. As stakeholders seek to improve traceability standards and practices, the adoption of blockchain technology is expected to grow, driving market expansion and innovation in food traceability technologies.
Market Driver: Regulatory Mandates and Consumer Demand for Transparency
An essential driver fueling the food traceability technology market is regulatory mandates and consumer demand for transparency in food supply chains. With increasing concerns about food safety, authenticity, and sustainability, governments, industry organizations, and consumers are pushing for stricter regulations and standards for traceability and labeling of food products. This driver is reinforced by high-profile foodborne illness outbreaks, contamination incidents, and food fraud cases that highlight the need for robust traceability systems to protect public health and ensure food quality. Additionally, consumers are becoming more informed and conscious about the origin, production methods, and ethical considerations associated with the foods they consume, driving demand for transparent and traceable food products. As regulatory requirements continue to evolve and consumer expectations for food transparency increase, the demand for advanced traceability technologies that enable end-to-end visibility, accountability, and trustworthiness in food supply chains is expected to rise, creating opportunities for technology providers to offer innovative solutions that meet the needs of the food industry.
Market Opportunity: Integration of IoT and Data Analytics for Predictive Traceability
A significant opportunity within the food traceability technology market lies in the integration of IoT (Internet of Things) devices and data analytics for predictive traceability capabilities. Beyond traditional traceability systems based on batch tracking and barcode labeling, there's potential to leverage IoT sensors, RFID (Radio Frequency Identification) tags, and data analytics platforms to capture real-time data on environmental conditions, product movement, and quality parameters throughout the supply chain. By collecting and analyzing large volumes of data, companies can gain insights into potential risks, vulnerabilities, and quality issues in their supply chains, enabling proactive risk management, quality control, and decision support for traceability. Additionally, predictive analytics algorithms can forecast and mitigate food safety risks, supply chain disruptions, and quality deviations before they escalate into larger issues or incidents. By integrating IoT and data analytics technologies into traceability solutions, providers can offer advanced functionalities such as predictive traceability, real-time monitoring, and supply chain optimization, thereby enhancing the value proposition and competitive advantage of their offerings in the food traceability market.
Food Traceability Technology Market Share Analysis: Barcoding held the dominant market share in 2024
In the Food Traceability Technology Market, the Barcoding segment is the largest due to its simplicity, affordability, and widespread adoption across the food industry. Barcoding technology offers a cost-effective solution for tracking and tracing food products throughout the supply chain, enabling efficient inventory management, accurate labeling, and rapid identification of products at various stages of production and distribution. Further, barcodes are universally recognized and easily scanned using handheld devices, making them accessible to food companies of all sizes. Additionally, advancements in barcode technology, such as 2D barcodes and QR codes, provide enhanced data storage capabilities and enable consumers to access detailed product information with a simple scan. As food companies prioritize compliance with food safety regulations and meet consumer demands for transparency, the Barcoding technology segment continues to dominate the food traceability technology market.
Food Traceability Technology Market Share Analysis: Fresh Food market is poised to register the fastest growth rae over the forecast period to 2032
In the Food Traceability Technology Market, the Fresh Food segment is the fastest growing, driven by increasing consumer demand for transparency, safety, and quality assurance in perishable food products. With growing concerns over foodborne illnesses and food fraud incidents, consumers are increasingly seeking assurances regarding the origin, handling, and freshness of fresh food items such as fruits, vegetables, and seafood. Consequently, food retailers, distributors, and producers are investing in traceability technologies to track the entire journey of fresh food products from farm to table. These technologies enable real-time monitoring of temperature and environmental conditions during transportation and storage, ensuring compliance with food safety standards and minimizing the risk of spoilage or contamination. As regulatory bodies impose stricter requirements on traceability in the fresh food supply chain, the Fresh Food segment is experiencing rapid growth in the food traceability technology market.
Food Traceability Technology Market Share Analysis: Food Manufacturers held the dominant market share in 2024
In the Food Traceability Technology Market, the Food Manufacturers segment stands as the largest, propelled by stringent regulations, heightened consumer expectations, and the need for efficient supply chain management. Food manufacturers are under increasing pressure to ensure the safety, quality, and integrity of their products, from sourcing raw materials to delivering finished goods to consumers. As such, they heavily rely on traceability technologies to track and monitor ingredients, production processes, and distribution channels. Additionally, as regulatory bodies impose stricter requirements for traceability and transparency, food manufacturers invest in advanced traceability systems to comply with these standards and mitigate the risk of food safety incidents or product recalls. Further, traceability technologies enable manufacturers to enhance operational efficiency, optimize inventory management, and improve overall product quality, solidifying the Food Manufacturers segment as the largest in the food traceability technology market.
Food Traceability Technology Market Segmentation
By Technology
Barcoding
RFID (Radio-Frequency Identification)
By Application
Fresh Food
Processed Food
Meat and Poultry
By End-User
Food Manufacturers
Retailers
Logistics and Distribution
Countries Analyzed
North America (US, Canada, Mexico)
Europe (Germany, UK, France, Spain, Italy, Russia, Rest of Europe)
Asia Pacific (China, India, Japan, South Korea, Australia, South East Asia, Rest of Asia)
South America (Brazil, Argentina, Rest of South America)
Middle East and Africa (Saudi Arabia, UAE, Rest of Middle East, South Africa, Egypt, Rest of Africa)
Food Traceability Technology Companies Profiled in the Study
Bio-Rad Laboratories Inc
C.H. Robinson
Cognex
FoodLogiQ
Honeywell International Inc
OPTEL GROUP
SGS SA
TraceOne
Zebra Technologies Corp
*- List Not Exhaustive
Chapter 1. TABLE OF CONTENTS
Chapter 2. Introduction to Food Traceability Technology Market
2.1. Market Overview
2.2. Key Statistics and Report Highlights
2.3. Scope of the Comprehensive Study
2.3.1. Market Definition
2.3.2 Countries and Regions Covered
2.3.3 Research Objective
2.3.4 Units, Currency, and Conversions
2.3.5 Industry Value Chain
2.4. Key Market Segments
2.5. Key Companies
2.6. Study Period
Chapter 3. Strategic Analysis Review
3.1. Food Traceability Technology Pricing Analysis and Forecast
3.2. Porter’s Five Forces
3.3. Market Ecosystem
3.4. SWOT Analysis
3.5. Regulatory Scenario
3.3. Effects of Inflation, Russia-Ukraine War, moderating economic growth, and other macroeconomic factors
Chapter 4. Competitive Landscape
4.1. Market Share Analysis
4.1.1. Global Food Traceability Technology Market Share by Company, 2023
4.1.2. Product Offerings of Leading Food Traceability Technology Companies
4.2. Market Entropy
4.2.1. New Product Launches in the Industry
4.2.2. Mergers, Acquisitions, Joint ventures, and Partnerships
4.3. Key Strategies and Best Practices
Chapter 5. Global Market Projections: Best, Reference, and Low Case Scenarios
5.1. Growth Analysis- Case Scenario Definitions
5.2. Low Growth Case Scenario Forecasts
5.3. Reference Growth Case Scenario Forecasts
5.4. High Growth Case Scenario Forecasts
Chapter 6. Market Dynamics
6.1. Food Traceability Technology Market Drivers
6.2. Food Traceability Technology Market Challenges
6.6. Food Traceability Technology Market Opportunities
6.4. Food Traceability Technology Market Trends
Chapter 7. Global Food Traceability Technology Market Outlook Trends
7.1. Global Food Traceability Technology Revenue (USD Million) and CAGR (%) by Type (2021-2032)
7.2. Global Food Traceability Technology Revenue (USD Million) and CAGR (%) by Application (2021-2032)
7.3. Global Food Traceability Technology Revenue (USD Million) and CAGR (%) by Product (2021-2032)
By Technology
Barcoding
RFID (Radio-Frequency Identification)
By Application
Fresh Food
Processed Food
Meat and Poultry
By End-User
Food Manufacturers
Retailers
Logistics and Distribution
Chapter 8. Global Food Traceability Technology Regional Analysis and Outlook
8.1. Global Food Traceability Technology Revenue (USD Million) By Regions (2021- 2032)
8.2. North America Food Traceability Technology Revenue (USD Million) by Country (2021-2032)
8.2.1. United States Food Traceability Technology Regional Analysis and Outlook
8.2.2. Canada Food Traceability Technology Regional Analysis and Outlook
8.2.3. Mexico Food Traceability Technology Regional Analysis and Outlook
8.3. Europe Food Traceability Technology Revenue (USD Million), by Country (2021-2032)
8.3.1. Germany Food Traceability Technology Regional Analysis and Outlook
8.3.2. France Food Traceability Technology Regional Analysis and Outlook
8.3.3. United Kingdom Food Traceability Technology Regional Analysis and Outlook
8.3.4. Spain Food Traceability Technology Regional Analysis and Outlook
8.3.5. Italy Food Traceability Technology Regional Analysis and Outlook
8.3.6. Russia Food Traceability Technology Regional Analysis and Outlook
8.3.7. Rest of Europe Food Traceability Technology Regional Analysis and Outlook
8.4. Asia Pacific Food Traceability Technology Revenue (USD Million) by Country (2021-2032)
8.4.1. China Food Traceability Technology Regional Analysis and Outlook
8.4.2. Japan Food Traceability Technology Regional Analysis and Outlook
8.4.3. India Food Traceability Technology Regional Analysis and Outlook
8.4.4. South Korea Food Traceability Technology Regional Analysis and Outlook
8.4.5. Australia Food Traceability Technology Regional Analysis and Outlook
8.4.6. South East Asia Food Traceability Technology Regional Analysis and Outlook
8.4.7. Rest of Asia Pacific Food Traceability Technology Regional Analysis and Outlook
8.5. South America Food Traceability Technology Revenue (USD Million), by Country (2021-2032)
8.5.1. Brazil Food Traceability Technology Regional Analysis and Outlook
8.5.2. Argentina Food Traceability Technology Regional Analysis and Outlook
8.5.3. Rest of South America Food Traceability Technology Regional Analysis and Outlook
8.6. Middle East and Africa Food Traceability Technology Revenue (USD Million) by Country (2021-2032)
8.6.1. Middle East Food Traceability Technology Regional Analysis and Outlook
8.6.2. Africa Food Traceability Technology Regional Analysis and Outlook
Chapter 9. North America Food Traceability Technology Analysis and Outlook
9.1. North America Food Traceability Technology Revenue (USD Million) by Segments (2021-2032)
9.1.1. North America Food Traceability Technology Revenue (USD Million) by Type (2021-2032)
9.1.2. North America Food Traceability Technology Revenue (USD Million) by Application (2021-2032)
9.1.3. North America Food Traceability Technology Revenue (USD Million) by Product (2021-2032)
By Technology
Barcoding
RFID (Radio-Frequency Identification)
By Application
Fresh Food
Processed Food
Meat and Poultry
By End-User
Food Manufacturers
Retailers
Logistics and Distribution
Chapter 10. Europe Food Traceability Technology Analysis and Outlook
10.1. Europe Food Traceability Technology Revenue (USD Million), by Segments (USD Million) (2021-2032)
10.1.1. Europe Food Traceability Technology Revenue (USD Million) by Type (2021-2032)
10.1.2. Europe Food Traceability Technology Revenue (USD Million) by Application (2021-2032)
10.1.3. Europe Food Traceability Technology Revenue (USD Million) by Product (2021-2032)
By Technology
Barcoding
RFID (Radio-Frequency Identification)
By Application
Fresh Food
Processed Food
Meat and Poultry
By End-User
Food Manufacturers
Retailers
Logistics and Distribution
Chapter 11. Asia Pacific Food Traceability Technology Analysis and Outlook
11.1. Asia Pacific Food Traceability Technology Revenue (USD Million), and Revenue (USD Million) by Segments (2021-2032)
11.1.1. Asia Pacific Food Traceability Technology Revenue (USD Million) by Type (2021-2032)
11.1.2. Asia Pacific Food Traceability Technology Revenue (USD Million) by Application (2021-2032)
11.1.3. Asia Pacific Food Traceability Technology Revenue (USD Million) by Product (2021-2032)
By Technology
Barcoding
RFID (Radio-Frequency Identification)
By Application
Fresh Food
Processed Food
Meat and Poultry
By End-User
Food Manufacturers
Retailers
Logistics and Distribution
Chapter 12. South America Food Traceability Technology Analysis and Outlook
12.1. South America Food Traceability Technology Revenue (USD Million), by Segments (2021-2032)
12.1.1. South America Food Traceability Technology Revenue (USD Million) by Type (2021-2032)
12.1.2. South America Food Traceability Technology Revenue (USD Million) by Application (2021-2032)
12.1.3. South America Food Traceability Technology Revenue (USD Million) by Product (2021-2032)
By Technology
Barcoding
RFID (Radio-Frequency Identification)
By Application
Fresh Food
Processed Food
Meat and Poultry
By End-User
Food Manufacturers
Retailers
Logistics and Distribution
Chapter 13. Middle East and Africa Food Traceability Technology Analysis and Outlook
13.1. Middle East and Africa Food Traceability Technology Revenue (USD Million), by Segments (2021-2032)
13.1.1. Middle East and Africa Food Traceability Technology Revenue (USD Million) by Type (2021-2032)
13.1.2. Middle East and Africa Food Traceability Technology Revenue (USD Million) by Application (2021-2032)
13.1.3. Middle East and Africa Food Traceability Technology Revenue (USD Million) by Product (2021-2032)
By Technology
Barcoding
RFID (Radio-Frequency Identification)
By Application
Fresh Food
Processed Food
Meat and Poultry
By End-User
Food Manufacturers
Retailers
Logistics and Distribution
Chapter 14. Food Traceability Technology Company Profiles
14.1 Business Overview
14.2 Product Profiles
14.3 SWOT Profiles
14.5 Recent Developments
14.6 Financial Profile
List of Companies
Bio-Rad Laboratories Inc
C.H. Robinson
Cognex
FoodLogiQ
Honeywell International Inc
OPTEL GROUP
SGS SA
TraceOne
Zebra Technologies Corp
15. Methodology and Data Sources
15.1 Customization Offerings
15.2 Subscription Services
15.3 Related Reports
15.4 Publisher Expertise
LIST OF TABLES
Table 1 Market Segmentation Analysis
Table 2 Global Food Traceability Technology Market Share of Leading Companies, 2023
Table 3 Product Offerings of Leading Companies
Table 4 Low Growth Scenario Forecasts
Table 5 Reference Case Growth Scenario
Table 6 High Growth Case Scenario
Table 7 Global Food Traceability Technology Revenue (USD Million) And CAGR (%) By Type (2021-2032)
Table 8 Global Food Traceability Technology Revenue (USD Million) And CAGR (%) By Application (2021-2032)
Table 9 Global Food Traceability Technology Revenue (USD Million) And CAGR (%) By Product (2021-2032)
Table 10 Global Food Traceability Technology Market Revenue (USD Million) By Regions (2021-2032)
Table 11 Global Food Traceability Technology Market Share (%) By Regions (2021-2032)
Table 12 North America Food Traceability Technology Revenue (USD Million) By Country (2021-2032)
Table 13 Europe Food Traceability Technology Revenue (USD Million) By Country (2021-2032)
Table 14 Asia Pacific Food Traceability Technology Revenue (USD Million) By Country (2021-2032)
Table 15 South America Food Traceability Technology Revenue (USD Million) By Country (2021-2032)
Table 16 Middle East and Africa Food Traceability Technology Revenue (USD Million) By Region (2021-2032)
Table 17 North America Food Traceability Technology Revenue (USD Million) By Type (2021-2032)
Table 18 North America Food Traceability Technology Revenue (USD Million) By Application (2021-2032)
Table 19 North America Food Traceability Technology Revenue (USD Million) By Product (2021-2032)
Table 20 Europe Food Traceability Technology Revenue (USD Million) By Type (2021-2032)
Table 21 Europe Food Traceability Technology Revenue (USD Million) By Application (2021-2032)
Table 22 Europe Food Traceability Technology Revenue (USD Million) By Product (2021-2032)
Table 23 Asia Pacific Food Traceability Technology Revenue (USD Million) By Type (2021-2032)
Table 24 Asia Pacific Food Traceability Technology Revenue (USD Million) By Application (2021-2032)
Table 25 Asia Pacific Food Traceability Technology Revenue (USD Million) By Product (2021-2032)
Table 26 South America Food Traceability Technology Revenue (USD Million) By Type (2021-2032)
Table 27 South America Food Traceability Technology Revenue (USD Million) By Application (2021-2032)
Table 28 South America Food Traceability Technology Revenue (USD Million) By Product (2021-2032)
Table 29 Middle East and Africa Food Traceability Technology Revenue (USD Million) By Type (2021-2032)
Table 30 Middle East and Africa Food Traceability Technology Revenue (USD Million) By Application (2021-2032)
Table 31 Middle East and Africa Food Traceability Technology Revenue (USD Million) By Product (2021-2032)
LIST OF FIGURES
Figure 1. Market Scope
Figure 2. Pricing Forecasts Per Unit, 2023- 2032
Figure 3. Porter’s Five Forces
Figure 4. Global Food Traceability Technology Market Revenue (USD Million) By Regions (2021-2032)
Figure 5. Global Food Traceability Technology Market Share (%) By Regions (2023)
Figure 6. North America Food Traceability Technology Revenue (USD Million) By Country (2021-2032)
Figure 7. United States Food Traceability Technology Revenue (USD Million) By Country (2021-2032)
Figure 8. Canada Food Traceability Technology Revenue (USD Million) By Country (2021-2032)
Figure 9. Mexico Food Traceability Technology Revenue (USD Million) By Country (2021-2032)
Figure 10. Europe Food Traceability Technology Revenue (USD Million) By Country (2021-2032)
Figure 11. Germany Food Traceability Technology Revenue (USD Million) By Country (2021-2032)
Figure 12. France Food Traceability Technology Revenue (USD Million) By Country (2021-2032)
Figure 13. United Kingdom Food Traceability Technology Revenue (USD Million) By Country (2021-2032)
Figure 14. Spain Food Traceability Technology Revenue (USD Million) By Country (2021-2032)
Figure 15. Italy Food Traceability Technology Revenue (USD Million) By Country (2021-2032)
Figure 16. Russia Food Traceability Technology Revenue (USD Million) By Country (2021-2032)
Figure 17. Rest of Europe Food Traceability Technology Revenue (USD Million) By Country (2021-2032)
Figure 11. Asia Pacific Food Traceability Technology Revenue (USD Million) By Country (2021-2032)
Figure 12. China Food Traceability Technology Revenue (USD Million) By Country (2021-2032)
Figure 13. Japan Food Traceability Technology Revenue (USD Million) By Country (2021-2032)
Figure 14. India Food Traceability Technology Revenue (USD Million) By Country (2021-2032)
Figure 15. South Korea Food Traceability Technology Revenue (USD Million) By Country (2021-2032)
Figure 16. Australia Food Traceability Technology Revenue (USD Million) By Country (2021-2032)
Figure 17. South East Asia Food Traceability Technology Revenue (USD Million) By Country (2021-2032)
Figure 18. South America Food Traceability Technology Revenue (USD Million) By Country (2021-2032)
Figure 19. Brazil Food Traceability Technology Revenue (USD Million) By Country (2021-2032)
Figure 20. Argentina Food Traceability Technology Revenue (USD Million) By Country (2021-2032)
Figure 21. Rest of Asia Pacific Food Traceability Technology Revenue (USD Million) By Country (2021-2032)
Figure 22. Middle East and Africa Food Traceability Technology Revenue (USD Million) By Region (2021-2032)
Figure 23. Saudi Arabia Food Traceability Technology Revenue (USD Million) By Region (2021-2032)
Figure 24. The UAE Food Traceability Technology Revenue (USD Million) By Region (2021-2032)
Figure 25. Rest of Middle East Food Traceability Technology Revenue (USD Million) By Region (2021-2032)
Figure 26. South Africa Food Traceability Technology Revenue (USD Million) By Region (2021-2032)
Figure 27. Africa Food Traceability Technology Revenue (USD Million) By Region (2021-2032)
Figure 28. North America Food Traceability Technology Revenue (USD Million) By Type (2021-2032)
Figure 29. North America Food Traceability Technology Revenue (USD Million) By Application (2021-2032)
Figure 30. North America Food Traceability Technology Revenue (USD Million) By Product (2021-2032)
Figure 31. Europe Food Traceability Technology Revenue (USD Million) By Type (2021-2032)
Figure 32. Europe Food Traceability Technology Revenue (USD Million) By Application (2021-2032)
Figure 33. Europe Food Traceability Technology Revenue (USD Million) By Product (2021-2032)
Figure 34. Asia Pacific Food Traceability Technology Revenue (USD Million) By Type (2021-2032)
Figure 35. Asia Pacific Food Traceability Technology Revenue (USD Million) By Application (2021-2032)
Figure 36. Asia Pacific Food Traceability Technology Revenue (USD Million) By Product (2021-2032)
Figure 37. South America Food Traceability Technology Revenue (USD Million) By Type (2021-2032)
Figure 38. South America Food Traceability Technology Revenue (USD Million) By Application (2021-2032)
Figure 39. South America Food Traceability Technology Revenue (USD Million) By Product (2021-2032)
Figure 40. Middle East and Africa Food Traceability Technology Revenue (USD Million) By Type (2021-2032)
Figure 41. Middle East and Africa Food Traceability Technology Revenue (USD Million) By Application (2021-2032)
Figure 42. Middle East and Africa Food Traceability Technology Revenue (USD Million) By Product (2021-2032)
By Technology
Barcoding
RFID (Radio-Frequency Identification)
By Application
Fresh Food
Processed Food
Meat and Poultry
By End-User
Food Manufacturers
Retailers
Logistics and Distribution
Countries Analyzed
North America (US, Canada, Mexico)
Europe (Germany, UK, France, Spain, Italy, Russia, Rest of Europe)
Asia Pacific (China, India, Japan, South Korea, Australia, South East Asia, Rest of Asia)
South America (Brazil, Argentina, Rest of South America)
Middle East and Africa (Saudi Arabia, UAE, Rest of Middle East, South Africa, Egypt, Rest of Africa)
