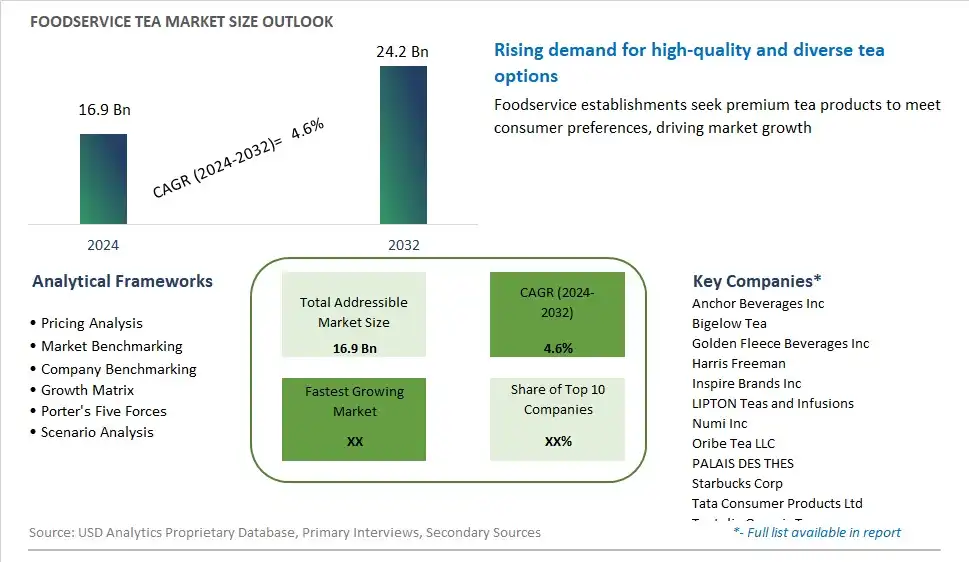
Global Foodservice Tea Market Size is valued at $16.9 Billion in 2024 and is forecast to register a growth rate (CAGR) of 4.6% to reach $24.2 Billion by 2032.
The global Foodservice Tea Market Comprehensive Study analyzes and forecasts the market size across 6 regions and 24 countries for diverse segments -By Product (Black Tea, Green Tea, Others), By Type (Iced Tea and Hot Tea), By Distribution Channel (Full-Service Restaurants, Quick Service Restaurants, Others)
An Introduction to Foodservice Tea Market
The foodservice tea market is experiencing growth and diversification in 2024, driven by changing consumer preferences, culinary trends, and the rising popularity of tea as a versatile and healthful beverage option. Tea has long been valued for its refreshing taste, antioxidant properties, and potential health benefits, making it a staple in cultures around the world. In the foodservice sector, tea plays a vital role in a variety of settings, including restaurants, cafes, hotels, and catering services, where it is served hot or cold, plain or flavored, and accompanied by a range of accompaniments such as milk, sugar, and spices. With the growing interest in specialty and artisanal teas, foodservice operators are expanding their tea offerings to include a diverse selection of loose-leaf teas, herbal blends, and tea-based beverages. Moreover, there is a trend towards premiumization and customization, with consumers seeking unique tea experiences that reflect their individual tastes and preferences. As tea continues to gain traction as a versatile and healthful beverage option, the foodservice tea market is poised for continued growth and innovation, offering opportunities for culinary creativity and consumer engagement.
Foodservice Tea Competitive Landscape
The market report analyses the leading companies in the industry including Anchor Beverages Inc, Bigelow Tea, Golden Fleece Beverages Inc, Harris Freeman, Inspire Brands Inc, LIPTON Teas and Infusions, Numi Inc, Oribe Tea LLC, PALAIS DES THES, Starbucks Corp, Tata Consumer Products Ltd, Teatulia Organic Teas, and Others.
Foodservice Tea Market Dynamics
Foodservice Tea Market Trend: Growing Demand for Specialty and Artisanal Tea Offerings
A prominent trend in the foodservice tea market is the growing demand for specialty and artisanal tea offerings, driven by evolving consumer preferences for premium, high-quality beverages and unique flavor experiences. Consumers are increasingly seeking out diverse tea varieties, including loose-leaf teas, herbal blends, exotic infusions, and specialty tea-based beverages such as matcha lattes and bubble teas. This trend reflects a shift towards experiential dining and the desire for customized, handcrafted beverages that offer depth of flavor, authenticity, and health benefits. Moreover, the rising popularity of tea culture, wellness-focused lifestyles, and social media influence have contributed to the proliferation of specialty tea establishments, tea lounges, and tea-centric cafes, catering to tea enthusiasts seeking elevated tea-drinking experiences and community engagement.
Market Driver: Health and Wellness Trends Driving Tea Consumption
A key driver of the foodservice tea market is the influence of health and wellness trends driving tea consumption, fueled by growing awareness of the health benefits associated with tea consumption and the desire for functional beverages. Tea is renowned for its antioxidant properties, potential health-promoting effects, and versatility in addressing various wellness needs, including relaxation, hydration, digestion, and immunity support. As consumers seek alternatives to sugary beverages and caffeinated drinks, tea emerges as a preferred choice due to its natural ingredients, low calorie content, and diverse flavor options. Furthermore, the popularity of tea-based detox programs, wellness rituals, and functional tea blends has fueled demand for tea offerings in foodservice establishments, as consumers prioritize holistic approaches to health and seek out venues that offer health-conscious beverage options.
Market Opportunity: Expansion into Innovative Tea-Based Culinary Applications
An opportunity for growth in the foodservice tea market lies in the expansion into innovative tea-based culinary applications, leveraging tea's versatility as a flavoring agent and ingredient in savory and sweet dishes. While tea is traditionally consumed as a beverage, there's potential to incorporate tea flavors and infusions into food menu items such as sauces, marinades, desserts, and cocktails, offering unique culinary experiences and cross-category innovation. For example, tea-infused sauces can add depth of flavor to meat and seafood dishes, while tea-infused desserts like tea-flavored ice creams, cakes, and pastries appeal to consumers seeking novel taste sensations. Additionally, tea-based cocktails and mocktails provide opportunities for mixologists and beverage developers to showcase tea's complexity, aroma, and botanical notes in creative beverage creations. By exploring innovative culinary applications and menu concepts that incorporate tea, foodservice establishments can differentiate their offerings, attract tea enthusiasts, and capitalize on the growing demand for tea-infused culinary experiences in the dining landscape.
Foodservice Tea Market Share Analysis: Black Tea held the dominant market share in 2024
In the Foodservice Tea Market, the Black Tea segment is the largest segment due to several factors driving its dominance. Black tea, renowned for its bold flavor and rich aroma, holds widespread popularity among consumers worldwide, making it a staple in foodservice establishments. Its versatility allows for various brewing methods and flavor profiles, catering to diverse preferences and culinary traditions. Further, black tea is commonly served as a hot or iced beverage, making it suitable for consumption throughout the day and in different seasons. Additionally, the strong presence of black tea in traditional tea cultures, such as those in China, India, and the United Kingdom, further contributes to its dominance in the market. Furthermore, the availability of a wide range of black tea blends, including classic blends, flavored teas, and specialty varieties, ensures continuous consumer interest and market demand. Consequently, the Black Tea segment maintains its leadership position in the Foodservice Tea Market, driven by its widespread acceptance, versatility, and enduring popularity among consumers and foodservice establishments alike.
Foodservice Tea Market Share Analysis: Iced Tea market is poised to register the fastest growth rae over the forecast period to 2032
In the Foodservice Tea Market, the Iced Tea segment is the fastest-growing segment due to several factors propelling its rapid expansion. Iced tea has gained immense popularity among consumers, driven by its refreshing taste, versatility, and perceived health benefits. With consumers increasingly seeking healthier beverage options and alternatives to sugary sodas, iced tea offers a flavorful and hydrating choice, particularly during hot weather or as a refreshing accompaniment to meals. Further, the convenience of ready-to-drink iced tea options and the availability of a wide range of flavor varieties appeal to consumers seeking on-the-go refreshment. Additionally, the rising trend of customization and premiumization in the beverage industry has led to the introduction of artisanal and specialty iced tea blends, further fueling consumer interest and driving market growth. Furthermore, the expansion of foodservice outlets, including cafes, restaurants, and fast-food chains, offering iced tea as a menu staple, contributes to the segment's rapid expansion. Consequently, the Iced Tea segment is poised for robust growth, driven by its refreshing taste, health-conscious appeal, and increasing availability across diverse foodservice establishments.
Foodservice Tea Market Share Analysis: Quick Service Restaurants (QSR) held the dominant market share in 2024
In the Foodservice Tea Market, the Quick Service Restaurants (QSR) segment is the largest due to several factors driving its dominance. QSRs, known for their fast-paced service and convenience, cater to a wide demographic range of consumers seeking quick and affordable dining options. Tea is a popular beverage choice in QSRs due to its versatility, serving as both a refreshing accompaniment to meals and a standalone beverage option. Further, QSRs often offer a variety of tea options, including traditional hot tea and iced tea, to cater to diverse consumer preferences. Additionally, the efficiency and streamlined operations of QSRs enable them to serve tea quickly and efficiently, enhancing the overall dining experience for customers. Furthermore, the widespread presence of QSRs in urban and suburban areas, coupled with their extensive marketing and promotional efforts, further solidifies their dominance in the foodservice tea market. Consequently, the Quick Service Restaurants segment maintains its leadership position, driven by its accessibility, affordability, and ability to cater to the on-the-go lifestyle of consumers.
Foodservice Tea Market Segmentation
By Product
Black Tea
Green Tea
Others
By Type
Iced Tea and Hot Tea
By Distribution Channel
Full-Service Restaurants
Quick Service Restaurants
Others
Countries Analyzed
North America (US, Canada, Mexico)
Europe (Germany, UK, France, Spain, Italy, Russia, Rest of Europe)
Asia Pacific (China, India, Japan, South Korea, Australia, South East Asia, Rest of Asia)
South America (Brazil, Argentina, Rest of South America)
Middle East and Africa (Saudi Arabia, UAE, Rest of Middle East, South Africa, Egypt, Rest of Africa)
Foodservice Tea Companies Profiled in the Study
Anchor Beverages Inc
Bigelow Tea
Golden Fleece Beverages Inc
Harris Freeman
Inspire Brands Inc
LIPTON Teas and Infusions
Numi Inc
Oribe Tea LLC
PALAIS DES THES
Starbucks Corp
Tata Consumer Products Ltd
Teatulia Organic Teas
*- List Not Exhaustive
Chapter 1. TABLE OF CONTENTS
Chapter 2. Introduction to Foodservice Tea Market
2.1. Market Overview
2.2. Key Statistics and Report Highlights
2.3. Scope of the Comprehensive Study
2.3.1. Market Definition
2.3.2 Countries and Regions Covered
2.3.3 Research Objective
2.3.4 Units, Currency, and Conversions
2.3.5 Industry Value Chain
2.4. Key Market Segments
2.5. Key Companies
2.6. Study Period
Chapter 3. Strategic Analysis Review
3.1. Foodservice Tea Pricing Analysis and Forecast
3.2. Porter’s Five Forces
3.3. Market Ecosystem
3.4. SWOT Analysis
3.5. Regulatory Scenario
3.3. Effects of Inflation, Russia-Ukraine War, moderating economic growth, and other macroeconomic factors
Chapter 4. Competitive Landscape
4.1. Market Share Analysis
4.1.1. Global Foodservice Tea Market Share by Company, 2023
4.1.2. Product Offerings of Leading Foodservice Tea Companies
4.2. Market Entropy
4.2.1. New Product Launches in the Industry
4.2.2. Mergers, Acquisitions, Joint ventures, and Partnerships
4.3. Key Strategies and Best Practices
Chapter 5. Global Market Projections: Best, Reference, and Low Case Scenarios
5.1. Growth Analysis- Case Scenario Definitions
5.2. Low Growth Case Scenario Forecasts
5.3. Reference Growth Case Scenario Forecasts
5.4. High Growth Case Scenario Forecasts
Chapter 6. Market Dynamics
6.1. Foodservice Tea Market Drivers
6.2. Foodservice Tea Market Challenges
6.6. Foodservice Tea Market Opportunities
6.4. Foodservice Tea Market Trends
Chapter 7. Global Foodservice Tea Market Outlook Trends
7.1. Global Foodservice Tea Revenue (USD Million) and CAGR (%) by Type (2021-2032)
7.2. Global Foodservice Tea Revenue (USD Million) and CAGR (%) by Application (2021-2032)
7.3. Global Foodservice Tea Revenue (USD Million) and CAGR (%) by Product (2021-2032)
By Product
Black Tea
Green Tea
Others
By Type
Iced Tea and Hot Tea
By Distribution Channel
Full-Service Restaurants
Quick Service Restaurants
Others
Chapter 8. Global Foodservice Tea Regional Analysis and Outlook
8.1. Global Foodservice Tea Revenue (USD Million) By Regions (2021- 2032)
8.2. North America Foodservice Tea Revenue (USD Million) by Country (2021-2032)
8.2.1. United States Foodservice Tea Regional Analysis and Outlook
8.2.2. Canada Foodservice Tea Regional Analysis and Outlook
8.2.3. Mexico Foodservice Tea Regional Analysis and Outlook
8.3. Europe Foodservice Tea Revenue (USD Million), by Country (2021-2032)
8.3.1. Germany Foodservice Tea Regional Analysis and Outlook
8.3.2. France Foodservice Tea Regional Analysis and Outlook
8.3.3. United Kingdom Foodservice Tea Regional Analysis and Outlook
8.3.4. Spain Foodservice Tea Regional Analysis and Outlook
8.3.5. Italy Foodservice Tea Regional Analysis and Outlook
8.3.6. Russia Foodservice Tea Regional Analysis and Outlook
8.3.7. Rest of Europe Foodservice Tea Regional Analysis and Outlook
8.4. Asia Pacific Foodservice Tea Revenue (USD Million) by Country (2021-2032)
8.4.1. China Foodservice Tea Regional Analysis and Outlook
8.4.2. Japan Foodservice Tea Regional Analysis and Outlook
8.4.3. India Foodservice Tea Regional Analysis and Outlook
8.4.4. South Korea Foodservice Tea Regional Analysis and Outlook
8.4.5. Australia Foodservice Tea Regional Analysis and Outlook
8.4.6. South East Asia Foodservice Tea Regional Analysis and Outlook
8.4.7. Rest of Asia Pacific Foodservice Tea Regional Analysis and Outlook
8.5. South America Foodservice Tea Revenue (USD Million), by Country (2021-2032)
8.5.1. Brazil Foodservice Tea Regional Analysis and Outlook
8.5.2. Argentina Foodservice Tea Regional Analysis and Outlook
8.5.3. Rest of South America Foodservice Tea Regional Analysis and Outlook
8.6. Middle East and Africa Foodservice Tea Revenue (USD Million) by Country (2021-2032)
8.6.1. Middle East Foodservice Tea Regional Analysis and Outlook
8.6.2. Africa Foodservice Tea Regional Analysis and Outlook
Chapter 9. North America Foodservice Tea Analysis and Outlook
9.1. North America Foodservice Tea Revenue (USD Million) by Segments (2021-2032)
9.1.1. North America Foodservice Tea Revenue (USD Million) by Type (2021-2032)
9.1.2. North America Foodservice Tea Revenue (USD Million) by Application (2021-2032)
9.1.3. North America Foodservice Tea Revenue (USD Million) by Product (2021-2032)
By Product
Black Tea
Green Tea
Others
By Type
Iced Tea and Hot Tea
By Distribution Channel
Full-Service Restaurants
Quick Service Restaurants
Others
Chapter 10. Europe Foodservice Tea Analysis and Outlook
10.1. Europe Foodservice Tea Revenue (USD Million), by Segments (USD Million) (2021-2032)
10.1.1. Europe Foodservice Tea Revenue (USD Million) by Type (2021-2032)
10.1.2. Europe Foodservice Tea Revenue (USD Million) by Application (2021-2032)
10.1.3. Europe Foodservice Tea Revenue (USD Million) by Product (2021-2032)
By Product
Black Tea
Green Tea
Others
By Type
Iced Tea and Hot Tea
By Distribution Channel
Full-Service Restaurants
Quick Service Restaurants
Others
Chapter 11. Asia Pacific Foodservice Tea Analysis and Outlook
11.1. Asia Pacific Foodservice Tea Revenue (USD Million), and Revenue (USD Million) by Segments (2021-2032)
11.1.1. Asia Pacific Foodservice Tea Revenue (USD Million) by Type (2021-2032)
11.1.2. Asia Pacific Foodservice Tea Revenue (USD Million) by Application (2021-2032)
11.1.3. Asia Pacific Foodservice Tea Revenue (USD Million) by Product (2021-2032)
By Product
Black Tea
Green Tea
Others
By Type
Iced Tea and Hot Tea
By Distribution Channel
Full-Service Restaurants
Quick Service Restaurants
Others
Chapter 12. South America Foodservice Tea Analysis and Outlook
12.1. South America Foodservice Tea Revenue (USD Million), by Segments (2021-2032)
12.1.1. South America Foodservice Tea Revenue (USD Million) by Type (2021-2032)
12.1.2. South America Foodservice Tea Revenue (USD Million) by Application (2021-2032)
12.1.3. South America Foodservice Tea Revenue (USD Million) by Product (2021-2032)
By Product
Black Tea
Green Tea
Others
By Type
Iced Tea and Hot Tea
By Distribution Channel
Full-Service Restaurants
Quick Service Restaurants
Others
Chapter 13. Middle East and Africa Foodservice Tea Analysis and Outlook
13.1. Middle East and Africa Foodservice Tea Revenue (USD Million), by Segments (2021-2032)
13.1.1. Middle East and Africa Foodservice Tea Revenue (USD Million) by Type (2021-2032)
13.1.2. Middle East and Africa Foodservice Tea Revenue (USD Million) by Application (2021-2032)
13.1.3. Middle East and Africa Foodservice Tea Revenue (USD Million) by Product (2021-2032)
By Product
Black Tea
Green Tea
Others
By Type
Iced Tea and Hot Tea
By Distribution Channel
Full-Service Restaurants
Quick Service Restaurants
Others
Chapter 14. Foodservice Tea Company Profiles
14.1 Business Overview
14.2 Product Profiles
14.3 SWOT Profiles
14.5 Recent Developments
14.6 Financial Profile
List of Companies
Anchor Beverages Inc
Bigelow Tea
Golden Fleece Beverages Inc
Harris Freeman
Inspire Brands Inc
LIPTON Teas and Infusions
Numi Inc
Oribe Tea LLC
PALAIS DES THES
Starbucks Corp
Tata Consumer Products Ltd
Teatulia Organic Teas
15. Methodology and Data Sources
15.1 Customization Offerings
15.2 Subscription Services
15.3 Related Reports
15.4 Publisher Expertise
LIST OF TABLES
Table 1 Market Segmentation Analysis
Table 2 Global Foodservice Tea Market Share of Leading Companies, 2023
Table 3 Product Offerings of Leading Companies
Table 4 Low Growth Scenario Forecasts
Table 5 Reference Case Growth Scenario
Table 6 High Growth Case Scenario
Table 7 Global Foodservice Tea Revenue (USD Million) And CAGR (%) By Type (2021-2032)
Table 8 Global Foodservice Tea Revenue (USD Million) And CAGR (%) By Application (2021-2032)
Table 9 Global Foodservice Tea Revenue (USD Million) And CAGR (%) By Product (2021-2032)
Table 10 Global Foodservice Tea Market Revenue (USD Million) By Regions (2021-2032)
Table 11 Global Foodservice Tea Market Share (%) By Regions (2021-2032)
Table 12 North America Foodservice Tea Revenue (USD Million) By Country (2021-2032)
Table 13 Europe Foodservice Tea Revenue (USD Million) By Country (2021-2032)
Table 14 Asia Pacific Foodservice Tea Revenue (USD Million) By Country (2021-2032)
Table 15 South America Foodservice Tea Revenue (USD Million) By Country (2021-2032)
Table 16 Middle East and Africa Foodservice Tea Revenue (USD Million) By Region (2021-2032)
Table 17 North America Foodservice Tea Revenue (USD Million) By Type (2021-2032)
Table 18 North America Foodservice Tea Revenue (USD Million) By Application (2021-2032)
Table 19 North America Foodservice Tea Revenue (USD Million) By Product (2021-2032)
Table 20 Europe Foodservice Tea Revenue (USD Million) By Type (2021-2032)
Table 21 Europe Foodservice Tea Revenue (USD Million) By Application (2021-2032)
Table 22 Europe Foodservice Tea Revenue (USD Million) By Product (2021-2032)
Table 23 Asia Pacific Foodservice Tea Revenue (USD Million) By Type (2021-2032)
Table 24 Asia Pacific Foodservice Tea Revenue (USD Million) By Application (2021-2032)
Table 25 Asia Pacific Foodservice Tea Revenue (USD Million) By Product (2021-2032)
Table 26 South America Foodservice Tea Revenue (USD Million) By Type (2021-2032)
Table 27 South America Foodservice Tea Revenue (USD Million) By Application (2021-2032)
Table 28 South America Foodservice Tea Revenue (USD Million) By Product (2021-2032)
Table 29 Middle East and Africa Foodservice Tea Revenue (USD Million) By Type (2021-2032)
Table 30 Middle East and Africa Foodservice Tea Revenue (USD Million) By Application (2021-2032)
Table 31 Middle East and Africa Foodservice Tea Revenue (USD Million) By Product (2021-2032)
LIST OF FIGURES
Figure 1. Market Scope
Figure 2. Pricing Forecasts Per Unit, 2023- 2032
Figure 3. Porter’s Five Forces
Figure 4. Global Foodservice Tea Market Revenue (USD Million) By Regions (2021-2032)
Figure 5. Global Foodservice Tea Market Share (%) By Regions (2023)
Figure 6. North America Foodservice Tea Revenue (USD Million) By Country (2021-2032)
Figure 7. United States Foodservice Tea Revenue (USD Million) By Country (2021-2032)
Figure 8. Canada Foodservice Tea Revenue (USD Million) By Country (2021-2032)
Figure 9. Mexico Foodservice Tea Revenue (USD Million) By Country (2021-2032)
Figure 10. Europe Foodservice Tea Revenue (USD Million) By Country (2021-2032)
Figure 11. Germany Foodservice Tea Revenue (USD Million) By Country (2021-2032)
Figure 12. France Foodservice Tea Revenue (USD Million) By Country (2021-2032)
Figure 13. United Kingdom Foodservice Tea Revenue (USD Million) By Country (2021-2032)
Figure 14. Spain Foodservice Tea Revenue (USD Million) By Country (2021-2032)
Figure 15. Italy Foodservice Tea Revenue (USD Million) By Country (2021-2032)
Figure 16. Russia Foodservice Tea Revenue (USD Million) By Country (2021-2032)
Figure 17. Rest of Europe Foodservice Tea Revenue (USD Million) By Country (2021-2032)
Figure 11. Asia Pacific Foodservice Tea Revenue (USD Million) By Country (2021-2032)
Figure 12. China Foodservice Tea Revenue (USD Million) By Country (2021-2032)
Figure 13. Japan Foodservice Tea Revenue (USD Million) By Country (2021-2032)
Figure 14. India Foodservice Tea Revenue (USD Million) By Country (2021-2032)
Figure 15. South Korea Foodservice Tea Revenue (USD Million) By Country (2021-2032)
Figure 16. Australia Foodservice Tea Revenue (USD Million) By Country (2021-2032)
Figure 17. South East Asia Foodservice Tea Revenue (USD Million) By Country (2021-2032)
Figure 18. South America Foodservice Tea Revenue (USD Million) By Country (2021-2032)
Figure 19. Brazil Foodservice Tea Revenue (USD Million) By Country (2021-2032)
Figure 20. Argentina Foodservice Tea Revenue (USD Million) By Country (2021-2032)
Figure 21. Rest of Asia Pacific Foodservice Tea Revenue (USD Million) By Country (2021-2032)
Figure 22. Middle East and Africa Foodservice Tea Revenue (USD Million) By Region (2021-2032)
Figure 23. Saudi Arabia Foodservice Tea Revenue (USD Million) By Region (2021-2032)
Figure 24. The UAE Foodservice Tea Revenue (USD Million) By Region (2021-2032)
Figure 25. Rest of Middle East Foodservice Tea Revenue (USD Million) By Region (2021-2032)
Figure 26. South Africa Foodservice Tea Revenue (USD Million) By Region (2021-2032)
Figure 27. Africa Foodservice Tea Revenue (USD Million) By Region (2021-2032)
Figure 28. North America Foodservice Tea Revenue (USD Million) By Type (2021-2032)
Figure 29. North America Foodservice Tea Revenue (USD Million) By Application (2021-2032)
Figure 30. North America Foodservice Tea Revenue (USD Million) By Product (2021-2032)
Figure 31. Europe Foodservice Tea Revenue (USD Million) By Type (2021-2032)
Figure 32. Europe Foodservice Tea Revenue (USD Million) By Application (2021-2032)
Figure 33. Europe Foodservice Tea Revenue (USD Million) By Product (2021-2032)
Figure 34. Asia Pacific Foodservice Tea Revenue (USD Million) By Type (2021-2032)
Figure 35. Asia Pacific Foodservice Tea Revenue (USD Million) By Application (2021-2032)
Figure 36. Asia Pacific Foodservice Tea Revenue (USD Million) By Product (2021-2032)
Figure 37. South America Foodservice Tea Revenue (USD Million) By Type (2021-2032)
Figure 38. South America Foodservice Tea Revenue (USD Million) By Application (2021-2032)
Figure 39. South America Foodservice Tea Revenue (USD Million) By Product (2021-2032)
Figure 40. Middle East and Africa Foodservice Tea Revenue (USD Million) By Type (2021-2032)
Figure 41. Middle East and Africa Foodservice Tea Revenue (USD Million) By Application (2021-2032)
Figure 42. Middle East and Africa Foodservice Tea Revenue (USD Million) By Product (2021-2032)
By Product
Black Tea
Green Tea
Others
By Type
Iced Tea and Hot Tea
By Distribution Channel
Full-Service Restaurants
Quick Service Restaurants
Others
Countries Analyzed
North America (US, Canada, Mexico)
Europe (Germany, UK, France, Spain, Italy, Russia, Rest of Europe)
Asia Pacific (China, India, Japan, South Korea, Australia, South East Asia, Rest of Asia)
South America (Brazil, Argentina, Rest of South America)
Middle East and Africa (Saudi Arabia, UAE, Rest of Middle East, South Africa, Egypt, Rest of Africa)
