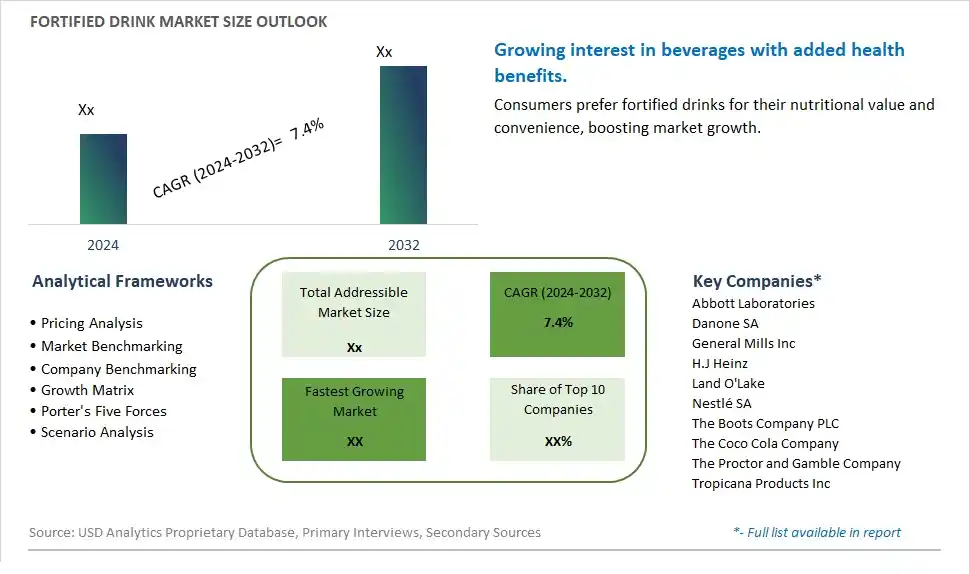
Global Fortified Drink Market Size is valued at $XX Million in 2024 and is forecast to register a growth rate (CAGR) of 7.4% to reach $XX Million by 2032.
The global Fortified Drink Market Comprehensive Study analyzes and forecasts the market size across 6 regions and 24 countries for diverse segments -By Nutrient (Minerals, Vitamins, Others), By Product (Non-Alcoholic, Alcoholic), By Distribution Channel (Store Based, Non-Store Based)
An Introduction to Fortified Drink Market
The Fortified Drink market in 2024 is thriving, fueled by the rising demand for beverages that provide additional health benefits. Fortified drinks, enriched with vitamins, minerals, amino acids, and other nutrients, are popular among health-conscious consumers and those with specific dietary needs. The market benefits from advancements in beverage formulation and fortification technologies, the growing trend of health and wellness, and the expansion of the functional and ready-to-drink beverage sectors. Additionally, the increasing awareness of the benefits of nutrient-dense beverages is driving market growth.
Fortified Drink Competitive Landscape
The market report analyses the leading companies in the industry including Abbott Laboratories, Danone SA, General Mills Inc, H.J Heinz, Land O'Lake, Nestlé SA, The Boots Company PLC, The Coco Cola Company, The Proctor and Gamble Company, Tropicana Products Inc, and Others.
Fortified Drink Market Dynamics
Fortified Drink Market Trend: Increasing Demand for Functional Beverages
The most prominent trend in the Fortified Drink Market is the increasing demand for functional beverages. Consumers are seeking beverages that offer additional health benefits, such as improved nutrition, enhanced energy, and better overall wellness. This trend is driven by the health and wellness movement, which emphasizes the role of fortified drinks in addressing dietary deficiencies and supporting a healthy lifestyle.
Fortified Drink Market Driver: Rising Health and Wellness Consciousness
The key driver of the Fortified Drink Market is the rising health and wellness consciousness among consumers. As more people focus on their health and dietary choices, there is a higher demand for beverages that provide added nutritional value. Fortified drinks, which incorporate vitamins, minerals, and other beneficial ingredients, offer a convenient way for consumers to enhance their nutrient intake and support their health goals, driving market growth.
Fortified Drink Market Opportunity: Innovation in Plant-Based and Natural Fortification
A significant opportunity in the Fortified Drink Market lies in innovation in plant-based and natural fortification. As consumer preferences shift towards natural and plant-based products, there is potential for developing fortified drinks that align with these trends. By offering beverages fortified with natural ingredients, such as plant extracts, superfoods, and organic nutrients, companies can attract health-conscious consumers and expand their market reach.
Fortified Drink Market Share Analysis: Vitamins segment generated the highest revenue share in the industry
Vitamins emerge as the largest segment in the Fortified Drink market, driven by increasing consumer awareness and demand for functional beverages that offer nutritional benefits beyond basic hydration. Vitamins are essential micronutrients that play crucial roles in maintaining health and supporting various bodily functions, ranging from immune system support to energy metabolism. In fortified drinks, vitamins are often added to enhance the nutritional profile and cater to specific health needs, such as vitamin C for immune support or vitamin D for bone health. The market for fortified drinks has seen significant growth due to rising health consciousness among consumers, who seek convenient ways to supplement their diets with essential nutrients. Manufacturers are responding by innovating with new formulations and flavors that appeal to diverse consumer preferences while meeting nutritional requirements. This trend is further bolstered by the expansion of the health and wellness sector and the increasing preference for beverages that offer functional benefits beyond mere refreshment. As such, the vitamins segment continues to dominate the fortified drink market landscape, poised for sustained growth as health trends continue to evolve globally.
Fortified Drink Market Share Analysis: Non-Alcoholic Fortified Drinks is the fastest growing segment over the forecast period to 2032
Non-alcoholic fortified drinks are identified as the fastest-growing segment in the Fortified Drink market, driven by evolving consumer preferences towards healthier beverage options. These drinks encompass a wide range of products such as fortified waters, energy drinks, functional juices, and ready-to-drink (RTD) beverages fortified with vitamins, minerals, and other beneficial nutrients. The growth of this segment is propelled by increasing health awareness among consumers globally, who are actively seeking beverages that offer nutritional benefits beyond traditional refreshment. Non-alcoholic fortified drinks cater to diverse consumer needs, including immunity boosting, energy enhancement, and overall wellness support. Manufacturers are responding by innovating with new formulations that balance health benefits with taste and convenience, appealing to health-conscious consumers of all age groups. This trend is reinforced by the growing prevalence of lifestyle-related health concerns and the shift towards preventive healthcare, driving the demand for functional beverages that support holistic well-being. As a result, the non-alcoholic fortified drinks segment is poised for robust growth leading up to 2032, supported by continuous innovation and expanding consumer awareness of nutritional fortification in beverages.
Fortified Drink Market Share Analysis: Store Based Distribution Channel segment generated the highest revenue share in the industry
The store-based distribution channel emerges as the largest segment in the Fortified Drink market, encompassing various retail formats such as supermarkets, hypermarkets, convenience stores, and specialty beverage outlets. This dominance is primarily driven by the widespread accessibility and convenience offered by physical retail locations, which cater to a broad spectrum of consumer preferences and purchasing behaviors. Supermarkets and hypermarkets, in particular, play a pivotal role in the distribution of fortified drinks by providing extensive shelf space, promotional opportunities, and a diverse product assortment that appeals to a wide demographic. These retail outlets leverage their robust supply chains and strategic locations to ensure widespread availability of fortified drinks across urban and rural areas alike, thereby enhancing consumer accessibility and visibility for brands. Further, store-based channels facilitate direct interaction between consumers and products, allowing for sensory experiences and informed purchase decisions through product demonstrations, sampling, and personalized recommendations. As consumer demand for functional and health-oriented beverages continues to grow, store-based distribution channels are expected to maintain their dominant position in the market, supported by ongoing retail innovations and the integration of digital technologies to enhance shopping experiences and operational efficiencies.
Fortified Drink Market Segmentation
By Nutrient
Minerals
Vitamins
Others
By Product
Non-Alcoholic
Alcoholic
By Distribution Channel
Store Based
Non-Store Based
Countries Analyzed
North America (US, Canada, Mexico)
Europe (Germany, UK, France, Spain, Italy, Russia, Rest of Europe)
Asia Pacific (China, India, Japan, South Korea, Australia, South East Asia, Rest of Asia)
South America (Brazil, Argentina, Rest of South America)
Middle East and Africa (Saudi Arabia, UAE, Rest of Middle East, South Africa, Egypt, Rest of Africa)
Fortified Drink Companies Profiled in the Study
Abbott Laboratories
Danone SA
General Mills Inc
H.J Heinz
Land O'Lake
Nestlé SA
The Boots Company PLC
The Coco Cola Company
The Proctor and Gamble Company
Tropicana Products Inc
*- List Not Exhaustive
Chapter 1. TABLE OF CONTENTS
Chapter 2. Introduction to Fortified Drink Market
2.1. Market Overview
2.2. Key Statistics and Report Highlights
2.3. Scope of the Comprehensive Study
2.3.1. Market Definition
2.3.2 Countries and Regions Covered
2.3.3 Research Objective
2.3.4 Units, Currency, and Conversions
2.3.5 Industry Value Chain
2.4. Key Market Segments
2.5. Key Companies
2.6. Study Period
Chapter 3. Strategic Analysis Review
3.1. Fortified Drink Pricing Analysis and Forecast
3.2. Porter’s Five Forces
3.3. Market Ecosystem
3.4. SWOT Analysis
3.5. Regulatory Scenario
3.3. Effects of Inflation, Russia-Ukraine War, moderating economic growth, and other macroeconomic factors
Chapter 4. Competitive Landscape
4.1. Market Share Analysis
4.1.1. Global Fortified Drink Market Share by Company, 2023
4.1.2. Product Offerings of Leading Fortified Drink Companies
4.2. Market Entropy
4.2.1. New Product Launches in the Industry
4.2.2. Mergers, Acquisitions, Joint ventures, and Partnerships
4.3. Key Strategies and Best Practices
Chapter 5. Global Market Projections: Best, Reference, and Low Case Scenarios
5.1. Growth Analysis- Case Scenario Definitions
5.2. Low Growth Case Scenario Forecasts
5.3. Reference Growth Case Scenario Forecasts
5.4. High Growth Case Scenario Forecasts
Chapter 6. Market Dynamics
6.1. Fortified Drink Market Drivers
6.2. Fortified Drink Market Challenges
6.6. Fortified Drink Market Opportunities
6.4. Fortified Drink Market Trends
Chapter 7. Global Fortified Drink Market Outlook Trends
7.1. Global Fortified Drink Revenue (USD Million) and CAGR (%) by Type (2021-2032)
7.2. Global Fortified Drink Revenue (USD Million) and CAGR (%) by Application (2021-2032)
7.3. Global Fortified Drink Revenue (USD Million) and CAGR (%) by Product (2021-2032)
By Nutrient
Minerals
Vitamins
Others
By Product
Non-Alcoholic
Alcoholic
By Distribution Channel
Store Based
Non-Store Based
Chapter 8. Global Fortified Drink Regional Analysis and Outlook
8.1. Global Fortified Drink Revenue (USD Million) By Regions (2021- 2032)
8.2. North America Fortified Drink Revenue (USD Million) by Country (2021-2032)
8.2.1. United States Fortified Drink Regional Analysis and Outlook
8.2.2. Canada Fortified Drink Regional Analysis and Outlook
8.2.3. Mexico Fortified Drink Regional Analysis and Outlook
8.3. Europe Fortified Drink Revenue (USD Million), by Country (2021-2032)
8.3.1. Germany Fortified Drink Regional Analysis and Outlook
8.3.2. France Fortified Drink Regional Analysis and Outlook
8.3.3. United Kingdom Fortified Drink Regional Analysis and Outlook
8.3.4. Spain Fortified Drink Regional Analysis and Outlook
8.3.5. Italy Fortified Drink Regional Analysis and Outlook
8.3.6. Russia Fortified Drink Regional Analysis and Outlook
8.3.7. Rest of Europe Fortified Drink Regional Analysis and Outlook
8.4. Asia Pacific Fortified Drink Revenue (USD Million) by Country (2021-2032)
8.4.1. China Fortified Drink Regional Analysis and Outlook
8.4.2. Japan Fortified Drink Regional Analysis and Outlook
8.4.3. India Fortified Drink Regional Analysis and Outlook
8.4.4. South Korea Fortified Drink Regional Analysis and Outlook
8.4.5. Australia Fortified Drink Regional Analysis and Outlook
8.4.6. South East Asia Fortified Drink Regional Analysis and Outlook
8.4.7. Rest of Asia Pacific Fortified Drink Regional Analysis and Outlook
8.5. South America Fortified Drink Revenue (USD Million), by Country (2021-2032)
8.5.1. Brazil Fortified Drink Regional Analysis and Outlook
8.5.2. Argentina Fortified Drink Regional Analysis and Outlook
8.5.3. Rest of South America Fortified Drink Regional Analysis and Outlook
8.6. Middle East and Africa Fortified Drink Revenue (USD Million) by Country (2021-2032)
8.6.1. Middle East Fortified Drink Regional Analysis and Outlook
8.6.2. Africa Fortified Drink Regional Analysis and Outlook
Chapter 9. North America Fortified Drink Analysis and Outlook
9.1. North America Fortified Drink Revenue (USD Million) by Segments (2021-2032)
9.1.1. North America Fortified Drink Revenue (USD Million) by Type (2021-2032)
9.1.2. North America Fortified Drink Revenue (USD Million) by Application (2021-2032)
9.1.3. North America Fortified Drink Revenue (USD Million) by Product (2021-2032)
By Nutrient
Minerals
Vitamins
Others
By Product
Non-Alcoholic
Alcoholic
By Distribution Channel
Store Based
Non-Store Based
Chapter 10. Europe Fortified Drink Analysis and Outlook
10.1. Europe Fortified Drink Revenue (USD Million), by Segments (USD Million) (2021-2032)
10.1.1. Europe Fortified Drink Revenue (USD Million) by Type (2021-2032)
10.1.2. Europe Fortified Drink Revenue (USD Million) by Application (2021-2032)
10.1.3. Europe Fortified Drink Revenue (USD Million) by Product (2021-2032)
By Nutrient
Minerals
Vitamins
Others
By Product
Non-Alcoholic
Alcoholic
By Distribution Channel
Store Based
Non-Store Based
Chapter 11. Asia Pacific Fortified Drink Analysis and Outlook
11.1. Asia Pacific Fortified Drink Revenue (USD Million), and Revenue (USD Million) by Segments (2021-2032)
11.1.1. Asia Pacific Fortified Drink Revenue (USD Million) by Type (2021-2032)
11.1.2. Asia Pacific Fortified Drink Revenue (USD Million) by Application (2021-2032)
11.1.3. Asia Pacific Fortified Drink Revenue (USD Million) by Product (2021-2032)
By Nutrient
Minerals
Vitamins
Others
By Product
Non-Alcoholic
Alcoholic
By Distribution Channel
Store Based
Non-Store Based
Chapter 12. South America Fortified Drink Analysis and Outlook
12.1. South America Fortified Drink Revenue (USD Million), by Segments (2021-2032)
12.1.1. South America Fortified Drink Revenue (USD Million) by Type (2021-2032)
12.1.2. South America Fortified Drink Revenue (USD Million) by Application (2021-2032)
12.1.3. South America Fortified Drink Revenue (USD Million) by Product (2021-2032)
By Nutrient
Minerals
Vitamins
Others
By Product
Non-Alcoholic
Alcoholic
By Distribution Channel
Store Based
Non-Store Based
Chapter 13. Middle East and Africa Fortified Drink Analysis and Outlook
13.1. Middle East and Africa Fortified Drink Revenue (USD Million), by Segments (2021-2032)
13.1.1. Middle East and Africa Fortified Drink Revenue (USD Million) by Type (2021-2032)
13.1.2. Middle East and Africa Fortified Drink Revenue (USD Million) by Application (2021-2032)
13.1.3. Middle East and Africa Fortified Drink Revenue (USD Million) by Product (2021-2032)
By Nutrient
Minerals
Vitamins
Others
By Product
Non-Alcoholic
Alcoholic
By Distribution Channel
Store Based
Non-Store Based
Chapter 14. Fortified Drink Company Profiles
14.1 Business Overview
14.2 Product Profiles
14.3 SWOT Profiles
14.5 Recent Developments
14.6 Financial Profile
List of Companies
Abbott Laboratories
Danone SA
General Mills Inc
H.J Heinz
Land O'Lake
Nestlé SA
The Boots Company PLC
The Coco Cola Company
The Proctor and Gamble Company
Tropicana Products Inc
15. Methodology and Data Sources
15.1 Customization Offerings
15.2 Subscription Services
15.3 Related Reports
15.4 Publisher Expertise
LIST OF TABLES
Table 1 Market Segmentation Analysis
Table 2 Global Fortified Drink Market Share of Leading Companies, 2023
Table 3 Product Offerings of Leading Companies
Table 4 Low Growth Scenario Forecasts
Table 5 Reference Case Growth Scenario
Table 6 High Growth Case Scenario
Table 7 Global Fortified Drink Revenue (USD Million) And CAGR (%) By Type (2021-2032)
Table 8 Global Fortified Drink Revenue (USD Million) And CAGR (%) By Application (2021-2032)
Table 9 Global Fortified Drink Revenue (USD Million) And CAGR (%) By Product (2021-2032)
Table 10 Global Fortified Drink Market Revenue (USD Million) By Regions (2021-2032)
Table 11 Global Fortified Drink Market Share (%) By Regions (2021-2032)
Table 12 North America Fortified Drink Revenue (USD Million) By Country (2021-2032)
Table 13 Europe Fortified Drink Revenue (USD Million) By Country (2021-2032)
Table 14 Asia Pacific Fortified Drink Revenue (USD Million) By Country (2021-2032)
Table 15 South America Fortified Drink Revenue (USD Million) By Country (2021-2032)
Table 16 Middle East and Africa Fortified Drink Revenue (USD Million) By Region (2021-2032)
Table 17 North America Fortified Drink Revenue (USD Million) By Type (2021-2032)
Table 18 North America Fortified Drink Revenue (USD Million) By Application (2021-2032)
Table 19 North America Fortified Drink Revenue (USD Million) By Product (2021-2032)
Table 20 Europe Fortified Drink Revenue (USD Million) By Type (2021-2032)
Table 21 Europe Fortified Drink Revenue (USD Million) By Application (2021-2032)
Table 22 Europe Fortified Drink Revenue (USD Million) By Product (2021-2032)
Table 23 Asia Pacific Fortified Drink Revenue (USD Million) By Type (2021-2032)
Table 24 Asia Pacific Fortified Drink Revenue (USD Million) By Application (2021-2032)
Table 25 Asia Pacific Fortified Drink Revenue (USD Million) By Product (2021-2032)
Table 26 South America Fortified Drink Revenue (USD Million) By Type (2021-2032)
Table 27 South America Fortified Drink Revenue (USD Million) By Application (2021-2032)
Table 28 South America Fortified Drink Revenue (USD Million) By Product (2021-2032)
Table 29 Middle East and Africa Fortified Drink Revenue (USD Million) By Type (2021-2032)
Table 30 Middle East and Africa Fortified Drink Revenue (USD Million) By Application (2021-2032)
Table 31 Middle East and Africa Fortified Drink Revenue (USD Million) By Product (2021-2032)
LIST OF FIGURES
Figure 1. Market Scope
Figure 2. Pricing Forecasts Per Unit, 2023- 2032
Figure 3. Porter’s Five Forces
Figure 4. Global Fortified Drink Market Revenue (USD Million) By Regions (2021-2032)
Figure 5. Global Fortified Drink Market Share (%) By Regions (2023)
Figure 6. North America Fortified Drink Revenue (USD Million) By Country (2021-2032)
Figure 7. United States Fortified Drink Revenue (USD Million) By Country (2021-2032)
Figure 8. Canada Fortified Drink Revenue (USD Million) By Country (2021-2032)
Figure 9. Mexico Fortified Drink Revenue (USD Million) By Country (2021-2032)
Figure 10. Europe Fortified Drink Revenue (USD Million) By Country (2021-2032)
Figure 11. Germany Fortified Drink Revenue (USD Million) By Country (2021-2032)
Figure 12. France Fortified Drink Revenue (USD Million) By Country (2021-2032)
Figure 13. United Kingdom Fortified Drink Revenue (USD Million) By Country (2021-2032)
Figure 14. Spain Fortified Drink Revenue (USD Million) By Country (2021-2032)
Figure 15. Italy Fortified Drink Revenue (USD Million) By Country (2021-2032)
Figure 16. Russia Fortified Drink Revenue (USD Million) By Country (2021-2032)
Figure 17. Rest of Europe Fortified Drink Revenue (USD Million) By Country (2021-2032)
Figure 11. Asia Pacific Fortified Drink Revenue (USD Million) By Country (2021-2032)
Figure 12. China Fortified Drink Revenue (USD Million) By Country (2021-2032)
Figure 13. Japan Fortified Drink Revenue (USD Million) By Country (2021-2032)
Figure 14. India Fortified Drink Revenue (USD Million) By Country (2021-2032)
Figure 15. South Korea Fortified Drink Revenue (USD Million) By Country (2021-2032)
Figure 16. Australia Fortified Drink Revenue (USD Million) By Country (2021-2032)
Figure 17. South East Asia Fortified Drink Revenue (USD Million) By Country (2021-2032)
Figure 18. South America Fortified Drink Revenue (USD Million) By Country (2021-2032)
Figure 19. Brazil Fortified Drink Revenue (USD Million) By Country (2021-2032)
Figure 20. Argentina Fortified Drink Revenue (USD Million) By Country (2021-2032)
Figure 21. Rest of Asia Pacific Fortified Drink Revenue (USD Million) By Country (2021-2032)
Figure 22. Middle East and Africa Fortified Drink Revenue (USD Million) By Region (2021-2032)
Figure 23. Saudi Arabia Fortified Drink Revenue (USD Million) By Region (2021-2032)
Figure 24. The UAE Fortified Drink Revenue (USD Million) By Region (2021-2032)
Figure 25. Rest of Middle East Fortified Drink Revenue (USD Million) By Region (2021-2032)
Figure 26. South Africa Fortified Drink Revenue (USD Million) By Region (2021-2032)
Figure 27. Africa Fortified Drink Revenue (USD Million) By Region (2021-2032)
Figure 28. North America Fortified Drink Revenue (USD Million) By Type (2021-2032)
Figure 29. North America Fortified Drink Revenue (USD Million) By Application (2021-2032)
Figure 30. North America Fortified Drink Revenue (USD Million) By Product (2021-2032)
Figure 31. Europe Fortified Drink Revenue (USD Million) By Type (2021-2032)
Figure 32. Europe Fortified Drink Revenue (USD Million) By Application (2021-2032)
Figure 33. Europe Fortified Drink Revenue (USD Million) By Product (2021-2032)
Figure 34. Asia Pacific Fortified Drink Revenue (USD Million) By Type (2021-2032)
Figure 35. Asia Pacific Fortified Drink Revenue (USD Million) By Application (2021-2032)
Figure 36. Asia Pacific Fortified Drink Revenue (USD Million) By Product (2021-2032)
Figure 37. South America Fortified Drink Revenue (USD Million) By Type (2021-2032)
Figure 38. South America Fortified Drink Revenue (USD Million) By Application (2021-2032)
Figure 39. South America Fortified Drink Revenue (USD Million) By Product (2021-2032)
Figure 40. Middle East and Africa Fortified Drink Revenue (USD Million) By Type (2021-2032)
Figure 41. Middle East and Africa Fortified Drink Revenue (USD Million) By Application (2021-2032)
Figure 42. Middle East and Africa Fortified Drink Revenue (USD Million) By Product (2021-2032)
By Nutrient
Minerals
Vitamins
Others
By Product
Non-Alcoholic
Alcoholic
By Distribution Channel
Store Based
Non-Store Based
Countries Analyzed
North America (US, Canada, Mexico)
Europe (Germany, UK, France, Spain, Italy, Russia, Rest of Europe)
Asia Pacific (China, India, Japan, South Korea, Australia, South East Asia, Rest of Asia)
South America (Brazil, Argentina, Rest of South America)
Middle East and Africa (Saudi Arabia, UAE, Rest of Middle East, South Africa, Egypt, Rest of Africa)
