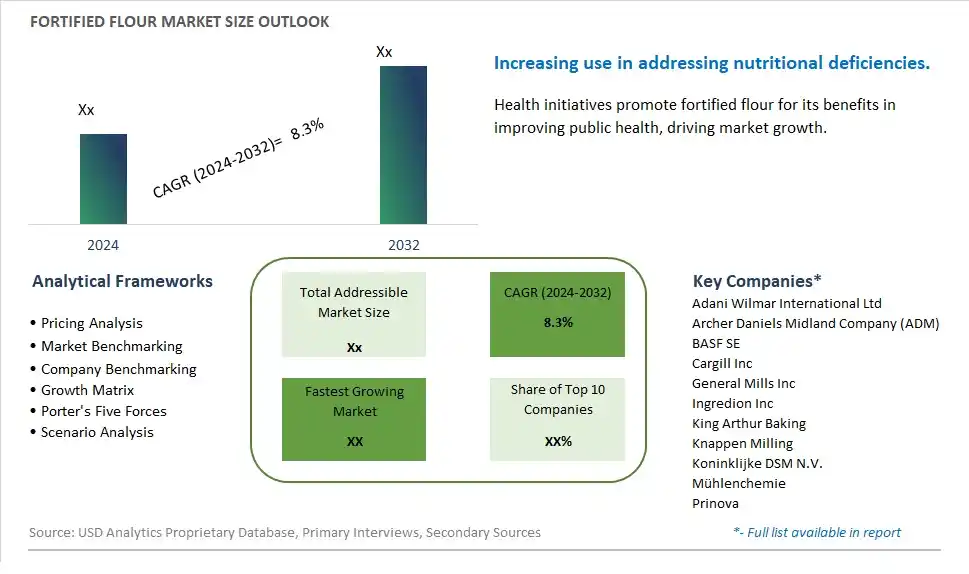
Global Fortified Flour Market Size is valued at $XX Million in 2024 and is forecast to register a growth rate (CAGR) of 8.3% to reach $XX Million by 2032.
The global Fortified Flour Market Comprehensive Study analyzes and forecasts the market size across 6 regions and 24 countries for diverse segments -By Type (Wheat, Corn, Rice), By Application (Supermarkets/Hypermarkets, Convenience Stores, Online, Others)
An Introduction to Fortified Flour Market
In 2024, the Fortified Flour market is witnessing robust growth, driven by the increasing demand for nutrient-enriched flours in baking and cooking. Fortified flour, which contains added vitamins and minerals, helps address nutritional deficiencies and supports overall health. The market benefits from advancements in fortification technologies, the growing trend of health-conscious eating, and the expansion of the global food processing sector. Additionally, government initiatives to promote fortified foods to combat malnutrition are contributing to market growth.
Fortified Flour Competitive Landscape
The market report analyses the leading companies in the industry including Adani Wilmar International Ltd, Archer Daniels Midland Company (ADM), BASF SE, Cargill Inc, General Mills Inc, Ingredion Inc, King Arthur Baking, Knappen Milling, Koninklijke DSM N.V., Mühlenchemie, Prinova, and Others.
Fortified Flour Market Dynamics
Fortified Flour Market Trend: Rising Demand for Nutrient-Rich Flour Products
The most prominent trend in the Fortified Flour Market is the rising demand for nutrient-rich flour products. Consumers are increasingly seeking flour that provides additional health benefits, such as improved nutrition and enhanced wellness. This trend is driven by the health and wellness movement, which emphasizes the importance of balanced diets and the role of fortified foods in addressing nutritional deficiencies.
Fortified Flour Market Driver: Government Initiatives for Nutritional Improvement
The key driver of the Fortified Flour Market is government initiatives for nutritional improvement. Many governments worldwide are implementing programs to fortify staple foods, including flour, with essential vitamins and minerals to address malnutrition and improve public health. These initiatives are driving the demand for fortified flour and encouraging manufacturers to adopt fortification practices.
Fortified Flour Market Opportunity: Development of Specialty Fortified Flour Products
A significant opportunity in the Fortified Flour Market lies in the development of specialty fortified flour products. By creating fortified flours that cater to specific dietary needs, such as gluten-free, high-fiber, and protein-enriched options, companies can attract niche consumer segments. Offering products that combine great taste with superior nutrition can help manufacturers differentiate themselves and capture a larger share of the growing market for functional and specialty foods.
Fortified Flour Market Share Analysis: Wheat Fortified Flour segment generated the highest revenue share in the industry
Wheat fortified flour stands out as the largest segment in the Fortified Flour market, owing to its widespread consumption and versatile applications in various food products globally. Wheat flour is a staple ingredient in many cuisines worldwide, utilized extensively in baking bread, pastries, cakes, and noodles, among other products. The fortification of wheat flour with essential nutrients such as vitamins (like folate, niacin, and riboflavin) and minerals (including iron and zinc) addresses widespread nutritional deficiencies, particularly in regions where wheat-based products are dietary staples. This segment's dominance is reinforced by its integral role in addressing public health concerns related to micronutrient deficiencies, contributing significantly to improved health outcomes and overall well-being among populations. Further, wheat flour's inherent gluten content provides structural integrity and texture to baked goods, making it indispensable in food processing and culinary applications. As consumer awareness about nutritional benefits grows and regulatory mandates for flour fortification expand globally, the demand for fortified wheat flour is expected to witness steady growth, supported by initiatives promoting health-conscious choices and sustainable food practices.
Fortified Flour Market Share Analysis: Online Sales is the fastest growing segment over the forecast period to 2032
The online sales segment is identified as the fastest-growing segment in the Fortified Flour market by application, expected to exhibit substantial growth trajectory up to 2032. With the increasing digitalization of retail and consumer shopping behaviors shifting towards online platforms, the fortified flour market has witnessed a notable surge in online sales channels. Consumers are increasingly turning to e-commerce platforms to purchase essential food items, including fortified flour, due to convenience, accessibility, and a wider range of product options available online. This trend is further amplified by the growing preference for home delivery services and the ease of comparing prices and product specifications online. Further, the Past few yearshas accelerated the adoption of online shopping for groceries and food products, influencing long-term consumer habits towards digital platforms. As e-commerce infrastructures continue to evolve globally and penetrate deeper into emerging markets, the online sales of fortified flour are poised to grow robustly, supported by advancements in logistics and fulfillment services that enhance delivery efficiency and customer satisfaction. Additionally, targeted digital marketing strategies and promotional campaigns tailored to online consumers will play a pivotal role in driving the expansion of this segment, contributing significantly to the overall market growth of fortified flour.
Fortified Flour Market Segmentation
By Type
Wheat
Corn
Rice
By Application
Supermarkets/Hypermarkets
Convenience Stores
Online
Others
Countries Analyzed
North America (US, Canada, Mexico)
Europe (Germany, UK, France, Spain, Italy, Russia, Rest of Europe)
Asia Pacific (China, India, Japan, South Korea, Australia, South East Asia, Rest of Asia)
South America (Brazil, Argentina, Rest of South America)
Middle East and Africa (Saudi Arabia, UAE, Rest of Middle East, South Africa, Egypt, Rest of Africa)
Fortified Flour Companies Profiled in the Study
Adani Wilmar International Ltd
Archer Daniels Midland Company (ADM)
BASF SE
Cargill Inc
General Mills Inc
Ingredion Inc
King Arthur Baking
Knappen Milling
Koninklijke DSM N.V.
Mühlenchemie
Prinova
*- List Not Exhaustive
Chapter 1. TABLE OF CONTENTS
Chapter 2. Introduction to Fortified Flour Market
2.1. Market Overview
2.2. Key Statistics and Report Highlights
2.3. Scope of the Comprehensive Study
2.3.1. Market Definition
2.3.2 Countries and Regions Covered
2.3.3 Research Objective
2.3.4 Units, Currency, and Conversions
2.3.5 Industry Value Chain
2.4. Key Market Segments
2.5. Key Companies
2.6. Study Period
Chapter 3. Strategic Analysis Review
3.1. Fortified Flour Pricing Analysis and Forecast
3.2. Porter’s Five Forces
3.3. Market Ecosystem
3.4. SWOT Analysis
3.5. Regulatory Scenario
3.3. Effects of Inflation, Russia-Ukraine War, moderating economic growth, and other macroeconomic factors
Chapter 4. Competitive Landscape
4.1. Market Share Analysis
4.1.1. Global Fortified Flour Market Share by Company, 2023
4.1.2. Product Offerings of Leading Fortified Flour Companies
4.2. Market Entropy
4.2.1. New Product Launches in the Industry
4.2.2. Mergers, Acquisitions, Joint ventures, and Partnerships
4.3. Key Strategies and Best Practices
Chapter 5. Global Market Projections: Best, Reference, and Low Case Scenarios
5.1. Growth Analysis- Case Scenario Definitions
5.2. Low Growth Case Scenario Forecasts
5.3. Reference Growth Case Scenario Forecasts
5.4. High Growth Case Scenario Forecasts
Chapter 6. Market Dynamics
6.1. Fortified Flour Market Drivers
6.2. Fortified Flour Market Challenges
6.6. Fortified Flour Market Opportunities
6.4. Fortified Flour Market Trends
Chapter 7. Global Fortified Flour Market Outlook Trends
7.1. Global Fortified Flour Revenue (USD Million) and CAGR (%) by Type (2021-2032)
7.2. Global Fortified Flour Revenue (USD Million) and CAGR (%) by Application (2021-2032)
7.3. Global Fortified Flour Revenue (USD Million) and CAGR (%) by Product (2021-2032)
By Type
Wheat
Corn
Rice
By Application
Supermarkets/Hypermarkets
Convenience Stores
Online
Others
Chapter 8. Global Fortified Flour Regional Analysis and Outlook
8.1. Global Fortified Flour Revenue (USD Million) By Regions (2021- 2032)
8.2. North America Fortified Flour Revenue (USD Million) by Country (2021-2032)
8.2.1. United States Fortified Flour Regional Analysis and Outlook
8.2.2. Canada Fortified Flour Regional Analysis and Outlook
8.2.3. Mexico Fortified Flour Regional Analysis and Outlook
8.3. Europe Fortified Flour Revenue (USD Million), by Country (2021-2032)
8.3.1. Germany Fortified Flour Regional Analysis and Outlook
8.3.2. France Fortified Flour Regional Analysis and Outlook
8.3.3. United Kingdom Fortified Flour Regional Analysis and Outlook
8.3.4. Spain Fortified Flour Regional Analysis and Outlook
8.3.5. Italy Fortified Flour Regional Analysis and Outlook
8.3.6. Russia Fortified Flour Regional Analysis and Outlook
8.3.7. Rest of Europe Fortified Flour Regional Analysis and Outlook
8.4. Asia Pacific Fortified Flour Revenue (USD Million) by Country (2021-2032)
8.4.1. China Fortified Flour Regional Analysis and Outlook
8.4.2. Japan Fortified Flour Regional Analysis and Outlook
8.4.3. India Fortified Flour Regional Analysis and Outlook
8.4.4. South Korea Fortified Flour Regional Analysis and Outlook
8.4.5. Australia Fortified Flour Regional Analysis and Outlook
8.4.6. South East Asia Fortified Flour Regional Analysis and Outlook
8.4.7. Rest of Asia Pacific Fortified Flour Regional Analysis and Outlook
8.5. South America Fortified Flour Revenue (USD Million), by Country (2021-2032)
8.5.1. Brazil Fortified Flour Regional Analysis and Outlook
8.5.2. Argentina Fortified Flour Regional Analysis and Outlook
8.5.3. Rest of South America Fortified Flour Regional Analysis and Outlook
8.6. Middle East and Africa Fortified Flour Revenue (USD Million) by Country (2021-2032)
8.6.1. Middle East Fortified Flour Regional Analysis and Outlook
8.6.2. Africa Fortified Flour Regional Analysis and Outlook
Chapter 9. North America Fortified Flour Analysis and Outlook
9.1. North America Fortified Flour Revenue (USD Million) by Segments (2021-2032)
9.1.1. North America Fortified Flour Revenue (USD Million) by Type (2021-2032)
9.1.2. North America Fortified Flour Revenue (USD Million) by Application (2021-2032)
9.1.3. North America Fortified Flour Revenue (USD Million) by Product (2021-2032)
By Type
Wheat
Corn
Rice
By Application
Supermarkets/Hypermarkets
Convenience Stores
Online
Others
Chapter 10. Europe Fortified Flour Analysis and Outlook
10.1. Europe Fortified Flour Revenue (USD Million), by Segments (USD Million) (2021-2032)
10.1.1. Europe Fortified Flour Revenue (USD Million) by Type (2021-2032)
10.1.2. Europe Fortified Flour Revenue (USD Million) by Application (2021-2032)
10.1.3. Europe Fortified Flour Revenue (USD Million) by Product (2021-2032)
By Type
Wheat
Corn
Rice
By Application
Supermarkets/Hypermarkets
Convenience Stores
Online
Others
Chapter 11. Asia Pacific Fortified Flour Analysis and Outlook
11.1. Asia Pacific Fortified Flour Revenue (USD Million), and Revenue (USD Million) by Segments (2021-2032)
11.1.1. Asia Pacific Fortified Flour Revenue (USD Million) by Type (2021-2032)
11.1.2. Asia Pacific Fortified Flour Revenue (USD Million) by Application (2021-2032)
11.1.3. Asia Pacific Fortified Flour Revenue (USD Million) by Product (2021-2032)
By Type
Wheat
Corn
Rice
By Application
Supermarkets/Hypermarkets
Convenience Stores
Online
Others
Chapter 12. South America Fortified Flour Analysis and Outlook
12.1. South America Fortified Flour Revenue (USD Million), by Segments (2021-2032)
12.1.1. South America Fortified Flour Revenue (USD Million) by Type (2021-2032)
12.1.2. South America Fortified Flour Revenue (USD Million) by Application (2021-2032)
12.1.3. South America Fortified Flour Revenue (USD Million) by Product (2021-2032)
By Type
Wheat
Corn
Rice
By Application
Supermarkets/Hypermarkets
Convenience Stores
Online
Others
Chapter 13. Middle East and Africa Fortified Flour Analysis and Outlook
13.1. Middle East and Africa Fortified Flour Revenue (USD Million), by Segments (2021-2032)
13.1.1. Middle East and Africa Fortified Flour Revenue (USD Million) by Type (2021-2032)
13.1.2. Middle East and Africa Fortified Flour Revenue (USD Million) by Application (2021-2032)
13.1.3. Middle East and Africa Fortified Flour Revenue (USD Million) by Product (2021-2032)
By Type
Wheat
Corn
Rice
By Application
Supermarkets/Hypermarkets
Convenience Stores
Online
Others
Chapter 14. Fortified Flour Company Profiles
14.1 Business Overview
14.2 Product Profiles
14.3 SWOT Profiles
14.5 Recent Developments
14.6 Financial Profile
List of Companies
Adani Wilmar International Ltd
Archer Daniels Midland Company (ADM)
BASF SE
Cargill Inc
General Mills Inc
Ingredion Inc
King Arthur Baking
Knappen Milling
Koninklijke DSM N.V.
Mühlenchemie
Prinova
15. Methodology and Data Sources
15.1 Customization Offerings
15.2 Subscription Services
15.3 Related Reports
15.4 Publisher Expertise
LIST OF TABLES
Table 1 Market Segmentation Analysis
Table 2 Global Fortified Flour Market Share of Leading Companies, 2023
Table 3 Product Offerings of Leading Companies
Table 4 Low Growth Scenario Forecasts
Table 5 Reference Case Growth Scenario
Table 6 High Growth Case Scenario
Table 7 Global Fortified Flour Revenue (USD Million) And CAGR (%) By Type (2021-2032)
Table 8 Global Fortified Flour Revenue (USD Million) And CAGR (%) By Application (2021-2032)
Table 9 Global Fortified Flour Revenue (USD Million) And CAGR (%) By Product (2021-2032)
Table 10 Global Fortified Flour Market Revenue (USD Million) By Regions (2021-2032)
Table 11 Global Fortified Flour Market Share (%) By Regions (2021-2032)
Table 12 North America Fortified Flour Revenue (USD Million) By Country (2021-2032)
Table 13 Europe Fortified Flour Revenue (USD Million) By Country (2021-2032)
Table 14 Asia Pacific Fortified Flour Revenue (USD Million) By Country (2021-2032)
Table 15 South America Fortified Flour Revenue (USD Million) By Country (2021-2032)
Table 16 Middle East and Africa Fortified Flour Revenue (USD Million) By Region (2021-2032)
Table 17 North America Fortified Flour Revenue (USD Million) By Type (2021-2032)
Table 18 North America Fortified Flour Revenue (USD Million) By Application (2021-2032)
Table 19 North America Fortified Flour Revenue (USD Million) By Product (2021-2032)
Table 20 Europe Fortified Flour Revenue (USD Million) By Type (2021-2032)
Table 21 Europe Fortified Flour Revenue (USD Million) By Application (2021-2032)
Table 22 Europe Fortified Flour Revenue (USD Million) By Product (2021-2032)
Table 23 Asia Pacific Fortified Flour Revenue (USD Million) By Type (2021-2032)
Table 24 Asia Pacific Fortified Flour Revenue (USD Million) By Application (2021-2032)
Table 25 Asia Pacific Fortified Flour Revenue (USD Million) By Product (2021-2032)
Table 26 South America Fortified Flour Revenue (USD Million) By Type (2021-2032)
Table 27 South America Fortified Flour Revenue (USD Million) By Application (2021-2032)
Table 28 South America Fortified Flour Revenue (USD Million) By Product (2021-2032)
Table 29 Middle East and Africa Fortified Flour Revenue (USD Million) By Type (2021-2032)
Table 30 Middle East and Africa Fortified Flour Revenue (USD Million) By Application (2021-2032)
Table 31 Middle East and Africa Fortified Flour Revenue (USD Million) By Product (2021-2032)
LIST OF FIGURES
Figure 1. Market Scope
Figure 2. Pricing Forecasts Per Unit, 2023- 2032
Figure 3. Porter’s Five Forces
Figure 4. Global Fortified Flour Market Revenue (USD Million) By Regions (2021-2032)
Figure 5. Global Fortified Flour Market Share (%) By Regions (2023)
Figure 6. North America Fortified Flour Revenue (USD Million) By Country (2021-2032)
Figure 7. United States Fortified Flour Revenue (USD Million) By Country (2021-2032)
Figure 8. Canada Fortified Flour Revenue (USD Million) By Country (2021-2032)
Figure 9. Mexico Fortified Flour Revenue (USD Million) By Country (2021-2032)
Figure 10. Europe Fortified Flour Revenue (USD Million) By Country (2021-2032)
Figure 11. Germany Fortified Flour Revenue (USD Million) By Country (2021-2032)
Figure 12. France Fortified Flour Revenue (USD Million) By Country (2021-2032)
Figure 13. United Kingdom Fortified Flour Revenue (USD Million) By Country (2021-2032)
Figure 14. Spain Fortified Flour Revenue (USD Million) By Country (2021-2032)
Figure 15. Italy Fortified Flour Revenue (USD Million) By Country (2021-2032)
Figure 16. Russia Fortified Flour Revenue (USD Million) By Country (2021-2032)
Figure 17. Rest of Europe Fortified Flour Revenue (USD Million) By Country (2021-2032)
Figure 11. Asia Pacific Fortified Flour Revenue (USD Million) By Country (2021-2032)
Figure 12. China Fortified Flour Revenue (USD Million) By Country (2021-2032)
Figure 13. Japan Fortified Flour Revenue (USD Million) By Country (2021-2032)
Figure 14. India Fortified Flour Revenue (USD Million) By Country (2021-2032)
Figure 15. South Korea Fortified Flour Revenue (USD Million) By Country (2021-2032)
Figure 16. Australia Fortified Flour Revenue (USD Million) By Country (2021-2032)
Figure 17. South East Asia Fortified Flour Revenue (USD Million) By Country (2021-2032)
Figure 18. South America Fortified Flour Revenue (USD Million) By Country (2021-2032)
Figure 19. Brazil Fortified Flour Revenue (USD Million) By Country (2021-2032)
Figure 20. Argentina Fortified Flour Revenue (USD Million) By Country (2021-2032)
Figure 21. Rest of Asia Pacific Fortified Flour Revenue (USD Million) By Country (2021-2032)
Figure 22. Middle East and Africa Fortified Flour Revenue (USD Million) By Region (2021-2032)
Figure 23. Saudi Arabia Fortified Flour Revenue (USD Million) By Region (2021-2032)
Figure 24. The UAE Fortified Flour Revenue (USD Million) By Region (2021-2032)
Figure 25. Rest of Middle East Fortified Flour Revenue (USD Million) By Region (2021-2032)
Figure 26. South Africa Fortified Flour Revenue (USD Million) By Region (2021-2032)
Figure 27. Africa Fortified Flour Revenue (USD Million) By Region (2021-2032)
Figure 28. North America Fortified Flour Revenue (USD Million) By Type (2021-2032)
Figure 29. North America Fortified Flour Revenue (USD Million) By Application (2021-2032)
Figure 30. North America Fortified Flour Revenue (USD Million) By Product (2021-2032)
Figure 31. Europe Fortified Flour Revenue (USD Million) By Type (2021-2032)
Figure 32. Europe Fortified Flour Revenue (USD Million) By Application (2021-2032)
Figure 33. Europe Fortified Flour Revenue (USD Million) By Product (2021-2032)
Figure 34. Asia Pacific Fortified Flour Revenue (USD Million) By Type (2021-2032)
Figure 35. Asia Pacific Fortified Flour Revenue (USD Million) By Application (2021-2032)
Figure 36. Asia Pacific Fortified Flour Revenue (USD Million) By Product (2021-2032)
Figure 37. South America Fortified Flour Revenue (USD Million) By Type (2021-2032)
Figure 38. South America Fortified Flour Revenue (USD Million) By Application (2021-2032)
Figure 39. South America Fortified Flour Revenue (USD Million) By Product (2021-2032)
Figure 40. Middle East and Africa Fortified Flour Revenue (USD Million) By Type (2021-2032)
Figure 41. Middle East and Africa Fortified Flour Revenue (USD Million) By Application (2021-2032)
Figure 42. Middle East and Africa Fortified Flour Revenue (USD Million) By Product (2021-2032)
By Type
Wheat
Corn
Rice
By Application
Supermarkets/Hypermarkets
Convenience Stores
Online
Others
Countries Analyzed
North America (US, Canada, Mexico)
Europe (Germany, UK, France, Spain, Italy, Russia, Rest of Europe)
Asia Pacific (China, India, Japan, South Korea, Australia, South East Asia, Rest of Asia)
South America (Brazil, Argentina, Rest of South America)
Middle East and Africa (Saudi Arabia, UAE, Rest of Middle East, South Africa, Egypt, Rest of Africa)
