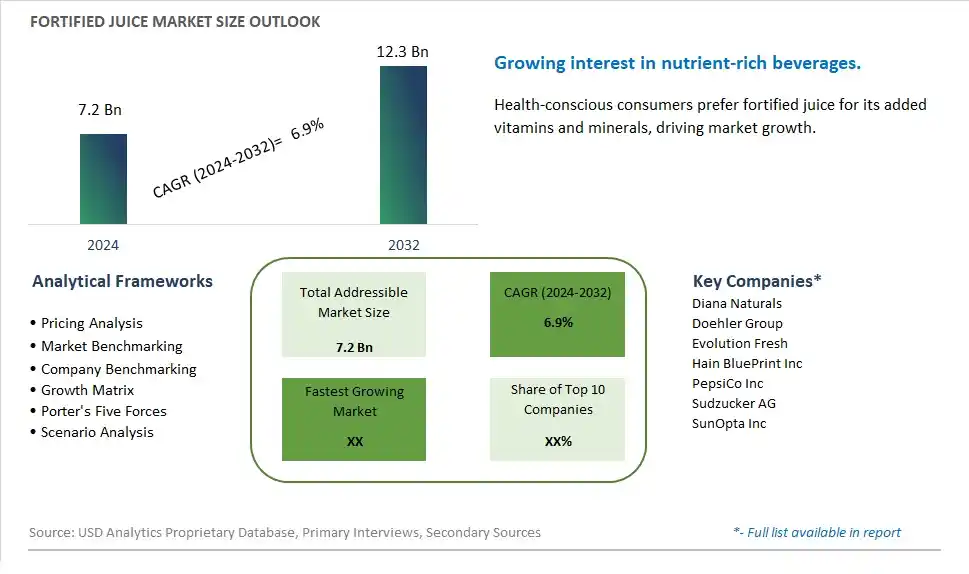
Global Fortified Juice Market Size is valued at $7.2 Billion in 2024 and is forecast to register a growth rate (CAGR) of 6.9% to reach $12.3 Billion by 2032.
The global Fortified Juice Market Comprehensive Study analyzes and forecasts the market size across 6 regions and 24 countries for diverse segments -By Type (Vitamins, Minerals, Probiotics, Prebiotics, Others), By Application (Supermarkets/Hypermarkets, Convenience Stores, Others)
An Introduction to Fortified Juice Market
In 2024, the Fortified Juice market is thriving, fueled by the rising demand for beverages that provide essential vitamins and minerals. Fortified juices, enriched with nutrients such as vitamin C, calcium, and iron, are popular among health-conscious consumers and those looking to improve their nutritional intake. The market benefits from advancements in juice fortification and processing technologies, the growing trend of health-conscious consumption, and the expansion of the functional beverage sector. Additionally, the increasing awareness of the health benefits of fortified juices is contributing to market growth.
Fortified Juice Competitive Landscape
The market report analyses the leading companies in the industry including Diana Naturals, Doehler Group, Evolution Fresh, Hain BluePrint Inc, PepsiCo Inc, Sudzucker AG, SunOpta Inc, and Others.
Fortified Juice Market Dynamics
Fortified Juice Market Trend: Growing Popularity of Functional Beverages
The most prominent trend in the Fortified Juice Market is the growing popularity of functional beverages. Consumers are increasingly seeking juices that offer additional health benefits, such as improved nutrition, enhanced energy, and better overall wellness. This trend is driven by the health and wellness movement, which emphasizes the role of fortified juices in addressing dietary deficiencies and supporting a healthy lifestyle.
Fortified Juice Market Driver: Increase in Health-Conscious Consumers
The key driver of the Fortified Juice Market is the increase in health-conscious consumers. As more people focus on their health and dietary choices, there is a higher demand for juices that provide added nutritional value. Fortified juices, which incorporate vitamins, minerals, and other beneficial ingredients, offer a convenient way for consumers to enhance their nutrient intake and support their health goals, driving market growth.
Fortified Juice Market Opportunity: Development of Plant-Based and Organic Fortified Juices
A significant opportunity in the Fortified Juice Market lies in the development of plant-based and organic fortified juices. As consumer preferences shift towards natural and plant-based products, there is potential for creating fortified juices that align with these trends. By offering juices fortified with natural ingredients, such as plant extracts, superfoods, and organic nutrients, companies can attract health-conscious consumers and expand their market reach.
Fortified Juice Market Share Analysis: Vitamins segment generated the highest revenue share in the industry
The Vitamins segment stands out as the largest category in the Fortified Juice market. This segment's prominence is driven by increasing consumer awareness and preference for beverages that offer added health benefits beyond basic nutrition. Fortified juices enriched with vitamins are particularly popular among health-conscious consumers seeking convenient ways to boost their daily intake of essential nutrients. Vitamins play a crucial role in supporting overall health, including immune function, energy metabolism, and skin health, among others. As lifestyles become more hectic, consumers are looking for beverages that not only quench thirst but also provide tangible health benefits.The growth of the Vitamins segment is further fueled by innovation in product formulations and packaging, catering to evolving consumer preferences for natural ingredients, reduced sugar content, and functional benefits. Manufacturers are leveraging advanced technologies to enhance the bioavailability and stability of vitamins in fortified juices, ensuring maximum efficacy and consumer satisfaction. Further, strategic marketing campaigns emphasizing the health-promoting properties of fortified juices are expanding consumer reach and driving adoption across various demographic segments. Looking ahead, the Vitamins segment is poised to maintain its dominance in the Fortified Juice market, driven by ongoing innovations and heightened consumer demand for functional beverages that support overall well-being.
Fortified Juice Market Share Analysis: Convenience Stores is the fastest growing segment over the forecast period to 2032
The Convenience Stores segment emerges as the fastest growing category in the Fortified Juice market. This trend is driven by changing consumer lifestyles characterized by busier schedules and increased demand for on-the-go nutrition solutions. Convenience stores offer a convenient shopping experience with extended operating hours and quick access to a variety of fortified juice options. Consumers are increasingly opting for fortified juices at convenience stores due to their accessibility, especially during rushed mornings or quick breaks throughout the day. The growth of fortified juices in convenience stores is supported by strategic partnerships between juice manufacturers and convenience store chains, enhancing product visibility and availability in high-traffic locations. Additionally, marketing efforts focused on promoting the health benefits of fortified juices, such as enhanced immunity and energy boost, resonate well with convenience store shoppers seeking functional beverages. As convenience stores continue to evolve their offerings to meet consumer demands for healthier alternatives and grab-and-go options, the fortified juice segment is expected to experience robust growth. This expansion is also driven by innovations in packaging formats that cater to convenience store settings, ensuring freshness and appeal to busy consumers looking for nutritious beverage choices on the move.
Fortified Juice Market Segmentation
By Type
Vitamins
Minerals
Probiotics
Prebiotics
Others
By Application
Supermarkets/Hypermarkets
Convenience Stores
Others
Countries Analyzed
North America (US, Canada, Mexico)
Europe (Germany, UK, France, Spain, Italy, Russia, Rest of Europe)
Asia Pacific (China, India, Japan, South Korea, Australia, South East Asia, Rest of Asia)
South America (Brazil, Argentina, Rest of South America)
Middle East and Africa (Saudi Arabia, UAE, Rest of Middle East, South Africa, Egypt, Rest of Africa)
Fortified Juice Companies Profiled in the Study
Diana Naturals
Doehler Group
Evolution Fresh
Hain BluePrint Inc
PepsiCo Inc
Sudzucker AG
SunOpta Inc
*- List Not Exhaustive
Chapter 1. TABLE OF CONTENTS
Chapter 2. Introduction to Fortified Juice Market
2.1. Market Overview
2.2. Key Statistics and Report Highlights
2.3. Scope of the Comprehensive Study
2.3.1. Market Definition
2.3.2 Countries and Regions Covered
2.3.3 Research Objective
2.3.4 Units, Currency, and Conversions
2.3.5 Industry Value Chain
2.4. Key Market Segments
2.5. Key Companies
2.6. Study Period
Chapter 3. Strategic Analysis Review
3.1. Fortified Juice Pricing Analysis and Forecast
3.2. Porter’s Five Forces
3.3. Market Ecosystem
3.4. SWOT Analysis
3.5. Regulatory Scenario
3.3. Effects of Inflation, Russia-Ukraine War, moderating economic growth, and other macroeconomic factors
Chapter 4. Competitive Landscape
4.1. Market Share Analysis
4.1.1. Global Fortified Juice Market Share by Company, 2023
4.1.2. Product Offerings of Leading Fortified Juice Companies
4.2. Market Entropy
4.2.1. New Product Launches in the Industry
4.2.2. Mergers, Acquisitions, Joint ventures, and Partnerships
4.3. Key Strategies and Best Practices
Chapter 5. Global Market Projections: Best, Reference, and Low Case Scenarios
5.1. Growth Analysis- Case Scenario Definitions
5.2. Low Growth Case Scenario Forecasts
5.3. Reference Growth Case Scenario Forecasts
5.4. High Growth Case Scenario Forecasts
Chapter 6. Market Dynamics
6.1. Fortified Juice Market Drivers
6.2. Fortified Juice Market Challenges
6.6. Fortified Juice Market Opportunities
6.4. Fortified Juice Market Trends
Chapter 7. Global Fortified Juice Market Outlook Trends
7.1. Global Fortified Juice Revenue (USD Million) and CAGR (%) by Type (2021-2032)
7.2. Global Fortified Juice Revenue (USD Million) and CAGR (%) by Application (2021-2032)
7.3. Global Fortified Juice Revenue (USD Million) and CAGR (%) by Product (2021-2032)
By Type
Vitamins
Minerals
Probiotics
Prebiotics
Others
By Application
Supermarkets/Hypermarkets
Convenience Stores
Others
Chapter 8. Global Fortified Juice Regional Analysis and Outlook
8.1. Global Fortified Juice Revenue (USD Million) By Regions (2021- 2032)
8.2. North America Fortified Juice Revenue (USD Million) by Country (2021-2032)
8.2.1. United States Fortified Juice Regional Analysis and Outlook
8.2.2. Canada Fortified Juice Regional Analysis and Outlook
8.2.3. Mexico Fortified Juice Regional Analysis and Outlook
8.3. Europe Fortified Juice Revenue (USD Million), by Country (2021-2032)
8.3.1. Germany Fortified Juice Regional Analysis and Outlook
8.3.2. France Fortified Juice Regional Analysis and Outlook
8.3.3. United Kingdom Fortified Juice Regional Analysis and Outlook
8.3.4. Spain Fortified Juice Regional Analysis and Outlook
8.3.5. Italy Fortified Juice Regional Analysis and Outlook
8.3.6. Russia Fortified Juice Regional Analysis and Outlook
8.3.7. Rest of Europe Fortified Juice Regional Analysis and Outlook
8.4. Asia Pacific Fortified Juice Revenue (USD Million) by Country (2021-2032)
8.4.1. China Fortified Juice Regional Analysis and Outlook
8.4.2. Japan Fortified Juice Regional Analysis and Outlook
8.4.3. India Fortified Juice Regional Analysis and Outlook
8.4.4. South Korea Fortified Juice Regional Analysis and Outlook
8.4.5. Australia Fortified Juice Regional Analysis and Outlook
8.4.6. South East Asia Fortified Juice Regional Analysis and Outlook
8.4.7. Rest of Asia Pacific Fortified Juice Regional Analysis and Outlook
8.5. South America Fortified Juice Revenue (USD Million), by Country (2021-2032)
8.5.1. Brazil Fortified Juice Regional Analysis and Outlook
8.5.2. Argentina Fortified Juice Regional Analysis and Outlook
8.5.3. Rest of South America Fortified Juice Regional Analysis and Outlook
8.6. Middle East and Africa Fortified Juice Revenue (USD Million) by Country (2021-2032)
8.6.1. Middle East Fortified Juice Regional Analysis and Outlook
8.6.2. Africa Fortified Juice Regional Analysis and Outlook
Chapter 9. North America Fortified Juice Analysis and Outlook
9.1. North America Fortified Juice Revenue (USD Million) by Segments (2021-2032)
9.1.1. North America Fortified Juice Revenue (USD Million) by Type (2021-2032)
9.1.2. North America Fortified Juice Revenue (USD Million) by Application (2021-2032)
9.1.3. North America Fortified Juice Revenue (USD Million) by Product (2021-2032)
By Type
Vitamins
Minerals
Probiotics
Prebiotics
Others
By Application
Supermarkets/Hypermarkets
Convenience Stores
Others
Chapter 10. Europe Fortified Juice Analysis and Outlook
10.1. Europe Fortified Juice Revenue (USD Million), by Segments (USD Million) (2021-2032)
10.1.1. Europe Fortified Juice Revenue (USD Million) by Type (2021-2032)
10.1.2. Europe Fortified Juice Revenue (USD Million) by Application (2021-2032)
10.1.3. Europe Fortified Juice Revenue (USD Million) by Product (2021-2032)
By Type
Vitamins
Minerals
Probiotics
Prebiotics
Others
By Application
Supermarkets/Hypermarkets
Convenience Stores
Others
Chapter 11. Asia Pacific Fortified Juice Analysis and Outlook
11.1. Asia Pacific Fortified Juice Revenue (USD Million), and Revenue (USD Million) by Segments (2021-2032)
11.1.1. Asia Pacific Fortified Juice Revenue (USD Million) by Type (2021-2032)
11.1.2. Asia Pacific Fortified Juice Revenue (USD Million) by Application (2021-2032)
11.1.3. Asia Pacific Fortified Juice Revenue (USD Million) by Product (2021-2032)
By Type
Vitamins
Minerals
Probiotics
Prebiotics
Others
By Application
Supermarkets/Hypermarkets
Convenience Stores
Others
Chapter 12. South America Fortified Juice Analysis and Outlook
12.1. South America Fortified Juice Revenue (USD Million), by Segments (2021-2032)
12.1.1. South America Fortified Juice Revenue (USD Million) by Type (2021-2032)
12.1.2. South America Fortified Juice Revenue (USD Million) by Application (2021-2032)
12.1.3. South America Fortified Juice Revenue (USD Million) by Product (2021-2032)
By Type
Vitamins
Minerals
Probiotics
Prebiotics
Others
By Application
Supermarkets/Hypermarkets
Convenience Stores
Others
Chapter 13. Middle East and Africa Fortified Juice Analysis and Outlook
13.1. Middle East and Africa Fortified Juice Revenue (USD Million), by Segments (2021-2032)
13.1.1. Middle East and Africa Fortified Juice Revenue (USD Million) by Type (2021-2032)
13.1.2. Middle East and Africa Fortified Juice Revenue (USD Million) by Application (2021-2032)
13.1.3. Middle East and Africa Fortified Juice Revenue (USD Million) by Product (2021-2032)
By Type
Vitamins
Minerals
Probiotics
Prebiotics
Others
By Application
Supermarkets/Hypermarkets
Convenience Stores
Others
Chapter 14. Fortified Juice Company Profiles
14.1 Business Overview
14.2 Product Profiles
14.3 SWOT Profiles
14.5 Recent Developments
14.6 Financial Profile
List of Companies
Diana Naturals
Doehler Group
Evolution Fresh
Hain BluePrint Inc
PepsiCo Inc
Sudzucker AG
SunOpta Inc
15. Methodology and Data Sources
15.1 Customization Offerings
15.2 Subscription Services
15.3 Related Reports
15.4 Publisher Expertise
LIST OF TABLES
Table 1 Market Segmentation Analysis
Table 2 Global Fortified Juice Market Share of Leading Companies, 2023
Table 3 Product Offerings of Leading Companies
Table 4 Low Growth Scenario Forecasts
Table 5 Reference Case Growth Scenario
Table 6 High Growth Case Scenario
Table 7 Global Fortified Juice Revenue (USD Million) And CAGR (%) By Type (2021-2032)
Table 8 Global Fortified Juice Revenue (USD Million) And CAGR (%) By Application (2021-2032)
Table 9 Global Fortified Juice Revenue (USD Million) And CAGR (%) By Product (2021-2032)
Table 10 Global Fortified Juice Market Revenue (USD Million) By Regions (2021-2032)
Table 11 Global Fortified Juice Market Share (%) By Regions (2021-2032)
Table 12 North America Fortified Juice Revenue (USD Million) By Country (2021-2032)
Table 13 Europe Fortified Juice Revenue (USD Million) By Country (2021-2032)
Table 14 Asia Pacific Fortified Juice Revenue (USD Million) By Country (2021-2032)
Table 15 South America Fortified Juice Revenue (USD Million) By Country (2021-2032)
Table 16 Middle East and Africa Fortified Juice Revenue (USD Million) By Region (2021-2032)
Table 17 North America Fortified Juice Revenue (USD Million) By Type (2021-2032)
Table 18 North America Fortified Juice Revenue (USD Million) By Application (2021-2032)
Table 19 North America Fortified Juice Revenue (USD Million) By Product (2021-2032)
Table 20 Europe Fortified Juice Revenue (USD Million) By Type (2021-2032)
Table 21 Europe Fortified Juice Revenue (USD Million) By Application (2021-2032)
Table 22 Europe Fortified Juice Revenue (USD Million) By Product (2021-2032)
Table 23 Asia Pacific Fortified Juice Revenue (USD Million) By Type (2021-2032)
Table 24 Asia Pacific Fortified Juice Revenue (USD Million) By Application (2021-2032)
Table 25 Asia Pacific Fortified Juice Revenue (USD Million) By Product (2021-2032)
Table 26 South America Fortified Juice Revenue (USD Million) By Type (2021-2032)
Table 27 South America Fortified Juice Revenue (USD Million) By Application (2021-2032)
Table 28 South America Fortified Juice Revenue (USD Million) By Product (2021-2032)
Table 29 Middle East and Africa Fortified Juice Revenue (USD Million) By Type (2021-2032)
Table 30 Middle East and Africa Fortified Juice Revenue (USD Million) By Application (2021-2032)
Table 31 Middle East and Africa Fortified Juice Revenue (USD Million) By Product (2021-2032)
LIST OF FIGURES
Figure 1. Market Scope
Figure 2. Pricing Forecasts Per Unit, 2023- 2032
Figure 3. Porter’s Five Forces
Figure 4. Global Fortified Juice Market Revenue (USD Million) By Regions (2021-2032)
Figure 5. Global Fortified Juice Market Share (%) By Regions (2023)
Figure 6. North America Fortified Juice Revenue (USD Million) By Country (2021-2032)
Figure 7. United States Fortified Juice Revenue (USD Million) By Country (2021-2032)
Figure 8. Canada Fortified Juice Revenue (USD Million) By Country (2021-2032)
Figure 9. Mexico Fortified Juice Revenue (USD Million) By Country (2021-2032)
Figure 10. Europe Fortified Juice Revenue (USD Million) By Country (2021-2032)
Figure 11. Germany Fortified Juice Revenue (USD Million) By Country (2021-2032)
Figure 12. France Fortified Juice Revenue (USD Million) By Country (2021-2032)
Figure 13. United Kingdom Fortified Juice Revenue (USD Million) By Country (2021-2032)
Figure 14. Spain Fortified Juice Revenue (USD Million) By Country (2021-2032)
Figure 15. Italy Fortified Juice Revenue (USD Million) By Country (2021-2032)
Figure 16. Russia Fortified Juice Revenue (USD Million) By Country (2021-2032)
Figure 17. Rest of Europe Fortified Juice Revenue (USD Million) By Country (2021-2032)
Figure 11. Asia Pacific Fortified Juice Revenue (USD Million) By Country (2021-2032)
Figure 12. China Fortified Juice Revenue (USD Million) By Country (2021-2032)
Figure 13. Japan Fortified Juice Revenue (USD Million) By Country (2021-2032)
Figure 14. India Fortified Juice Revenue (USD Million) By Country (2021-2032)
Figure 15. South Korea Fortified Juice Revenue (USD Million) By Country (2021-2032)
Figure 16. Australia Fortified Juice Revenue (USD Million) By Country (2021-2032)
Figure 17. South East Asia Fortified Juice Revenue (USD Million) By Country (2021-2032)
Figure 18. South America Fortified Juice Revenue (USD Million) By Country (2021-2032)
Figure 19. Brazil Fortified Juice Revenue (USD Million) By Country (2021-2032)
Figure 20. Argentina Fortified Juice Revenue (USD Million) By Country (2021-2032)
Figure 21. Rest of Asia Pacific Fortified Juice Revenue (USD Million) By Country (2021-2032)
Figure 22. Middle East and Africa Fortified Juice Revenue (USD Million) By Region (2021-2032)
Figure 23. Saudi Arabia Fortified Juice Revenue (USD Million) By Region (2021-2032)
Figure 24. The UAE Fortified Juice Revenue (USD Million) By Region (2021-2032)
Figure 25. Rest of Middle East Fortified Juice Revenue (USD Million) By Region (2021-2032)
Figure 26. South Africa Fortified Juice Revenue (USD Million) By Region (2021-2032)
Figure 27. Africa Fortified Juice Revenue (USD Million) By Region (2021-2032)
Figure 28. North America Fortified Juice Revenue (USD Million) By Type (2021-2032)
Figure 29. North America Fortified Juice Revenue (USD Million) By Application (2021-2032)
Figure 30. North America Fortified Juice Revenue (USD Million) By Product (2021-2032)
Figure 31. Europe Fortified Juice Revenue (USD Million) By Type (2021-2032)
Figure 32. Europe Fortified Juice Revenue (USD Million) By Application (2021-2032)
Figure 33. Europe Fortified Juice Revenue (USD Million) By Product (2021-2032)
Figure 34. Asia Pacific Fortified Juice Revenue (USD Million) By Type (2021-2032)
Figure 35. Asia Pacific Fortified Juice Revenue (USD Million) By Application (2021-2032)
Figure 36. Asia Pacific Fortified Juice Revenue (USD Million) By Product (2021-2032)
Figure 37. South America Fortified Juice Revenue (USD Million) By Type (2021-2032)
Figure 38. South America Fortified Juice Revenue (USD Million) By Application (2021-2032)
Figure 39. South America Fortified Juice Revenue (USD Million) By Product (2021-2032)
Figure 40. Middle East and Africa Fortified Juice Revenue (USD Million) By Type (2021-2032)
Figure 41. Middle East and Africa Fortified Juice Revenue (USD Million) By Application (2021-2032)
Figure 42. Middle East and Africa Fortified Juice Revenue (USD Million) By Product (2021-2032)
By Type
Vitamins
Minerals
Probiotics
Prebiotics
Others
By Application
Supermarkets/Hypermarkets
Convenience Stores
Others
Countries Analyzed
North America (US, Canada, Mexico)
Europe (Germany, UK, France, Spain, Italy, Russia, Rest of Europe)
Asia Pacific (China, India, Japan, South Korea, Australia, South East Asia, Rest of Asia)
South America (Brazil, Argentina, Rest of South America)
Middle East and Africa (Saudi Arabia, UAE, Rest of Middle East, South Africa, Egypt, Rest of Africa)
