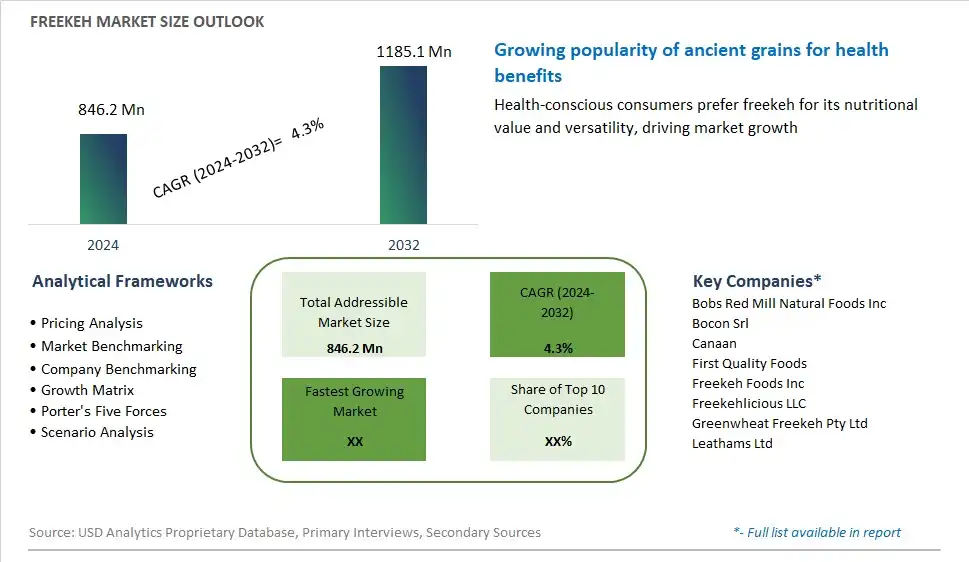
Global Freekeh Market Size is valued at $846.2 Million in 2024 and is forecast to register a growth rate (CAGR) of 4.3% to reach $1185.1 Million by 2032.
The global Freekeh Market Comprehensive Study analyzes and forecasts the market size across 6 regions and 24 countries for diverse segments -By Product (Wholegrain, Cracked)
An Introduction to Freekeh Market
Freekeh, an ancient grain with origins in Middle Eastern cuisine, is gaining popularity as a nutritious and flavorful superfood in 2024. Freekeh is made from green durum wheat that is harvested while still young, then roasted and cracked to create a nutty, smoky-flavored grain. Rich in protein, fiber, vitamins, and minerals, freekeh offers a host of health benefits, including improved digestion, blood sugar regulation, and satiety. Moreover, freekeh's low glycemic index and high antioxidant content make it particularly suitable for individuals with diabetes or those seeking to maintain stable energy levels throughout the day. With its unique texture and robust flavor, freekeh is a versatile ingredient that can be used in a variety of dishes, from salads and pilafs to soups and stews. Additionally, freekeh's sustainable farming practices and minimal processing make it an environmentally
Freekeh Competitive Landscape
The market report analyses the leading companies in the industry including Bobs Red Mill Natural Foods Inc, Bocon Srl, Canaan, First Quality Foods, Freekeh Foods Inc, Freekehlicious LLC, Greenwheat Freekeh Pty Ltd, Leathams Ltd, and Others.
Freekeh Market Dynamics
Freekeh Market Trend: Growing Interest in Ancient Grains and Alternative Superfoods
A prominent trend in the freekeh market is the growing interest in ancient grains and alternative superfoods, driven by increasing consumer awareness of the nutritional benefits and culinary versatility of traditional, minimally processed grains. Freekeh, an ancient grain made from green durum wheat that is harvested while young, roasted, and cracked, has gained popularity as a nutrient-rich whole grain with a unique smoky flavor and chewy texture. As consumers seek out healthier and more diverse dietary options, there's a growing appreciation for ancient grains like freekeh, which offer higher levels of protein, fiber, vitamins, and minerals compared to refined grains. This trend reflects a broader movement towards whole foods, plant-based diets, and sustainable agriculture, driving market growth and innovation in the freekeh segment as consumers incorporate ancient grains into their everyday meals and recipes.
Market Driver: Increasing Demand for Plant-Based Protein Sources
A key driver of the freekeh market is the increasing demand for plant-based protein sources, fueled by growing consumer interest in sustainable eating, vegetarian and vegan diets, and alternative protein options. Freekeh is valued for its high protein content, making it a popular choice for individuals looking to reduce their meat consumption while still meeting their nutritional needs. With rising concerns about the environmental impact of animal agriculture, as well as ethical considerations related to animal welfare and health, there's a shift towards plant-centric diets that prioritize protein-rich plant foods like freekeh. Moreover, freekeh's versatility in culinary applications, including salads, pilafs, soups, and baked goods, appeals to a wide range of dietary preferences and cultural cuisines, driving its adoption as a staple ingredient in plant-based cooking and meal planning.
Market Opportunity: Expansion into Functional Food and Snack Applications
An opportunity for growth in the freekeh market lies in the expansion into functional food and snack applications that capitalize on its nutritional benefits, taste profile, and culinary versatility. Beyond traditional uses in savory dishes, there's potential to develop value-added freekeh products targeting the functional food and snack markets. For example, freekeh-based energy bars, granola clusters, and snack mixes offer convenient, on-the-go options for consumers seeking wholesome, protein-rich snacks that provide sustained energy and satiety. Additionally, there's an opportunity to explore innovative formulations and flavor profiles that appeal to specific consumer segments, such as gluten-free, organic, or non-GMO varieties, as well as ethnic-inspired snacks that cater to diverse taste preferences and cultural traditions. By leveraging consumer demand for nutritious, convenient foods and snacks, freekeh producers can expand their product offerings and market reach, positioning freekeh as a versatile and nutritious ingredient in the evolving landscape of functional foods and plant-based snacks.
Freekeh Market Share Analysis: Wholegrain held the dominant market share in 2024
In the Freekeh Market, the Wholegrain segment is the largest due to several factors driving its dominance. Wholegrain freekeh retains the entire kernel, including the bran, germ, and endosperm, offering consumers a higher nutritional value compared to cracked freekeh. Wholegrain freekeh is rich in fiber, protein, vitamins, and minerals, making it a popular choice among health-conscious consumers seeking nutritious whole foods. Further, wholegrain freekeh has a nutty flavor and chewy texture, making it versatile for use in various culinary applications, including pilafs, salads, soups, and side dishes. Additionally, wholegrain freekeh's longer cooking time and hearty texture contribute to its appeal as a satisfying and filling ingredient in meals. Furthermore, the growing consumer awareness of the health benefits associated with whole grains, coupled with increasing demand for natural and minimally processed foods, further drives the dominance of the Wholegrain segment in the Freekeh Market. Consequently, the Wholegrain segment maintains its leadership position, driven by its superior nutritional profile, culinary versatility, and growing consumer preference for whole foods.
Freekeh Market Segmentation
By Product
Wholegrain
Cracked
Countries Analyzed
North America (US, Canada, Mexico)
Europe (Germany, UK, France, Spain, Italy, Russia, Rest of Europe)
Asia Pacific (China, India, Japan, South Korea, Australia, South East Asia, Rest of Asia)
South America (Brazil, Argentina, Rest of South America)
Middle East and Africa (Saudi Arabia, UAE, Rest of Middle East, South Africa, Egypt, Rest of Africa)
Freekeh Companies Profiled in the Study
Bobs Red Mill Natural Foods Inc
Bocon Srl
Canaan
First Quality Foods
Freekeh Foods Inc
Freekehlicious LLC
Greenwheat Freekeh Pty Ltd
Leathams Ltd
*- List Not Exhaustive
Chapter 1. TABLE OF CONTENTS
Chapter 2. Introduction to Freekeh Market
2.1. Market Overview
2.2. Key Statistics and Report Highlights
2.3. Scope of the Comprehensive Study
2.3.1. Market Definition
2.3.2 Countries and Regions Covered
2.3.3 Research Objective
2.3.4 Units, Currency, and Conversions
2.3.5 Industry Value Chain
2.4. Key Market Segments
2.5. Key Companies
2.6. Study Period
Chapter 3. Strategic Analysis Review
3.1. Freekeh Pricing Analysis and Forecast
3.2. Porter’s Five Forces
3.3. Market Ecosystem
3.4. SWOT Analysis
3.5. Regulatory Scenario
3.3. Effects of Inflation, Russia-Ukraine War, moderating economic growth, and other macroeconomic factors
Chapter 4. Competitive Landscape
4.1. Market Share Analysis
4.1.1. Global Freekeh Market Share by Company, 2023
4.1.2. Product Offerings of Leading Freekeh Companies
4.2. Market Entropy
4.2.1. New Product Launches in the Industry
4.2.2. Mergers, Acquisitions, Joint ventures, and Partnerships
4.3. Key Strategies and Best Practices
Chapter 5. Global Market Projections: Best, Reference, and Low Case Scenarios
5.1. Growth Analysis- Case Scenario Definitions
5.2. Low Growth Case Scenario Forecasts
5.3. Reference Growth Case Scenario Forecasts
5.4. High Growth Case Scenario Forecasts
Chapter 6. Market Dynamics
6.1. Freekeh Market Drivers
6.2. Freekeh Market Challenges
6.6. Freekeh Market Opportunities
6.4. Freekeh Market Trends
Chapter 7. Global Freekeh Market Outlook Trends
7.1. Global Freekeh Revenue (USD Million) and CAGR (%) by Type (2021-2032)
7.2. Global Freekeh Revenue (USD Million) and CAGR (%) by Application (2021-2032)
7.3. Global Freekeh Revenue (USD Million) and CAGR (%) by Product (2021-2032)
By Product
Wholegrain
Cracked
Chapter 8. Global Freekeh Regional Analysis and Outlook
8.1. Global Freekeh Revenue (USD Million) By Regions (2021- 2032)
8.2. North America Freekeh Revenue (USD Million) by Country (2021-2032)
8.2.1. United States Freekeh Regional Analysis and Outlook
8.2.2. Canada Freekeh Regional Analysis and Outlook
8.2.3. Mexico Freekeh Regional Analysis and Outlook
8.3. Europe Freekeh Revenue (USD Million), by Country (2021-2032)
8.3.1. Germany Freekeh Regional Analysis and Outlook
8.3.2. France Freekeh Regional Analysis and Outlook
8.3.3. United Kingdom Freekeh Regional Analysis and Outlook
8.3.4. Spain Freekeh Regional Analysis and Outlook
8.3.5. Italy Freekeh Regional Analysis and Outlook
8.3.6. Russia Freekeh Regional Analysis and Outlook
8.3.7. Rest of Europe Freekeh Regional Analysis and Outlook
8.4. Asia Pacific Freekeh Revenue (USD Million) by Country (2021-2032)
8.4.1. China Freekeh Regional Analysis and Outlook
8.4.2. Japan Freekeh Regional Analysis and Outlook
8.4.3. India Freekeh Regional Analysis and Outlook
8.4.4. South Korea Freekeh Regional Analysis and Outlook
8.4.5. Australia Freekeh Regional Analysis and Outlook
8.4.6. South East Asia Freekeh Regional Analysis and Outlook
8.4.7. Rest of Asia Pacific Freekeh Regional Analysis and Outlook
8.5. South America Freekeh Revenue (USD Million), by Country (2021-2032)
8.5.1. Brazil Freekeh Regional Analysis and Outlook
8.5.2. Argentina Freekeh Regional Analysis and Outlook
8.5.3. Rest of South America Freekeh Regional Analysis and Outlook
8.6. Middle East and Africa Freekeh Revenue (USD Million) by Country (2021-2032)
8.6.1. Middle East Freekeh Regional Analysis and Outlook
8.6.2. Africa Freekeh Regional Analysis and Outlook
Chapter 9. North America Freekeh Analysis and Outlook
9.1. North America Freekeh Revenue (USD Million) by Segments (2021-2032)
9.1.1. North America Freekeh Revenue (USD Million) by Type (2021-2032)
9.1.2. North America Freekeh Revenue (USD Million) by Application (2021-2032)
9.1.3. North America Freekeh Revenue (USD Million) by Product (2021-2032)
By Product
Wholegrain
Cracked
Chapter 10. Europe Freekeh Analysis and Outlook
10.1. Europe Freekeh Revenue (USD Million), by Segments (USD Million) (2021-2032)
10.1.1. Europe Freekeh Revenue (USD Million) by Type (2021-2032)
10.1.2. Europe Freekeh Revenue (USD Million) by Application (2021-2032)
10.1.3. Europe Freekeh Revenue (USD Million) by Product (2021-2032)
By Product
Wholegrain
Cracked
Chapter 11. Asia Pacific Freekeh Analysis and Outlook
11.1. Asia Pacific Freekeh Revenue (USD Million), and Revenue (USD Million) by Segments (2021-2032)
11.1.1. Asia Pacific Freekeh Revenue (USD Million) by Type (2021-2032)
11.1.2. Asia Pacific Freekeh Revenue (USD Million) by Application (2021-2032)
11.1.3. Asia Pacific Freekeh Revenue (USD Million) by Product (2021-2032)
By Product
Wholegrain
Cracked
Chapter 12. South America Freekeh Analysis and Outlook
12.1. South America Freekeh Revenue (USD Million), by Segments (2021-2032)
12.1.1. South America Freekeh Revenue (USD Million) by Type (2021-2032)
12.1.2. South America Freekeh Revenue (USD Million) by Application (2021-2032)
12.1.3. South America Freekeh Revenue (USD Million) by Product (2021-2032)
By Product
Wholegrain
Cracked
Chapter 13. Middle East and Africa Freekeh Analysis and Outlook
13.1. Middle East and Africa Freekeh Revenue (USD Million), by Segments (2021-2032)
13.1.1. Middle East and Africa Freekeh Revenue (USD Million) by Type (2021-2032)
13.1.2. Middle East and Africa Freekeh Revenue (USD Million) by Application (2021-2032)
13.1.3. Middle East and Africa Freekeh Revenue (USD Million) by Product (2021-2032)
By Product
Wholegrain
Cracked
Chapter 14. Freekeh Company Profiles
14.1 Business Overview
14.2 Product Profiles
14.3 SWOT Profiles
14.5 Recent Developments
14.6 Financial Profile
List of Companies
Bobs Red Mill Natural Foods Inc
Bocon Srl
Canaan
First Quality Foods
Freekeh Foods Inc
Freekehlicious LLC
Greenwheat Freekeh Pty Ltd
Leathams Ltd
15. Methodology and Data Sources
15.1 Customization Offerings
15.2 Subscription Services
15.3 Related Reports
15.4 Publisher Expertise
LIST OF TABLES
Table 1 Market Segmentation Analysis
Table 2 Global Freekeh Market Share of Leading Companies, 2023
Table 3 Product Offerings of Leading Companies
Table 4 Low Growth Scenario Forecasts
Table 5 Reference Case Growth Scenario
Table 6 High Growth Case Scenario
Table 7 Global Freekeh Revenue (USD Million) And CAGR (%) By Type (2021-2032)
Table 8 Global Freekeh Revenue (USD Million) And CAGR (%) By Application (2021-2032)
Table 9 Global Freekeh Revenue (USD Million) And CAGR (%) By Product (2021-2032)
Table 10 Global Freekeh Market Revenue (USD Million) By Regions (2021-2032)
Table 11 Global Freekeh Market Share (%) By Regions (2021-2032)
Table 12 North America Freekeh Revenue (USD Million) By Country (2021-2032)
Table 13 Europe Freekeh Revenue (USD Million) By Country (2021-2032)
Table 14 Asia Pacific Freekeh Revenue (USD Million) By Country (2021-2032)
Table 15 South America Freekeh Revenue (USD Million) By Country (2021-2032)
Table 16 Middle East and Africa Freekeh Revenue (USD Million) By Region (2021-2032)
Table 17 North America Freekeh Revenue (USD Million) By Type (2021-2032)
Table 18 North America Freekeh Revenue (USD Million) By Application (2021-2032)
Table 19 North America Freekeh Revenue (USD Million) By Product (2021-2032)
Table 20 Europe Freekeh Revenue (USD Million) By Type (2021-2032)
Table 21 Europe Freekeh Revenue (USD Million) By Application (2021-2032)
Table 22 Europe Freekeh Revenue (USD Million) By Product (2021-2032)
Table 23 Asia Pacific Freekeh Revenue (USD Million) By Type (2021-2032)
Table 24 Asia Pacific Freekeh Revenue (USD Million) By Application (2021-2032)
Table 25 Asia Pacific Freekeh Revenue (USD Million) By Product (2021-2032)
Table 26 South America Freekeh Revenue (USD Million) By Type (2021-2032)
Table 27 South America Freekeh Revenue (USD Million) By Application (2021-2032)
Table 28 South America Freekeh Revenue (USD Million) By Product (2021-2032)
Table 29 Middle East and Africa Freekeh Revenue (USD Million) By Type (2021-2032)
Table 30 Middle East and Africa Freekeh Revenue (USD Million) By Application (2021-2032)
Table 31 Middle East and Africa Freekeh Revenue (USD Million) By Product (2021-2032)
LIST OF FIGURES
Figure 1. Market Scope
Figure 2. Pricing Forecasts Per Unit, 2023- 2032
Figure 3. Porter’s Five Forces
Figure 4. Global Freekeh Market Revenue (USD Million) By Regions (2021-2032)
Figure 5. Global Freekeh Market Share (%) By Regions (2023)
Figure 6. North America Freekeh Revenue (USD Million) By Country (2021-2032)
Figure 7. United States Freekeh Revenue (USD Million) By Country (2021-2032)
Figure 8. Canada Freekeh Revenue (USD Million) By Country (2021-2032)
Figure 9. Mexico Freekeh Revenue (USD Million) By Country (2021-2032)
Figure 10. Europe Freekeh Revenue (USD Million) By Country (2021-2032)
Figure 11. Germany Freekeh Revenue (USD Million) By Country (2021-2032)
Figure 12. France Freekeh Revenue (USD Million) By Country (2021-2032)
Figure 13. United Kingdom Freekeh Revenue (USD Million) By Country (2021-2032)
Figure 14. Spain Freekeh Revenue (USD Million) By Country (2021-2032)
Figure 15. Italy Freekeh Revenue (USD Million) By Country (2021-2032)
Figure 16. Russia Freekeh Revenue (USD Million) By Country (2021-2032)
Figure 17. Rest of Europe Freekeh Revenue (USD Million) By Country (2021-2032)
Figure 11. Asia Pacific Freekeh Revenue (USD Million) By Country (2021-2032)
Figure 12. China Freekeh Revenue (USD Million) By Country (2021-2032)
Figure 13. Japan Freekeh Revenue (USD Million) By Country (2021-2032)
Figure 14. India Freekeh Revenue (USD Million) By Country (2021-2032)
Figure 15. South Korea Freekeh Revenue (USD Million) By Country (2021-2032)
Figure 16. Australia Freekeh Revenue (USD Million) By Country (2021-2032)
Figure 17. South East Asia Freekeh Revenue (USD Million) By Country (2021-2032)
Figure 18. South America Freekeh Revenue (USD Million) By Country (2021-2032)
Figure 19. Brazil Freekeh Revenue (USD Million) By Country (2021-2032)
Figure 20. Argentina Freekeh Revenue (USD Million) By Country (2021-2032)
Figure 21. Rest of Asia Pacific Freekeh Revenue (USD Million) By Country (2021-2032)
Figure 22. Middle East and Africa Freekeh Revenue (USD Million) By Region (2021-2032)
Figure 23. Saudi Arabia Freekeh Revenue (USD Million) By Region (2021-2032)
Figure 24. The UAE Freekeh Revenue (USD Million) By Region (2021-2032)
Figure 25. Rest of Middle East Freekeh Revenue (USD Million) By Region (2021-2032)
Figure 26. South Africa Freekeh Revenue (USD Million) By Region (2021-2032)
Figure 27. Africa Freekeh Revenue (USD Million) By Region (2021-2032)
Figure 28. North America Freekeh Revenue (USD Million) By Type (2021-2032)
Figure 29. North America Freekeh Revenue (USD Million) By Application (2021-2032)
Figure 30. North America Freekeh Revenue (USD Million) By Product (2021-2032)
Figure 31. Europe Freekeh Revenue (USD Million) By Type (2021-2032)
Figure 32. Europe Freekeh Revenue (USD Million) By Application (2021-2032)
Figure 33. Europe Freekeh Revenue (USD Million) By Product (2021-2032)
Figure 34. Asia Pacific Freekeh Revenue (USD Million) By Type (2021-2032)
Figure 35. Asia Pacific Freekeh Revenue (USD Million) By Application (2021-2032)
Figure 36. Asia Pacific Freekeh Revenue (USD Million) By Product (2021-2032)
Figure 37. South America Freekeh Revenue (USD Million) By Type (2021-2032)
Figure 38. South America Freekeh Revenue (USD Million) By Application (2021-2032)
Figure 39. South America Freekeh Revenue (USD Million) By Product (2021-2032)
Figure 40. Middle East and Africa Freekeh Revenue (USD Million) By Type (2021-2032)
Figure 41. Middle East and Africa Freekeh Revenue (USD Million) By Application (2021-2032)
Figure 42. Middle East and Africa Freekeh Revenue (USD Million) By Product (2021-2032)
By Product
Wholegrain
Cracked
Countries Analyzed
North America (US, Canada, Mexico)
Europe (Germany, UK, France, Spain, Italy, Russia, Rest of Europe)
Asia Pacific (China, India, Japan, South Korea, Australia, South East Asia, Rest of Asia)
South America (Brazil, Argentina, Rest of South America)
Middle East and Africa (Saudi Arabia, UAE, Rest of Middle East, South Africa, Egypt, Rest of Africa)
