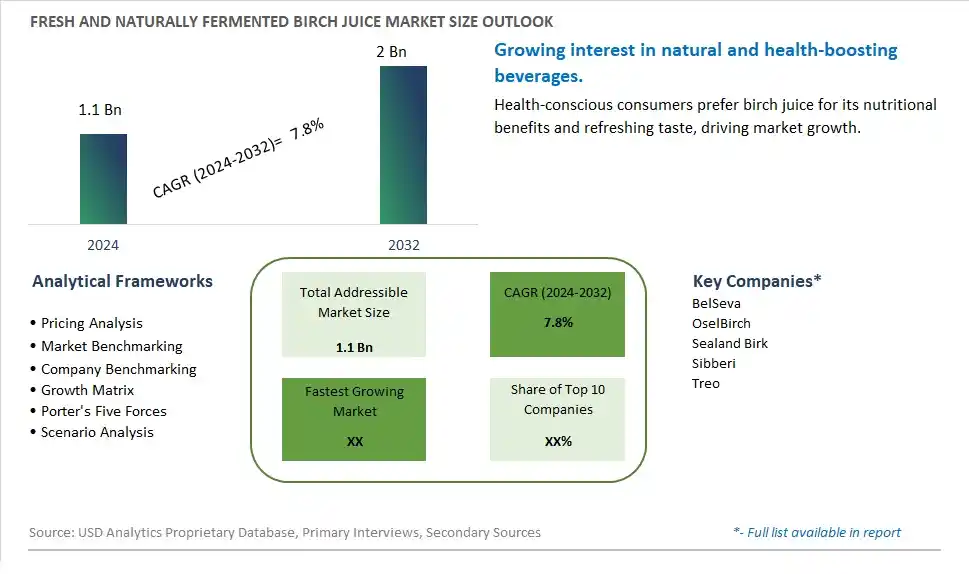
Global Fresh and Naturally Fermented Birch Juice Market Size is valued at $1.1 Billion in 2024 and is forecast to register a growth rate (CAGR) of 7.8% to reach $2 Billion by 2032.
The global Fresh and Naturally Fermented Birch Juice Market Comprehensive Study analyzes and forecasts the market size across 6 regions and 24 countries for diverse segments -By Type (Unflavored, Flavored), By Application (Food and Beverages, Cosmetics and Personal Care, Others)
An Introduction to Fresh and Naturally Fermented Birch Juice Market
In 2024, the Fresh and Naturally Fermented Birch Juice market is witnessing robust growth, driven by the increasing demand for natural and functional beverages. Birch juice, known for its refreshing taste and health benefits, is popular among health-conscious consumers seeking alternative beverages. The market benefits from advancements in fermentation and preservation technologies, the growing trend of natural and organic products, and the expansion of the functional beverage sector. Additionally, the rising awareness of the benefits of fermented beverages for gut health and overall wellness is contributing to market growth.
Fresh and Naturally Fermented Birch Juice Competitive Landscape
The market report analyses the leading companies in the industry including BelSeva, OselBirch, Sealand Birk, Sibberi, Treo, and Others.
Fresh and Naturally Fermented Birch Juice Market Dynamics
Fresh and Naturally Fermented Birch Juice Market Trend: Rising Popularity of Natural and Functional Beverages
The most prominent trend in the Fresh and Naturally Fermented Birch Juice Market is the rising popularity of natural and functional beverages. As consumers seek out drinks that offer health benefits and are made from natural ingredients, birch juice is gaining traction for its unique properties and refreshing taste. This trend is driven by the increasing demand for beverages that provide hydration, detoxification, and overall wellness benefits.
Fresh and Naturally Fermented Birch Juice Market Driver: Growing Awareness of Birch Juice Health Benefits
The key driver of the Fresh and Naturally Fermented Birch Juice Market is the growing awareness of the health benefits associated with birch juice. Known for its high levels of vitamins, minerals, and antioxidants, birch juice is recognized for its potential to support immune function, detoxify the body, and improve skin health. As consumers become more knowledgeable about these benefits, the demand for birch juice as a natural health beverage continues to rise.
Fresh and Naturally Fermented Birch Juice Market Opportunity: Expansion into New Flavors and Product Variants
A significant opportunity in the Fresh and Naturally Fermented Birch Juice Market lies in the expansion into new flavors and product variants. By experimenting with different fermentation processes, flavor infusions, and functional additives, companies can create a diverse range of birch juice products that cater to varying consumer tastes and health needs. This approach can attract a broader audience and increase market penetration, driving growth in the functional beverage sector.
Fresh and Naturally Fermented Birch Juice Market Share Analysis: Flavored segment generated the highest revenue share in the industry
Flavored birch juice is emerging as the largest and fastest-growing segment in the Fresh and Naturally Fermented Birch Juice Market by 2032. The increasing consumer preference for beverages that combine health benefits with pleasant taste profiles is driving the demand for flavored birch juice. This segment offers a variety of taste options, such as berry, citrus, and herbal infusions, which appeal to a broader audience, including those who may find the natural taste of unflavored birch juice too subtle or unfamiliar. The infusion of natural flavors not only enhances the taste but also preserves the health benefits of birch juice, such as detoxification, improved digestion, and rich nutrient content. Additionally, flavored birch juice caters to the growing trend of functional beverages, as consumers seek drinks that offer both refreshment and wellness benefits. Manufacturers are capitalizing on this trend by introducing innovative flavor combinations and marketing them as premium, health-focused products. The increased availability of flavored birch juice in supermarkets, health food stores, and online platforms has also made it more accessible to consumers. With its appealing taste and health advantages, flavored birch juice is set to dominate the market, driving significant growth in the coming years.
Fresh and Naturally Fermented Birch Juice Market Share Analysis: Cosmetics and Personal Care is the fastest growing segment over the forecast period to 2032
The cosmetics and personal care segment is projected to be the fastest-growing application in the Fresh and Naturally Fermented Birch Juice Market by 2032. This growth is driven by the increasing consumer awareness of the natural and organic ingredients in skincare and personal care products. Birch juice is rich in antioxidants, vitamins, and minerals, making it an attractive ingredient for cosmetics manufacturers aiming to cater to the demand for natural and effective skincare solutions. Its hydrating, anti-inflammatory, and rejuvenating properties make it ideal for products such as moisturizers, toners, and serums. The rise of the clean beauty movement, where consumers seek products free from harmful chemicals and synthetic additives, has further propelled the use of birch juice in personal care formulations. Additionally, the trend towards sustainable and eco-friendly products aligns with the natural sourcing of birch juice, appealing to environmentally conscious consumers. Major cosmetic brands are incorporating birch juice into their product lines and promoting its benefits, driving market growth. The segment's expansion is also supported by extensive research and development efforts to enhance the efficacy of birch juice in skincare applications, ensuring that it remains a sought-after ingredient in the cosmetics and personal care industry.
Fresh and Naturally Fermented Birch Juice Market Segmentation
By Type
Unflavored
Flavored
By Application
Food and Beverages
Cosmetics and Personal Care
Others
Countries Analyzed
North America (US, Canada, Mexico)
Europe (Germany, UK, France, Spain, Italy, Russia, Rest of Europe)
Asia Pacific (China, India, Japan, South Korea, Australia, South East Asia, Rest of Asia)
South America (Brazil, Argentina, Rest of South America)
Middle East and Africa (Saudi Arabia, UAE, Rest of Middle East, South Africa, Egypt, Rest of Africa)
Fresh and Naturally Fermented Birch Juice Companies Profiled in the Study
BelSeva
OselBirch
Sealand Birk
Sibberi
Treo
*- List Not Exhaustive
Chapter 1. TABLE OF CONTENTS
Chapter 2. Introduction to Fresh and Naturally Fermented Birch Juice Market
2.1. Market Overview
2.2. Key Statistics and Report Highlights
2.3. Scope of the Comprehensive Study
2.3.1. Market Definition
2.3.2 Countries and Regions Covered
2.3.3 Research Objective
2.3.4 Units, Currency, and Conversions
2.3.5 Industry Value Chain
2.4. Key Market Segments
2.5. Key Companies
2.6. Study Period
Chapter 3. Strategic Analysis Review
3.1. Fresh and Naturally Fermented Birch Juice Pricing Analysis and Forecast
3.2. Porter’s Five Forces
3.3. Market Ecosystem
3.4. SWOT Analysis
3.5. Regulatory Scenario
3.3. Effects of Inflation, Russia-Ukraine War, moderating economic growth, and other macroeconomic factors
Chapter 4. Competitive Landscape
4.1. Market Share Analysis
4.1.1. Global Fresh and Naturally Fermented Birch Juice Market Share by Company, 2023
4.1.2. Product Offerings of Leading Fresh and Naturally Fermented Birch Juice Companies
4.2. Market Entropy
4.2.1. New Product Launches in the Industry
4.2.2. Mergers, Acquisitions, Joint ventures, and Partnerships
4.3. Key Strategies and Best Practices
Chapter 5. Global Market Projections: Best, Reference, and Low Case Scenarios
5.1. Growth Analysis- Case Scenario Definitions
5.2. Low Growth Case Scenario Forecasts
5.3. Reference Growth Case Scenario Forecasts
5.4. High Growth Case Scenario Forecasts
Chapter 6. Market Dynamics
6.1. Fresh and Naturally Fermented Birch Juice Market Drivers
6.2. Fresh and Naturally Fermented Birch Juice Market Challenges
6.6. Fresh and Naturally Fermented Birch Juice Market Opportunities
6.4. Fresh and Naturally Fermented Birch Juice Market Trends
Chapter 7. Global Fresh and Naturally Fermented Birch Juice Market Outlook Trends
7.1. Global Fresh and Naturally Fermented Birch Juice Revenue (USD Million) and CAGR (%) by Type (2021-2032)
7.2. Global Fresh and Naturally Fermented Birch Juice Revenue (USD Million) and CAGR (%) by Application (2021-2032)
7.3. Global Fresh and Naturally Fermented Birch Juice Revenue (USD Million) and CAGR (%) by Product (2021-2032)
By Type
Unflavored
Flavored
By Application
Food and Beverages
Cosmetics and Personal Care
Others
Chapter 8. Global Fresh and Naturally Fermented Birch Juice Regional Analysis and Outlook
8.1. Global Fresh and Naturally Fermented Birch Juice Revenue (USD Million) By Regions (2021- 2032)
8.2. North America Fresh and Naturally Fermented Birch Juice Revenue (USD Million) by Country (2021-2032)
8.2.1. United States Fresh and Naturally Fermented Birch Juice Regional Analysis and Outlook
8.2.2. Canada Fresh and Naturally Fermented Birch Juice Regional Analysis and Outlook
8.2.3. Mexico Fresh and Naturally Fermented Birch Juice Regional Analysis and Outlook
8.3. Europe Fresh and Naturally Fermented Birch Juice Revenue (USD Million), by Country (2021-2032)
8.3.1. Germany Fresh and Naturally Fermented Birch Juice Regional Analysis and Outlook
8.3.2. France Fresh and Naturally Fermented Birch Juice Regional Analysis and Outlook
8.3.3. United Kingdom Fresh and Naturally Fermented Birch Juice Regional Analysis and Outlook
8.3.4. Spain Fresh and Naturally Fermented Birch Juice Regional Analysis and Outlook
8.3.5. Italy Fresh and Naturally Fermented Birch Juice Regional Analysis and Outlook
8.3.6. Russia Fresh and Naturally Fermented Birch Juice Regional Analysis and Outlook
8.3.7. Rest of Europe Fresh and Naturally Fermented Birch Juice Regional Analysis and Outlook
8.4. Asia Pacific Fresh and Naturally Fermented Birch Juice Revenue (USD Million) by Country (2021-2032)
8.4.1. China Fresh and Naturally Fermented Birch Juice Regional Analysis and Outlook
8.4.2. Japan Fresh and Naturally Fermented Birch Juice Regional Analysis and Outlook
8.4.3. India Fresh and Naturally Fermented Birch Juice Regional Analysis and Outlook
8.4.4. South Korea Fresh and Naturally Fermented Birch Juice Regional Analysis and Outlook
8.4.5. Australia Fresh and Naturally Fermented Birch Juice Regional Analysis and Outlook
8.4.6. South East Asia Fresh and Naturally Fermented Birch Juice Regional Analysis and Outlook
8.4.7. Rest of Asia Pacific Fresh and Naturally Fermented Birch Juice Regional Analysis and Outlook
8.5. South America Fresh and Naturally Fermented Birch Juice Revenue (USD Million), by Country (2021-2032)
8.5.1. Brazil Fresh and Naturally Fermented Birch Juice Regional Analysis and Outlook
8.5.2. Argentina Fresh and Naturally Fermented Birch Juice Regional Analysis and Outlook
8.5.3. Rest of South America Fresh and Naturally Fermented Birch Juice Regional Analysis and Outlook
8.6. Middle East and Africa Fresh and Naturally Fermented Birch Juice Revenue (USD Million) by Country (2021-2032)
8.6.1. Middle East Fresh and Naturally Fermented Birch Juice Regional Analysis and Outlook
8.6.2. Africa Fresh and Naturally Fermented Birch Juice Regional Analysis and Outlook
Chapter 9. North America Fresh and Naturally Fermented Birch Juice Analysis and Outlook
9.1. North America Fresh and Naturally Fermented Birch Juice Revenue (USD Million) by Segments (2021-2032)
9.1.1. North America Fresh and Naturally Fermented Birch Juice Revenue (USD Million) by Type (2021-2032)
9.1.2. North America Fresh and Naturally Fermented Birch Juice Revenue (USD Million) by Application (2021-2032)
9.1.3. North America Fresh and Naturally Fermented Birch Juice Revenue (USD Million) by Product (2021-2032)
By Type
Unflavored
Flavored
By Application
Food and Beverages
Cosmetics and Personal Care
Others
Chapter 10. Europe Fresh and Naturally Fermented Birch Juice Analysis and Outlook
10.1. Europe Fresh and Naturally Fermented Birch Juice Revenue (USD Million), by Segments (USD Million) (2021-2032)
10.1.1. Europe Fresh and Naturally Fermented Birch Juice Revenue (USD Million) by Type (2021-2032)
10.1.2. Europe Fresh and Naturally Fermented Birch Juice Revenue (USD Million) by Application (2021-2032)
10.1.3. Europe Fresh and Naturally Fermented Birch Juice Revenue (USD Million) by Product (2021-2032)
By Type
Unflavored
Flavored
By Application
Food and Beverages
Cosmetics and Personal Care
Others
Chapter 11. Asia Pacific Fresh and Naturally Fermented Birch Juice Analysis and Outlook
11.1. Asia Pacific Fresh and Naturally Fermented Birch Juice Revenue (USD Million), and Revenue (USD Million) by Segments (2021-2032)
11.1.1. Asia Pacific Fresh and Naturally Fermented Birch Juice Revenue (USD Million) by Type (2021-2032)
11.1.2. Asia Pacific Fresh and Naturally Fermented Birch Juice Revenue (USD Million) by Application (2021-2032)
11.1.3. Asia Pacific Fresh and Naturally Fermented Birch Juice Revenue (USD Million) by Product (2021-2032)
By Type
Unflavored
Flavored
By Application
Food and Beverages
Cosmetics and Personal Care
Others
Chapter 12. South America Fresh and Naturally Fermented Birch Juice Analysis and Outlook
12.1. South America Fresh and Naturally Fermented Birch Juice Revenue (USD Million), by Segments (2021-2032)
12.1.1. South America Fresh and Naturally Fermented Birch Juice Revenue (USD Million) by Type (2021-2032)
12.1.2. South America Fresh and Naturally Fermented Birch Juice Revenue (USD Million) by Application (2021-2032)
12.1.3. South America Fresh and Naturally Fermented Birch Juice Revenue (USD Million) by Product (2021-2032)
By Type
Unflavored
Flavored
By Application
Food and Beverages
Cosmetics and Personal Care
Others
Chapter 13. Middle East and Africa Fresh and Naturally Fermented Birch Juice Analysis and Outlook
13.1. Middle East and Africa Fresh and Naturally Fermented Birch Juice Revenue (USD Million), by Segments (2021-2032)
13.1.1. Middle East and Africa Fresh and Naturally Fermented Birch Juice Revenue (USD Million) by Type (2021-2032)
13.1.2. Middle East and Africa Fresh and Naturally Fermented Birch Juice Revenue (USD Million) by Application (2021-2032)
13.1.3. Middle East and Africa Fresh and Naturally Fermented Birch Juice Revenue (USD Million) by Product (2021-2032)
By Type
Unflavored
Flavored
By Application
Food and Beverages
Cosmetics and Personal Care
Others
Chapter 14. Fresh and Naturally Fermented Birch Juice Company Profiles
14.1 Business Overview
14.2 Product Profiles
14.3 SWOT Profiles
14.5 Recent Developments
14.6 Financial Profile
List of Companies
BelSeva
OselBirch
Sealand Birk
Sibberi
Treo
15. Methodology and Data Sources
15.1 Customization Offerings
15.2 Subscription Services
15.3 Related Reports
15.4 Publisher Expertise
LIST OF TABLES
Table 1 Market Segmentation Analysis
Table 2 Global Fresh and Naturally Fermented Birch Juice Market Share of Leading Companies, 2023
Table 3 Product Offerings of Leading Companies
Table 4 Low Growth Scenario Forecasts
Table 5 Reference Case Growth Scenario
Table 6 High Growth Case Scenario
Table 7 Global Fresh and Naturally Fermented Birch Juice Revenue (USD Million) And CAGR (%) By Type (2021-2032)
Table 8 Global Fresh and Naturally Fermented Birch Juice Revenue (USD Million) And CAGR (%) By Application (2021-2032)
Table 9 Global Fresh and Naturally Fermented Birch Juice Revenue (USD Million) And CAGR (%) By Product (2021-2032)
Table 10 Global Fresh and Naturally Fermented Birch Juice Market Revenue (USD Million) By Regions (2021-2032)
Table 11 Global Fresh and Naturally Fermented Birch Juice Market Share (%) By Regions (2021-2032)
Table 12 North America Fresh and Naturally Fermented Birch Juice Revenue (USD Million) By Country (2021-2032)
Table 13 Europe Fresh and Naturally Fermented Birch Juice Revenue (USD Million) By Country (2021-2032)
Table 14 Asia Pacific Fresh and Naturally Fermented Birch Juice Revenue (USD Million) By Country (2021-2032)
Table 15 South America Fresh and Naturally Fermented Birch Juice Revenue (USD Million) By Country (2021-2032)
Table 16 Middle East and Africa Fresh and Naturally Fermented Birch Juice Revenue (USD Million) By Region (2021-2032)
Table 17 North America Fresh and Naturally Fermented Birch Juice Revenue (USD Million) By Type (2021-2032)
Table 18 North America Fresh and Naturally Fermented Birch Juice Revenue (USD Million) By Application (2021-2032)
Table 19 North America Fresh and Naturally Fermented Birch Juice Revenue (USD Million) By Product (2021-2032)
Table 20 Europe Fresh and Naturally Fermented Birch Juice Revenue (USD Million) By Type (2021-2032)
Table 21 Europe Fresh and Naturally Fermented Birch Juice Revenue (USD Million) By Application (2021-2032)
Table 22 Europe Fresh and Naturally Fermented Birch Juice Revenue (USD Million) By Product (2021-2032)
Table 23 Asia Pacific Fresh and Naturally Fermented Birch Juice Revenue (USD Million) By Type (2021-2032)
Table 24 Asia Pacific Fresh and Naturally Fermented Birch Juice Revenue (USD Million) By Application (2021-2032)
Table 25 Asia Pacific Fresh and Naturally Fermented Birch Juice Revenue (USD Million) By Product (2021-2032)
Table 26 South America Fresh and Naturally Fermented Birch Juice Revenue (USD Million) By Type (2021-2032)
Table 27 South America Fresh and Naturally Fermented Birch Juice Revenue (USD Million) By Application (2021-2032)
Table 28 South America Fresh and Naturally Fermented Birch Juice Revenue (USD Million) By Product (2021-2032)
Table 29 Middle East and Africa Fresh and Naturally Fermented Birch Juice Revenue (USD Million) By Type (2021-2032)
Table 30 Middle East and Africa Fresh and Naturally Fermented Birch Juice Revenue (USD Million) By Application (2021-2032)
Table 31 Middle East and Africa Fresh and Naturally Fermented Birch Juice Revenue (USD Million) By Product (2021-2032)
LIST OF FIGURES
Figure 1. Market Scope
Figure 2. Pricing Forecasts Per Unit, 2023- 2032
Figure 3. Porter’s Five Forces
Figure 4. Global Fresh and Naturally Fermented Birch Juice Market Revenue (USD Million) By Regions (2021-2032)
Figure 5. Global Fresh and Naturally Fermented Birch Juice Market Share (%) By Regions (2023)
Figure 6. North America Fresh and Naturally Fermented Birch Juice Revenue (USD Million) By Country (2021-2032)
Figure 7. United States Fresh and Naturally Fermented Birch Juice Revenue (USD Million) By Country (2021-2032)
Figure 8. Canada Fresh and Naturally Fermented Birch Juice Revenue (USD Million) By Country (2021-2032)
Figure 9. Mexico Fresh and Naturally Fermented Birch Juice Revenue (USD Million) By Country (2021-2032)
Figure 10. Europe Fresh and Naturally Fermented Birch Juice Revenue (USD Million) By Country (2021-2032)
Figure 11. Germany Fresh and Naturally Fermented Birch Juice Revenue (USD Million) By Country (2021-2032)
Figure 12. France Fresh and Naturally Fermented Birch Juice Revenue (USD Million) By Country (2021-2032)
Figure 13. United Kingdom Fresh and Naturally Fermented Birch Juice Revenue (USD Million) By Country (2021-2032)
Figure 14. Spain Fresh and Naturally Fermented Birch Juice Revenue (USD Million) By Country (2021-2032)
Figure 15. Italy Fresh and Naturally Fermented Birch Juice Revenue (USD Million) By Country (2021-2032)
Figure 16. Russia Fresh and Naturally Fermented Birch Juice Revenue (USD Million) By Country (2021-2032)
Figure 17. Rest of Europe Fresh and Naturally Fermented Birch Juice Revenue (USD Million) By Country (2021-2032)
Figure 11. Asia Pacific Fresh and Naturally Fermented Birch Juice Revenue (USD Million) By Country (2021-2032)
Figure 12. China Fresh and Naturally Fermented Birch Juice Revenue (USD Million) By Country (2021-2032)
Figure 13. Japan Fresh and Naturally Fermented Birch Juice Revenue (USD Million) By Country (2021-2032)
Figure 14. India Fresh and Naturally Fermented Birch Juice Revenue (USD Million) By Country (2021-2032)
Figure 15. South Korea Fresh and Naturally Fermented Birch Juice Revenue (USD Million) By Country (2021-2032)
Figure 16. Australia Fresh and Naturally Fermented Birch Juice Revenue (USD Million) By Country (2021-2032)
Figure 17. South East Asia Fresh and Naturally Fermented Birch Juice Revenue (USD Million) By Country (2021-2032)
Figure 18. South America Fresh and Naturally Fermented Birch Juice Revenue (USD Million) By Country (2021-2032)
Figure 19. Brazil Fresh and Naturally Fermented Birch Juice Revenue (USD Million) By Country (2021-2032)
Figure 20. Argentina Fresh and Naturally Fermented Birch Juice Revenue (USD Million) By Country (2021-2032)
Figure 21. Rest of Asia Pacific Fresh and Naturally Fermented Birch Juice Revenue (USD Million) By Country (2021-2032)
Figure 22. Middle East and Africa Fresh and Naturally Fermented Birch Juice Revenue (USD Million) By Region (2021-2032)
Figure 23. Saudi Arabia Fresh and Naturally Fermented Birch Juice Revenue (USD Million) By Region (2021-2032)
Figure 24. The UAE Fresh and Naturally Fermented Birch Juice Revenue (USD Million) By Region (2021-2032)
Figure 25. Rest of Middle East Fresh and Naturally Fermented Birch Juice Revenue (USD Million) By Region (2021-2032)
Figure 26. South Africa Fresh and Naturally Fermented Birch Juice Revenue (USD Million) By Region (2021-2032)
Figure 27. Africa Fresh and Naturally Fermented Birch Juice Revenue (USD Million) By Region (2021-2032)
Figure 28. North America Fresh and Naturally Fermented Birch Juice Revenue (USD Million) By Type (2021-2032)
Figure 29. North America Fresh and Naturally Fermented Birch Juice Revenue (USD Million) By Application (2021-2032)
Figure 30. North America Fresh and Naturally Fermented Birch Juice Revenue (USD Million) By Product (2021-2032)
Figure 31. Europe Fresh and Naturally Fermented Birch Juice Revenue (USD Million) By Type (2021-2032)
Figure 32. Europe Fresh and Naturally Fermented Birch Juice Revenue (USD Million) By Application (2021-2032)
Figure 33. Europe Fresh and Naturally Fermented Birch Juice Revenue (USD Million) By Product (2021-2032)
Figure 34. Asia Pacific Fresh and Naturally Fermented Birch Juice Revenue (USD Million) By Type (2021-2032)
Figure 35. Asia Pacific Fresh and Naturally Fermented Birch Juice Revenue (USD Million) By Application (2021-2032)
Figure 36. Asia Pacific Fresh and Naturally Fermented Birch Juice Revenue (USD Million) By Product (2021-2032)
Figure 37. South America Fresh and Naturally Fermented Birch Juice Revenue (USD Million) By Type (2021-2032)
Figure 38. South America Fresh and Naturally Fermented Birch Juice Revenue (USD Million) By Application (2021-2032)
Figure 39. South America Fresh and Naturally Fermented Birch Juice Revenue (USD Million) By Product (2021-2032)
Figure 40. Middle East and Africa Fresh and Naturally Fermented Birch Juice Revenue (USD Million) By Type (2021-2032)
Figure 41. Middle East and Africa Fresh and Naturally Fermented Birch Juice Revenue (USD Million) By Application (2021-2032)
Figure 42. Middle East and Africa Fresh and Naturally Fermented Birch Juice Revenue (USD Million) By Product (2021-2032)
By Type
Unflavored
Flavored
By Application
Food and Beverages
Cosmetics and Personal Care
Others
Countries Analyzed
North America (US, Canada, Mexico)
Europe (Germany, UK, France, Spain, Italy, Russia, Rest of Europe)
Asia Pacific (China, India, Japan, South Korea, Australia, South East Asia, Rest of Asia)
South America (Brazil, Argentina, Rest of South America)
Middle East and Africa (Saudi Arabia, UAE, Rest of Middle East, South Africa, Egypt, Rest of Africa)
