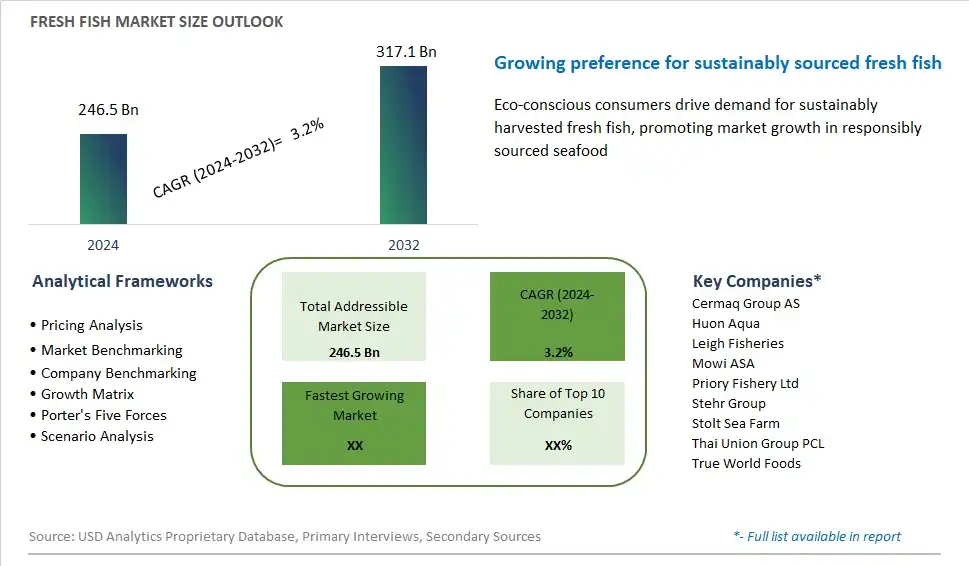
Global Fresh Fish Market Size is valued at $246.5 Billion in 2024 and is forecast to register a growth rate (CAGR) of 3.2% to reach $317.1 Billion by 2032.
The global Fresh Fish Market Comprehensive Study analyzes and forecasts the market size across 6 regions and 24 countries for diverse segments -By Product (Pelagic, Demersal), By Form (Fresh, Frozen), By Distribution Channel (Offline, Online)
An Introduction to Fresh Fish Market
In 2024, the fresh fish market is experiencing steady growth, driven by the increasing consumer demand for healthy and nutritious food options. Fresh fish, known for its high protein content and rich supply of omega-3 fatty acids, is a staple in many diets around the world. The market is characterized by a focus on sustainability and traceability, with consumers seeking responsibly sourced and high-quality seafood. Innovations in aquaculture and fishing techniques are enhancing the supply chain, ensuring the availability of fresh fish year-round. The rise of online seafood markets and home delivery services is also making fresh fish more accessible to a wider audience. Additionally, the growing interest in culinary diversity is driving demand for a variety of fish species, both traditional and exotic. The fresh fish market is poised for continued expansion as health and sustainability remain key consumer priorities.
Fresh Fish Competitive Landscape
The market report analyses the leading companies in the industry including Cermaq Group AS, Huon Aqua, Leigh Fisheries, Mowi ASA, Priory Fishery Ltd, Stehr Group, Stolt Sea Farm, Thai Union Group PCL, True World Foods, and Others.
Fresh Fish Market Dynamics
Fresh Fish Market Trend: Increasing Demand for Sustainable and Traceable Seafood
One of the most prominent trends in the fresh fish market is the increasing demand for sustainable and traceable seafood. Consumers are becoming more conscious of the environmental and ethical impacts of their food choices, leading to a growing preference for responsibly sourced seafood products. This trend is driven by concerns over overfishing, habitat destruction, and seafood fraud, prompting consumers to seek out transparent supply chains and certifications such as Marine Stewardship Council (MSC) and Aquaculture Stewardship Council (ASC) to ensure the sustainability and traceability of their seafood purchases. As a result, there is a rising demand for fresh fish products that are harvested or farmed using sustainable practices, with an emphasis on preserving marine ecosystems and supporting local fishing communities.
Market Driver: Health Benefits and Nutritional Value
A key driver of the fresh fish market is the recognition of the health benefits and nutritional value of seafood consumption. Fresh fish is a rich source of essential nutrients such as omega-3 fatty acids, protein, vitamins, and minerals, which are vital for maintaining overall health and well-being. As consumers become more health-conscious and seek out nutritious food options, fresh fish emerges as a preferred choice due to its low fat content, high protein levels, and heart-healthy omega-3s. Additionally, scientific studies highlighting the role of seafood consumption in reducing the risk of chronic diseases such as cardiovascular disorders, cognitive decline, and inflammation further drive the demand for fresh fish products. With increasing awareness of the importance of a balanced diet and the positive impact of seafood on health, fresh fish remains a staple in the diets of health-conscious consumers, driving sustained demand in the market.
Market Opportunity: Expansion of Online and Direct-to-Consumer Channels
A significant opportunity for the fresh fish market lies in the expansion of online and direct-to-consumer channels. With the rise of e-commerce platforms and the growing popularity of online grocery shopping, consumers are increasingly turning to digital channels to purchase fresh seafood conveniently from the comfort of their homes. By leveraging technology and e-commerce capabilities, fishmongers, seafood retailers, and fish farms can reach a wider audience, offer a diverse selection of fresh fish products, and provide convenient delivery options to meet the evolving needs and preferences of consumers. Moreover, direct-to-consumer models enable seafood suppliers to establish closer relationships with customers, provide personalized shopping experiences, and offer educational resources on seafood sustainability, preparation techniques, and recipe ideas. By embracing digital transformation and embracing omnichannel strategies, fresh fish suppliers can capitalize on the growing demand for online seafood purchases and enhance their market presence in the rapidly evolving digital landscape.
Fresh Fish Market Share Analysis: Pelagic held the dominant market share in 2024
Within the Fresh Fish Market, the pelagic segment is the largest, commanding a significant share of the industry. This dominance can be attributed to several factors, including the high demand for pelagic fish species among consumers worldwide, the widespread availability of pelagic fish in both wild-caught and farmed sources, and the versatility of pelagic fish in various culinary applications. Pelagic fish, such as mackerel, tuna, and sardines, are known for their rich flavor, firm texture, and high nutritional value, making them popular choices for seafood lovers. Additionally, pelagic fish are often prized for their sustainability and abundance, with many species being harvested in large quantities from well-managed fisheries. Further, pelagic fish are widely used in the production of canned seafood products, smoked fish, and fish oil supplements, further driving their demand in the market. As consumer awareness of the health benefits and culinary versatility of pelagic fish continues to grow, the pelagic segment is expected to maintain its stronghold, driving market growth and innovation in the Fresh Fish Market.
Fresh Fish Market Share Analysis: Frozen market is poised to register the fastest growth rae over the forecast period to 2032
Among the segments in the Fresh Fish Market, the frozen segment stands out as the fastest-growing, experiencing significant expansion in recent years. The robust growth outlook is driven by several factors, including the increasing demand for convenience and longer shelf life among consumers, the advancements in freezing technologies that preserve the quality and freshness of fish during storage, and the expanding global trade networks facilitating the distribution of frozen fish products. Frozen fish offers consumers the flexibility to store and use fish at their convenience, eliminating concerns about freshness and enabling access to a wider variety of fish species regardless of seasonality. Additionally, frozen fish products are often more cost-effective than fresh alternatives, making them accessible to a broader range of consumers. Further, frozen fish is widely used in the foodservice industry, catering to the needs of restaurants, cafeterias, and catering businesses that require consistent quality and availability of seafood products. As consumer preferences continue to evolve towards convenience and sustainability, the frozen segment is expected to sustain its rapid growth trajectory, driving market expansion and innovation in the Fresh Fish Market.
Fresh Fish Market Share Analysis: Offline Distribution Channel held the dominant market share in 2024
In the Fresh Fish Market, the offline distribution channel is the largest segment, commanding a significant share of the industry. This dominance can be attributed to several factors, including the traditional shopping habits of consumers who prefer to physically inspect and select fresh fish products, the established network of fish markets, seafood counters, and specialty stores offering a wide variety of fresh fish options, and the importance of personal interaction and trust in the seafood purchasing process. Offline channels provide consumers with the opportunity to engage directly with fishmongers and seafood experts, enabling them to ask questions, receive recommendations, and ensure the quality and freshness of their purchases. Additionally, offline distribution channels often offer a wider selection of fresh fish species sourced locally or regionally, catering to the preferences and tastes of diverse consumer demographics. Further, the tactile experience of selecting fish from a display and the immediate availability of products contribute to the enduring popularity of offline channels in the Fresh Fish Market. As consumer demand for high-quality, sustainably sourced seafood continues to grow, offline distribution channels are expected to maintain their stronghold, driving market growth and innovation in the Fresh Fish Market.
Fresh Fish Market Segmentation
By Product
Pelagic
Demersal
By Form
Fresh
Frozen
By Distribution Channel
Offline
Online
Countries Analyzed
North America (US, Canada, Mexico)
Europe (Germany, UK, France, Spain, Italy, Russia, Rest of Europe)
Asia Pacific (China, India, Japan, South Korea, Australia, South East Asia, Rest of Asia)
South America (Brazil, Argentina, Rest of South America)
Middle East and Africa (Saudi Arabia, UAE, Rest of Middle East, South Africa, Egypt, Rest of Africa)
Fresh Fish Companies Profiled in the Study
Cermaq Group AS
Huon Aqua
Leigh Fisheries
Mowi ASA
Priory Fishery Ltd
Stehr Group
Stolt Sea Farm
Thai Union Group PCL
True World Foods
*- List Not Exhaustive
Chapter 1. TABLE OF CONTENTS
Chapter 2. Introduction to Fresh Fish Market
2.1. Market Overview
2.2. Key Statistics and Report Highlights
2.3. Scope of the Comprehensive Study
2.3.1. Market Definition
2.3.2 Countries and Regions Covered
2.3.3 Research Objective
2.3.4 Units, Currency, and Conversions
2.3.5 Industry Value Chain
2.4. Key Market Segments
2.5. Key Companies
2.6. Study Period
Chapter 3. Strategic Analysis Review
3.1. Fresh Fish Pricing Analysis and Forecast
3.2. Porter’s Five Forces
3.3. Market Ecosystem
3.4. SWOT Analysis
3.5. Regulatory Scenario
3.3. Effects of Inflation, Russia-Ukraine War, moderating economic growth, and other macroeconomic factors
Chapter 4. Competitive Landscape
4.1. Market Share Analysis
4.1.1. Global Fresh Fish Market Share by Company, 2023
4.1.2. Product Offerings of Leading Fresh Fish Companies
4.2. Market Entropy
4.2.1. New Product Launches in the Industry
4.2.2. Mergers, Acquisitions, Joint ventures, and Partnerships
4.3. Key Strategies and Best Practices
Chapter 5. Global Market Projections: Best, Reference, and Low Case Scenarios
5.1. Growth Analysis- Case Scenario Definitions
5.2. Low Growth Case Scenario Forecasts
5.3. Reference Growth Case Scenario Forecasts
5.4. High Growth Case Scenario Forecasts
Chapter 6. Market Dynamics
6.1. Fresh Fish Market Drivers
6.2. Fresh Fish Market Challenges
6.6. Fresh Fish Market Opportunities
6.4. Fresh Fish Market Trends
Chapter 7. Global Fresh Fish Market Outlook Trends
7.1. Global Fresh Fish Revenue (USD Million) and CAGR (%) by Type (2021-2032)
7.2. Global Fresh Fish Revenue (USD Million) and CAGR (%) by Application (2021-2032)
7.3. Global Fresh Fish Revenue (USD Million) and CAGR (%) by Product (2021-2032)
By Product
Pelagic
Demersal
By Form
Fresh
Frozen
By Distribution Channel
Offline
Online
Chapter 8. Global Fresh Fish Regional Analysis and Outlook
8.1. Global Fresh Fish Revenue (USD Million) By Regions (2021- 2032)
8.2. North America Fresh Fish Revenue (USD Million) by Country (2021-2032)
8.2.1. United States Fresh Fish Regional Analysis and Outlook
8.2.2. Canada Fresh Fish Regional Analysis and Outlook
8.2.3. Mexico Fresh Fish Regional Analysis and Outlook
8.3. Europe Fresh Fish Revenue (USD Million), by Country (2021-2032)
8.3.1. Germany Fresh Fish Regional Analysis and Outlook
8.3.2. France Fresh Fish Regional Analysis and Outlook
8.3.3. United Kingdom Fresh Fish Regional Analysis and Outlook
8.3.4. Spain Fresh Fish Regional Analysis and Outlook
8.3.5. Italy Fresh Fish Regional Analysis and Outlook
8.3.6. Russia Fresh Fish Regional Analysis and Outlook
8.3.7. Rest of Europe Fresh Fish Regional Analysis and Outlook
8.4. Asia Pacific Fresh Fish Revenue (USD Million) by Country (2021-2032)
8.4.1. China Fresh Fish Regional Analysis and Outlook
8.4.2. Japan Fresh Fish Regional Analysis and Outlook
8.4.3. India Fresh Fish Regional Analysis and Outlook
8.4.4. South Korea Fresh Fish Regional Analysis and Outlook
8.4.5. Australia Fresh Fish Regional Analysis and Outlook
8.4.6. South East Asia Fresh Fish Regional Analysis and Outlook
8.4.7. Rest of Asia Pacific Fresh Fish Regional Analysis and Outlook
8.5. South America Fresh Fish Revenue (USD Million), by Country (2021-2032)
8.5.1. Brazil Fresh Fish Regional Analysis and Outlook
8.5.2. Argentina Fresh Fish Regional Analysis and Outlook
8.5.3. Rest of South America Fresh Fish Regional Analysis and Outlook
8.6. Middle East and Africa Fresh Fish Revenue (USD Million) by Country (2021-2032)
8.6.1. Middle East Fresh Fish Regional Analysis and Outlook
8.6.2. Africa Fresh Fish Regional Analysis and Outlook
Chapter 9. North America Fresh Fish Analysis and Outlook
9.1. North America Fresh Fish Revenue (USD Million) by Segments (2021-2032)
9.1.1. North America Fresh Fish Revenue (USD Million) by Type (2021-2032)
9.1.2. North America Fresh Fish Revenue (USD Million) by Application (2021-2032)
9.1.3. North America Fresh Fish Revenue (USD Million) by Product (2021-2032)
By Product
Pelagic
Demersal
By Form
Fresh
Frozen
By Distribution Channel
Offline
Online
Chapter 10. Europe Fresh Fish Analysis and Outlook
10.1. Europe Fresh Fish Revenue (USD Million), by Segments (USD Million) (2021-2032)
10.1.1. Europe Fresh Fish Revenue (USD Million) by Type (2021-2032)
10.1.2. Europe Fresh Fish Revenue (USD Million) by Application (2021-2032)
10.1.3. Europe Fresh Fish Revenue (USD Million) by Product (2021-2032)
By Product
Pelagic
Demersal
By Form
Fresh
Frozen
By Distribution Channel
Offline
Online
Chapter 11. Asia Pacific Fresh Fish Analysis and Outlook
11.1. Asia Pacific Fresh Fish Revenue (USD Million), and Revenue (USD Million) by Segments (2021-2032)
11.1.1. Asia Pacific Fresh Fish Revenue (USD Million) by Type (2021-2032)
11.1.2. Asia Pacific Fresh Fish Revenue (USD Million) by Application (2021-2032)
11.1.3. Asia Pacific Fresh Fish Revenue (USD Million) by Product (2021-2032)
By Product
Pelagic
Demersal
By Form
Fresh
Frozen
By Distribution Channel
Offline
Online
Chapter 12. South America Fresh Fish Analysis and Outlook
12.1. South America Fresh Fish Revenue (USD Million), by Segments (2021-2032)
12.1.1. South America Fresh Fish Revenue (USD Million) by Type (2021-2032)
12.1.2. South America Fresh Fish Revenue (USD Million) by Application (2021-2032)
12.1.3. South America Fresh Fish Revenue (USD Million) by Product (2021-2032)
By Product
Pelagic
Demersal
By Form
Fresh
Frozen
By Distribution Channel
Offline
Online
Chapter 13. Middle East and Africa Fresh Fish Analysis and Outlook
13.1. Middle East and Africa Fresh Fish Revenue (USD Million), by Segments (2021-2032)
13.1.1. Middle East and Africa Fresh Fish Revenue (USD Million) by Type (2021-2032)
13.1.2. Middle East and Africa Fresh Fish Revenue (USD Million) by Application (2021-2032)
13.1.3. Middle East and Africa Fresh Fish Revenue (USD Million) by Product (2021-2032)
By Product
Pelagic
Demersal
By Form
Fresh
Frozen
By Distribution Channel
Offline
Online
Chapter 14. Fresh Fish Company Profiles
14.1 Business Overview
14.2 Product Profiles
14.3 SWOT Profiles
14.5 Recent Developments
14.6 Financial Profile
List of Companies
Cermaq Group AS
Huon Aqua
Leigh Fisheries
Mowi ASA
Priory Fishery Ltd
Stehr Group
Stolt Sea Farm
Thai Union Group PCL
True World Foods
15. Methodology and Data Sources
15.1 Customization Offerings
15.2 Subscription Services
15.3 Related Reports
15.4 Publisher Expertise
LIST OF TABLES
Table 1 Market Segmentation Analysis
Table 2 Global Fresh Fish Market Share of Leading Companies, 2023
Table 3 Product Offerings of Leading Companies
Table 4 Low Growth Scenario Forecasts
Table 5 Reference Case Growth Scenario
Table 6 High Growth Case Scenario
Table 7 Global Fresh Fish Revenue (USD Million) And CAGR (%) By Type (2021-2032)
Table 8 Global Fresh Fish Revenue (USD Million) And CAGR (%) By Application (2021-2032)
Table 9 Global Fresh Fish Revenue (USD Million) And CAGR (%) By Product (2021-2032)
Table 10 Global Fresh Fish Market Revenue (USD Million) By Regions (2021-2032)
Table 11 Global Fresh Fish Market Share (%) By Regions (2021-2032)
Table 12 North America Fresh Fish Revenue (USD Million) By Country (2021-2032)
Table 13 Europe Fresh Fish Revenue (USD Million) By Country (2021-2032)
Table 14 Asia Pacific Fresh Fish Revenue (USD Million) By Country (2021-2032)
Table 15 South America Fresh Fish Revenue (USD Million) By Country (2021-2032)
Table 16 Middle East and Africa Fresh Fish Revenue (USD Million) By Region (2021-2032)
Table 17 North America Fresh Fish Revenue (USD Million) By Type (2021-2032)
Table 18 North America Fresh Fish Revenue (USD Million) By Application (2021-2032)
Table 19 North America Fresh Fish Revenue (USD Million) By Product (2021-2032)
Table 20 Europe Fresh Fish Revenue (USD Million) By Type (2021-2032)
Table 21 Europe Fresh Fish Revenue (USD Million) By Application (2021-2032)
Table 22 Europe Fresh Fish Revenue (USD Million) By Product (2021-2032)
Table 23 Asia Pacific Fresh Fish Revenue (USD Million) By Type (2021-2032)
Table 24 Asia Pacific Fresh Fish Revenue (USD Million) By Application (2021-2032)
Table 25 Asia Pacific Fresh Fish Revenue (USD Million) By Product (2021-2032)
Table 26 South America Fresh Fish Revenue (USD Million) By Type (2021-2032)
Table 27 South America Fresh Fish Revenue (USD Million) By Application (2021-2032)
Table 28 South America Fresh Fish Revenue (USD Million) By Product (2021-2032)
Table 29 Middle East and Africa Fresh Fish Revenue (USD Million) By Type (2021-2032)
Table 30 Middle East and Africa Fresh Fish Revenue (USD Million) By Application (2021-2032)
Table 31 Middle East and Africa Fresh Fish Revenue (USD Million) By Product (2021-2032)
LIST OF FIGURES
Figure 1. Market Scope
Figure 2. Pricing Forecasts Per Unit, 2023- 2032
Figure 3. Porter’s Five Forces
Figure 4. Global Fresh Fish Market Revenue (USD Million) By Regions (2021-2032)
Figure 5. Global Fresh Fish Market Share (%) By Regions (2023)
Figure 6. North America Fresh Fish Revenue (USD Million) By Country (2021-2032)
Figure 7. United States Fresh Fish Revenue (USD Million) By Country (2021-2032)
Figure 8. Canada Fresh Fish Revenue (USD Million) By Country (2021-2032)
Figure 9. Mexico Fresh Fish Revenue (USD Million) By Country (2021-2032)
Figure 10. Europe Fresh Fish Revenue (USD Million) By Country (2021-2032)
Figure 11. Germany Fresh Fish Revenue (USD Million) By Country (2021-2032)
Figure 12. France Fresh Fish Revenue (USD Million) By Country (2021-2032)
Figure 13. United Kingdom Fresh Fish Revenue (USD Million) By Country (2021-2032)
Figure 14. Spain Fresh Fish Revenue (USD Million) By Country (2021-2032)
Figure 15. Italy Fresh Fish Revenue (USD Million) By Country (2021-2032)
Figure 16. Russia Fresh Fish Revenue (USD Million) By Country (2021-2032)
Figure 17. Rest of Europe Fresh Fish Revenue (USD Million) By Country (2021-2032)
Figure 11. Asia Pacific Fresh Fish Revenue (USD Million) By Country (2021-2032)
Figure 12. China Fresh Fish Revenue (USD Million) By Country (2021-2032)
Figure 13. Japan Fresh Fish Revenue (USD Million) By Country (2021-2032)
Figure 14. India Fresh Fish Revenue (USD Million) By Country (2021-2032)
Figure 15. South Korea Fresh Fish Revenue (USD Million) By Country (2021-2032)
Figure 16. Australia Fresh Fish Revenue (USD Million) By Country (2021-2032)
Figure 17. South East Asia Fresh Fish Revenue (USD Million) By Country (2021-2032)
Figure 18. South America Fresh Fish Revenue (USD Million) By Country (2021-2032)
Figure 19. Brazil Fresh Fish Revenue (USD Million) By Country (2021-2032)
Figure 20. Argentina Fresh Fish Revenue (USD Million) By Country (2021-2032)
Figure 21. Rest of Asia Pacific Fresh Fish Revenue (USD Million) By Country (2021-2032)
Figure 22. Middle East and Africa Fresh Fish Revenue (USD Million) By Region (2021-2032)
Figure 23. Saudi Arabia Fresh Fish Revenue (USD Million) By Region (2021-2032)
Figure 24. The UAE Fresh Fish Revenue (USD Million) By Region (2021-2032)
Figure 25. Rest of Middle East Fresh Fish Revenue (USD Million) By Region (2021-2032)
Figure 26. South Africa Fresh Fish Revenue (USD Million) By Region (2021-2032)
Figure 27. Africa Fresh Fish Revenue (USD Million) By Region (2021-2032)
Figure 28. North America Fresh Fish Revenue (USD Million) By Type (2021-2032)
Figure 29. North America Fresh Fish Revenue (USD Million) By Application (2021-2032)
Figure 30. North America Fresh Fish Revenue (USD Million) By Product (2021-2032)
Figure 31. Europe Fresh Fish Revenue (USD Million) By Type (2021-2032)
Figure 32. Europe Fresh Fish Revenue (USD Million) By Application (2021-2032)
Figure 33. Europe Fresh Fish Revenue (USD Million) By Product (2021-2032)
Figure 34. Asia Pacific Fresh Fish Revenue (USD Million) By Type (2021-2032)
Figure 35. Asia Pacific Fresh Fish Revenue (USD Million) By Application (2021-2032)
Figure 36. Asia Pacific Fresh Fish Revenue (USD Million) By Product (2021-2032)
Figure 37. South America Fresh Fish Revenue (USD Million) By Type (2021-2032)
Figure 38. South America Fresh Fish Revenue (USD Million) By Application (2021-2032)
Figure 39. South America Fresh Fish Revenue (USD Million) By Product (2021-2032)
Figure 40. Middle East and Africa Fresh Fish Revenue (USD Million) By Type (2021-2032)
Figure 41. Middle East and Africa Fresh Fish Revenue (USD Million) By Application (2021-2032)
Figure 42. Middle East and Africa Fresh Fish Revenue (USD Million) By Product (2021-2032)
By Product
Pelagic
Demersal
By Form
Fresh
Frozen
By Distribution Channel
Offline
Online
Countries Analyzed
North America (US, Canada, Mexico)
Europe (Germany, UK, France, Spain, Italy, Russia, Rest of Europe)
Asia Pacific (China, India, Japan, South Korea, Australia, South East Asia, Rest of Asia)
South America (Brazil, Argentina, Rest of South America)
Middle East and Africa (Saudi Arabia, UAE, Rest of Middle East, South Africa, Egypt, Rest of Africa)
