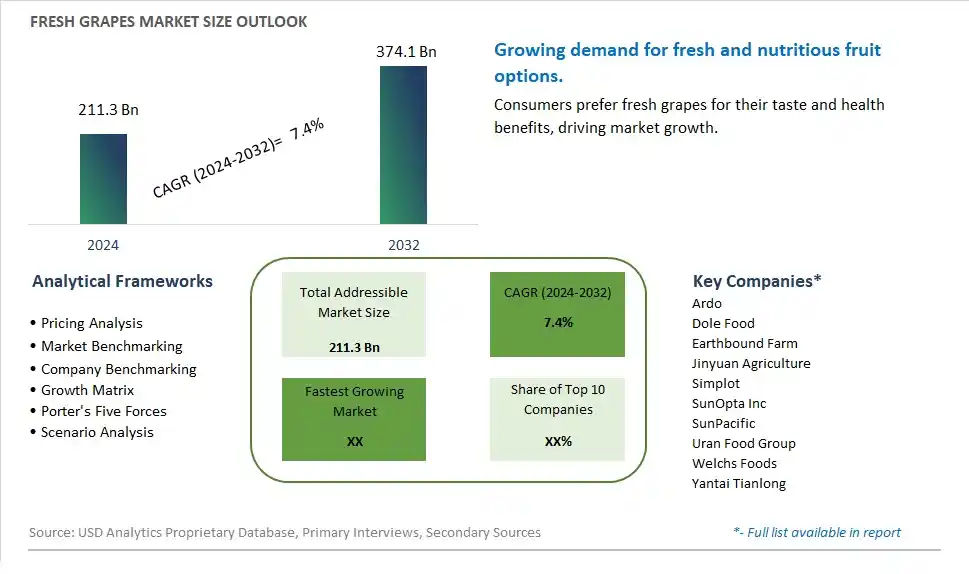
Global Fresh Grapes Market Size is valued at $211.3 Billion in 2024 and is forecast to register a growth rate (CAGR) of 7.4% to reach $374.1 Billion by 2032.
The global Fresh Grapes Market Comprehensive Study analyzes and forecasts the market size across 6 regions and 24 countries for diverse segments -By Type (Red Grapes, White Grapes, Rose Grapes, Others), By Application (Supermarkets/Hypermarkets, Convenience Stores, Independent Retailers, Online Sales, Others)
An Introduction to Fresh Grapes Market
In 2024, the Fresh Grapes market is thriving, fueled by the rising demand for fresh and healthy fruit options. Fresh grapes, known for their sweet taste and nutritional benefits, are consumed as snacks, in salads, and as ingredients in various recipes. The market benefits from advancements in agricultural practices and supply chain logistics, the growing trend of health-conscious consumption, and the expansion of the fresh fruit sector. Additionally, the increasing awareness of the benefits of grapes, such as their antioxidant properties, is driving market growth.
Fresh Grapes Competitive Landscape
The market report analyses the leading companies in the industry including Ardo, Dole Food, Earthbound Farm, Jinyuan Agriculture, Simplot, SunOpta Inc, SunPacific, Uran Food Group, Welchs Foods, Yantai Tianlong, and Others.
Fresh Grapes Market Dynamics
Fresh Grapes Market Trend: Increasing Demand for Fresh and Organic Produce
The most prominent trend in the Fresh Grapes Market is the increasing demand for fresh and organic produce. As consumers become more health-conscious and environmentally aware, there is a growing preference for organically grown grapes that offer superior taste and nutritional value. This trend is driven by the health and wellness movement, which emphasizes the consumption of fresh, nutrient-rich fruits, and the desire for sustainable farming practices.
Fresh Grapes Market Driver: Growth in Fruit Consumption
The key driver of the Fresh Grapes Market is the growth in fruit consumption. As global populations increase and dietary guidelines emphasize the importance of fruits in a balanced diet, there is a higher demand for fresh grapes. This driver is supported by the rising popularity of grapes as a convenient, ready-to-eat snack that offers numerous health benefits, including high levels of antioxidants and vitamins, driving market growth.
Fresh Grapes Market Opportunity: Expansion into New Varieties and Value-Added Products
A significant opportunity in the Fresh Grapes Market lies in the expansion into new grape varieties and value-added products. By developing and promoting new grape varieties that offer unique flavors, colors, and health benefits, companies can attract a broader consumer base. Additionally, creating value-added products, such as grape juices, dried grapes, and grape-based snacks, can help capture more market segments and drive growth.
Fresh Grapes Market Share Analysis: Red Grapes segment generated the highest revenue share in the industry
Red grapes are the largest and fastest-growing segment in the Fresh Grapes Market by 2032. Their popularity is driven by their rich flavor, versatility, and numerous health benefits. Red grapes are a powerhouse of antioxidants, including resveratrol, which is known for its anti-inflammatory and heart health benefits. This makes them a preferred choice among health-conscious consumers who are increasingly looking for natural ways to boost their well-being. Additionally, red grapes are widely used in various culinary applications, from fresh snacking to making juices, wines, and salads, enhancing their appeal to a broad consumer base. The vibrant color and sweet taste of red grapes also make them more attractive to consumers, especially in markets where visual appeal and taste play a significant role in purchasing decisions. The growth in organic farming and the increasing availability of organic red grapes further contribute to their market dominance, as consumers seek pesticide-free and sustainably grown produce. Further, advancements in storage and transportation have improved the shelf life and quality of red grapes, ensuring they remain fresh from farm to table. With their health benefits, versatility, and growing consumer preference, red grapes are set to maintain their leading position in the fresh grapes market, driving substantial growth in the coming years.
Fresh Grapes Market Share Analysis: Online Sales is the fastest growing segment over the forecast period to 2032
Online sales are anticipated to be the fastest-growing segment in the Fresh Grapes Market by 2032. This growth is primarily driven by the increasing consumer shift towards e-commerce for grocery shopping, a trend accelerated by the Past few years. Consumers appreciate the convenience of purchasing fresh produce, including grapes, from the comfort of their homes, with the added benefit of home delivery. Online platforms offer a wide variety of grape options, including organic and specialty varieties, which may not always be available in traditional brick-and-mortar stores. The ability to access detailed product information, read customer reviews, and compare prices enhances the shopping experience, making it easier for consumers to make informed purchasing decisions. Further, advancements in logistics and cold chain management ensure that grapes are delivered fresh and in optimal condition, preserving their quality and taste. Subscription services and personalized shopping experiences offered by online retailers further drive consumer loyalty and repeat purchases. As digital infrastructure continues to improve and more consumers become comfortable with online shopping, the online sales segment is set to outpace other distribution channels, driving significant growth in the fresh grapes market over the next decade.
Fresh Grapes Market Segmentation
By Type
Red Grapes
White Grapes
Rose Grapes
Others
By Application
Supermarkets/Hypermarkets
Convenience Stores
Independent Retailers
Online Sales
Others
Countries Analyzed
North America (US, Canada, Mexico)
Europe (Germany, UK, France, Spain, Italy, Russia, Rest of Europe)
Asia Pacific (China, India, Japan, South Korea, Australia, South East Asia, Rest of Asia)
South America (Brazil, Argentina, Rest of South America)
Middle East and Africa (Saudi Arabia, UAE, Rest of Middle East, South Africa, Egypt, Rest of Africa)
Fresh Grapes Companies Profiled in the Study
Ardo
Dole Food
Earthbound Farm
Jinyuan Agriculture
Simplot
SunOpta Inc
SunPacific
Uran Food Group
Welchs Foods
Yantai Tianlong
*- List Not Exhaustive
Chapter 1. TABLE OF CONTENTS
Chapter 2. Introduction to Fresh Grapes Market
2.1. Market Overview
2.2. Key Statistics and Report Highlights
2.3. Scope of the Comprehensive Study
2.3.1. Market Definition
2.3.2 Countries and Regions Covered
2.3.3 Research Objective
2.3.4 Units, Currency, and Conversions
2.3.5 Industry Value Chain
2.4. Key Market Segments
2.5. Key Companies
2.6. Study Period
Chapter 3. Strategic Analysis Review
3.1. Fresh Grapes Pricing Analysis and Forecast
3.2. Porter’s Five Forces
3.3. Market Ecosystem
3.4. SWOT Analysis
3.5. Regulatory Scenario
3.3. Effects of Inflation, Russia-Ukraine War, moderating economic growth, and other macroeconomic factors
Chapter 4. Competitive Landscape
4.1. Market Share Analysis
4.1.1. Global Fresh Grapes Market Share by Company, 2023
4.1.2. Product Offerings of Leading Fresh Grapes Companies
4.2. Market Entropy
4.2.1. New Product Launches in the Industry
4.2.2. Mergers, Acquisitions, Joint ventures, and Partnerships
4.3. Key Strategies and Best Practices
Chapter 5. Global Market Projections: Best, Reference, and Low Case Scenarios
5.1. Growth Analysis- Case Scenario Definitions
5.2. Low Growth Case Scenario Forecasts
5.3. Reference Growth Case Scenario Forecasts
5.4. High Growth Case Scenario Forecasts
Chapter 6. Market Dynamics
6.1. Fresh Grapes Market Drivers
6.2. Fresh Grapes Market Challenges
6.6. Fresh Grapes Market Opportunities
6.4. Fresh Grapes Market Trends
Chapter 7. Global Fresh Grapes Market Outlook Trends
7.1. Global Fresh Grapes Revenue (USD Million) and CAGR (%) by Type (2021-2032)
7.2. Global Fresh Grapes Revenue (USD Million) and CAGR (%) by Application (2021-2032)
7.3. Global Fresh Grapes Revenue (USD Million) and CAGR (%) by Product (2021-2032)
By Type
Red Grapes
White Grapes
Rose Grapes
Others
By Application
Supermarkets/Hypermarkets
Convenience Stores
Independent Retailers
Online Sales
Others
Chapter 8. Global Fresh Grapes Regional Analysis and Outlook
8.1. Global Fresh Grapes Revenue (USD Million) By Regions (2021- 2032)
8.2. North America Fresh Grapes Revenue (USD Million) by Country (2021-2032)
8.2.1. United States Fresh Grapes Regional Analysis and Outlook
8.2.2. Canada Fresh Grapes Regional Analysis and Outlook
8.2.3. Mexico Fresh Grapes Regional Analysis and Outlook
8.3. Europe Fresh Grapes Revenue (USD Million), by Country (2021-2032)
8.3.1. Germany Fresh Grapes Regional Analysis and Outlook
8.3.2. France Fresh Grapes Regional Analysis and Outlook
8.3.3. United Kingdom Fresh Grapes Regional Analysis and Outlook
8.3.4. Spain Fresh Grapes Regional Analysis and Outlook
8.3.5. Italy Fresh Grapes Regional Analysis and Outlook
8.3.6. Russia Fresh Grapes Regional Analysis and Outlook
8.3.7. Rest of Europe Fresh Grapes Regional Analysis and Outlook
8.4. Asia Pacific Fresh Grapes Revenue (USD Million) by Country (2021-2032)
8.4.1. China Fresh Grapes Regional Analysis and Outlook
8.4.2. Japan Fresh Grapes Regional Analysis and Outlook
8.4.3. India Fresh Grapes Regional Analysis and Outlook
8.4.4. South Korea Fresh Grapes Regional Analysis and Outlook
8.4.5. Australia Fresh Grapes Regional Analysis and Outlook
8.4.6. South East Asia Fresh Grapes Regional Analysis and Outlook
8.4.7. Rest of Asia Pacific Fresh Grapes Regional Analysis and Outlook
8.5. South America Fresh Grapes Revenue (USD Million), by Country (2021-2032)
8.5.1. Brazil Fresh Grapes Regional Analysis and Outlook
8.5.2. Argentina Fresh Grapes Regional Analysis and Outlook
8.5.3. Rest of South America Fresh Grapes Regional Analysis and Outlook
8.6. Middle East and Africa Fresh Grapes Revenue (USD Million) by Country (2021-2032)
8.6.1. Middle East Fresh Grapes Regional Analysis and Outlook
8.6.2. Africa Fresh Grapes Regional Analysis and Outlook
Chapter 9. North America Fresh Grapes Analysis and Outlook
9.1. North America Fresh Grapes Revenue (USD Million) by Segments (2021-2032)
9.1.1. North America Fresh Grapes Revenue (USD Million) by Type (2021-2032)
9.1.2. North America Fresh Grapes Revenue (USD Million) by Application (2021-2032)
9.1.3. North America Fresh Grapes Revenue (USD Million) by Product (2021-2032)
By Type
Red Grapes
White Grapes
Rose Grapes
Others
By Application
Supermarkets/Hypermarkets
Convenience Stores
Independent Retailers
Online Sales
Others
Chapter 10. Europe Fresh Grapes Analysis and Outlook
10.1. Europe Fresh Grapes Revenue (USD Million), by Segments (USD Million) (2021-2032)
10.1.1. Europe Fresh Grapes Revenue (USD Million) by Type (2021-2032)
10.1.2. Europe Fresh Grapes Revenue (USD Million) by Application (2021-2032)
10.1.3. Europe Fresh Grapes Revenue (USD Million) by Product (2021-2032)
By Type
Red Grapes
White Grapes
Rose Grapes
Others
By Application
Supermarkets/Hypermarkets
Convenience Stores
Independent Retailers
Online Sales
Others
Chapter 11. Asia Pacific Fresh Grapes Analysis and Outlook
11.1. Asia Pacific Fresh Grapes Revenue (USD Million), and Revenue (USD Million) by Segments (2021-2032)
11.1.1. Asia Pacific Fresh Grapes Revenue (USD Million) by Type (2021-2032)
11.1.2. Asia Pacific Fresh Grapes Revenue (USD Million) by Application (2021-2032)
11.1.3. Asia Pacific Fresh Grapes Revenue (USD Million) by Product (2021-2032)
By Type
Red Grapes
White Grapes
Rose Grapes
Others
By Application
Supermarkets/Hypermarkets
Convenience Stores
Independent Retailers
Online Sales
Others
Chapter 12. South America Fresh Grapes Analysis and Outlook
12.1. South America Fresh Grapes Revenue (USD Million), by Segments (2021-2032)
12.1.1. South America Fresh Grapes Revenue (USD Million) by Type (2021-2032)
12.1.2. South America Fresh Grapes Revenue (USD Million) by Application (2021-2032)
12.1.3. South America Fresh Grapes Revenue (USD Million) by Product (2021-2032)
By Type
Red Grapes
White Grapes
Rose Grapes
Others
By Application
Supermarkets/Hypermarkets
Convenience Stores
Independent Retailers
Online Sales
Others
Chapter 13. Middle East and Africa Fresh Grapes Analysis and Outlook
13.1. Middle East and Africa Fresh Grapes Revenue (USD Million), by Segments (2021-2032)
13.1.1. Middle East and Africa Fresh Grapes Revenue (USD Million) by Type (2021-2032)
13.1.2. Middle East and Africa Fresh Grapes Revenue (USD Million) by Application (2021-2032)
13.1.3. Middle East and Africa Fresh Grapes Revenue (USD Million) by Product (2021-2032)
By Type
Red Grapes
White Grapes
Rose Grapes
Others
By Application
Supermarkets/Hypermarkets
Convenience Stores
Independent Retailers
Online Sales
Others
Chapter 14. Fresh Grapes Company Profiles
14.1 Business Overview
14.2 Product Profiles
14.3 SWOT Profiles
14.5 Recent Developments
14.6 Financial Profile
List of Companies
Ardo
Dole Food
Earthbound Farm
Jinyuan Agriculture
Simplot
SunOpta Inc
SunPacific
Uran Food Group
Welchs Foods
Yantai Tianlong
15. Methodology and Data Sources
15.1 Customization Offerings
15.2 Subscription Services
15.3 Related Reports
15.4 Publisher Expertise
LIST OF TABLES
Table 1 Market Segmentation Analysis
Table 2 Global Fresh Grapes Market Share of Leading Companies, 2023
Table 3 Product Offerings of Leading Companies
Table 4 Low Growth Scenario Forecasts
Table 5 Reference Case Growth Scenario
Table 6 High Growth Case Scenario
Table 7 Global Fresh Grapes Revenue (USD Million) And CAGR (%) By Type (2021-2032)
Table 8 Global Fresh Grapes Revenue (USD Million) And CAGR (%) By Application (2021-2032)
Table 9 Global Fresh Grapes Revenue (USD Million) And CAGR (%) By Product (2021-2032)
Table 10 Global Fresh Grapes Market Revenue (USD Million) By Regions (2021-2032)
Table 11 Global Fresh Grapes Market Share (%) By Regions (2021-2032)
Table 12 North America Fresh Grapes Revenue (USD Million) By Country (2021-2032)
Table 13 Europe Fresh Grapes Revenue (USD Million) By Country (2021-2032)
Table 14 Asia Pacific Fresh Grapes Revenue (USD Million) By Country (2021-2032)
Table 15 South America Fresh Grapes Revenue (USD Million) By Country (2021-2032)
Table 16 Middle East and Africa Fresh Grapes Revenue (USD Million) By Region (2021-2032)
Table 17 North America Fresh Grapes Revenue (USD Million) By Type (2021-2032)
Table 18 North America Fresh Grapes Revenue (USD Million) By Application (2021-2032)
Table 19 North America Fresh Grapes Revenue (USD Million) By Product (2021-2032)
Table 20 Europe Fresh Grapes Revenue (USD Million) By Type (2021-2032)
Table 21 Europe Fresh Grapes Revenue (USD Million) By Application (2021-2032)
Table 22 Europe Fresh Grapes Revenue (USD Million) By Product (2021-2032)
Table 23 Asia Pacific Fresh Grapes Revenue (USD Million) By Type (2021-2032)
Table 24 Asia Pacific Fresh Grapes Revenue (USD Million) By Application (2021-2032)
Table 25 Asia Pacific Fresh Grapes Revenue (USD Million) By Product (2021-2032)
Table 26 South America Fresh Grapes Revenue (USD Million) By Type (2021-2032)
Table 27 South America Fresh Grapes Revenue (USD Million) By Application (2021-2032)
Table 28 South America Fresh Grapes Revenue (USD Million) By Product (2021-2032)
Table 29 Middle East and Africa Fresh Grapes Revenue (USD Million) By Type (2021-2032)
Table 30 Middle East and Africa Fresh Grapes Revenue (USD Million) By Application (2021-2032)
Table 31 Middle East and Africa Fresh Grapes Revenue (USD Million) By Product (2021-2032)
LIST OF FIGURES
Figure 1. Market Scope
Figure 2. Pricing Forecasts Per Unit, 2023- 2032
Figure 3. Porter’s Five Forces
Figure 4. Global Fresh Grapes Market Revenue (USD Million) By Regions (2021-2032)
Figure 5. Global Fresh Grapes Market Share (%) By Regions (2023)
Figure 6. North America Fresh Grapes Revenue (USD Million) By Country (2021-2032)
Figure 7. United States Fresh Grapes Revenue (USD Million) By Country (2021-2032)
Figure 8. Canada Fresh Grapes Revenue (USD Million) By Country (2021-2032)
Figure 9. Mexico Fresh Grapes Revenue (USD Million) By Country (2021-2032)
Figure 10. Europe Fresh Grapes Revenue (USD Million) By Country (2021-2032)
Figure 11. Germany Fresh Grapes Revenue (USD Million) By Country (2021-2032)
Figure 12. France Fresh Grapes Revenue (USD Million) By Country (2021-2032)
Figure 13. United Kingdom Fresh Grapes Revenue (USD Million) By Country (2021-2032)
Figure 14. Spain Fresh Grapes Revenue (USD Million) By Country (2021-2032)
Figure 15. Italy Fresh Grapes Revenue (USD Million) By Country (2021-2032)
Figure 16. Russia Fresh Grapes Revenue (USD Million) By Country (2021-2032)
Figure 17. Rest of Europe Fresh Grapes Revenue (USD Million) By Country (2021-2032)
Figure 11. Asia Pacific Fresh Grapes Revenue (USD Million) By Country (2021-2032)
Figure 12. China Fresh Grapes Revenue (USD Million) By Country (2021-2032)
Figure 13. Japan Fresh Grapes Revenue (USD Million) By Country (2021-2032)
Figure 14. India Fresh Grapes Revenue (USD Million) By Country (2021-2032)
Figure 15. South Korea Fresh Grapes Revenue (USD Million) By Country (2021-2032)
Figure 16. Australia Fresh Grapes Revenue (USD Million) By Country (2021-2032)
Figure 17. South East Asia Fresh Grapes Revenue (USD Million) By Country (2021-2032)
Figure 18. South America Fresh Grapes Revenue (USD Million) By Country (2021-2032)
Figure 19. Brazil Fresh Grapes Revenue (USD Million) By Country (2021-2032)
Figure 20. Argentina Fresh Grapes Revenue (USD Million) By Country (2021-2032)
Figure 21. Rest of Asia Pacific Fresh Grapes Revenue (USD Million) By Country (2021-2032)
Figure 22. Middle East and Africa Fresh Grapes Revenue (USD Million) By Region (2021-2032)
Figure 23. Saudi Arabia Fresh Grapes Revenue (USD Million) By Region (2021-2032)
Figure 24. The UAE Fresh Grapes Revenue (USD Million) By Region (2021-2032)
Figure 25. Rest of Middle East Fresh Grapes Revenue (USD Million) By Region (2021-2032)
Figure 26. South Africa Fresh Grapes Revenue (USD Million) By Region (2021-2032)
Figure 27. Africa Fresh Grapes Revenue (USD Million) By Region (2021-2032)
Figure 28. North America Fresh Grapes Revenue (USD Million) By Type (2021-2032)
Figure 29. North America Fresh Grapes Revenue (USD Million) By Application (2021-2032)
Figure 30. North America Fresh Grapes Revenue (USD Million) By Product (2021-2032)
Figure 31. Europe Fresh Grapes Revenue (USD Million) By Type (2021-2032)
Figure 32. Europe Fresh Grapes Revenue (USD Million) By Application (2021-2032)
Figure 33. Europe Fresh Grapes Revenue (USD Million) By Product (2021-2032)
Figure 34. Asia Pacific Fresh Grapes Revenue (USD Million) By Type (2021-2032)
Figure 35. Asia Pacific Fresh Grapes Revenue (USD Million) By Application (2021-2032)
Figure 36. Asia Pacific Fresh Grapes Revenue (USD Million) By Product (2021-2032)
Figure 37. South America Fresh Grapes Revenue (USD Million) By Type (2021-2032)
Figure 38. South America Fresh Grapes Revenue (USD Million) By Application (2021-2032)
Figure 39. South America Fresh Grapes Revenue (USD Million) By Product (2021-2032)
Figure 40. Middle East and Africa Fresh Grapes Revenue (USD Million) By Type (2021-2032)
Figure 41. Middle East and Africa Fresh Grapes Revenue (USD Million) By Application (2021-2032)
Figure 42. Middle East and Africa Fresh Grapes Revenue (USD Million) By Product (2021-2032)
By Type
Red Grapes
White Grapes
Rose Grapes
Others
By Application
Supermarkets/Hypermarkets
Convenience Stores
Independent Retailers
Online Sales
Others
Countries Analyzed
North America (US, Canada, Mexico)
Europe (Germany, UK, France, Spain, Italy, Russia, Rest of Europe)
Asia Pacific (China, India, Japan, South Korea, Australia, South East Asia, Rest of Asia)
South America (Brazil, Argentina, Rest of South America)
Middle East and Africa (Saudi Arabia, UAE, Rest of Middle East, South Africa, Egypt, Rest of Africa)
