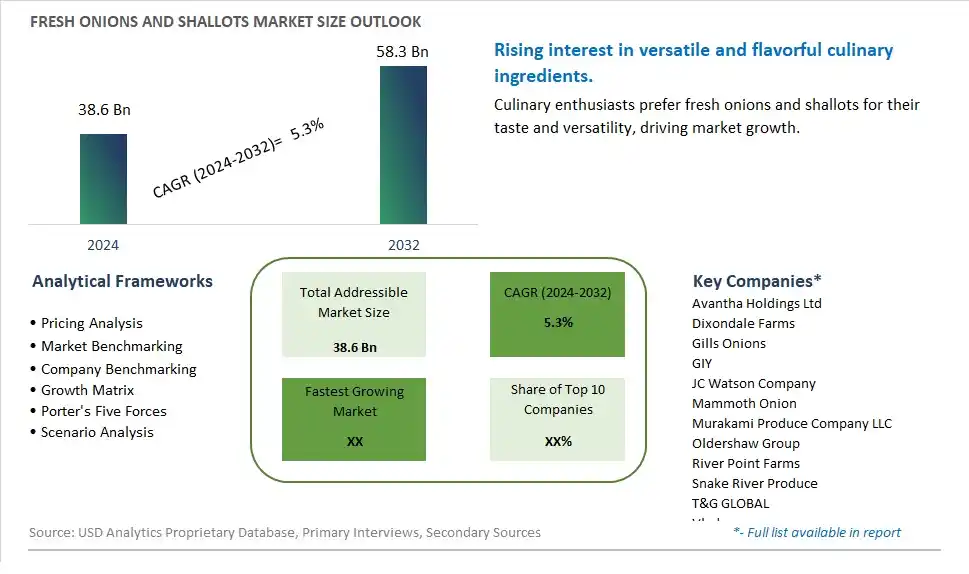
Global Fresh Onions and Shallots Market Size is valued at $38.6 Billion in 2024 and is forecast to register a growth rate (CAGR) of 5.3% to reach $58.3 Billion by 2032.
The global Fresh Onions and Shallots Market Comprehensive Study analyzes and forecasts the market size across 6 regions and 24 countries for diverse segments -By Product (Yellow Onions, Red Onions, White Onions, Spring Onions, Sweet Onions, Shallots, Others), By Form (Whole, Slices, Rings, Chopped, Minced, Others), By Application (Culinary, Soups, Sauces, and Dressings, Snacks & Convenience Foods, Bakery Products, Fast Food Restaurant Chains, Meat & Poultry Products, Others)
An Introduction to Fresh Onions and Shallots Market
In 2024, the Fresh Onions and Shallots market is experiencing significant growth, driven by the rising demand for essential cooking ingredients. Fresh onions and shallots, known for their flavor and versatility, are staples in kitchens around the world. The market benefits from advancements in cultivation and storage technologies, the growing trend of home cooking and gourmet recipes, and the expansion of the global fresh produce sector. Additionally, the increasing awareness of the health benefits of onions and shallots, such as their antioxidant and anti-inflammatory properties, is contributing to market growth.
Fresh Onions and Shallots Competitive Landscape
The market report analyses the leading companies in the industry including Avantha Holdings Ltd, Dixondale Farms, Gills Onions, GIY, JC Watson Company, Mammoth Onion, Murakami Produce Company LLC, Oldershaw Group, River Point Farms, Snake River Produce, T&G GLOBAL, Vladam, and Others.
Fresh Onions and Shallots Market Dynamics
Fresh Onions and Shallots Market Trend: Increasing Demand for Fresh and Locally Sourced Produce
The most prominent trend in the Fresh Onions and Shallots Market is the increasing demand for fresh and locally sourced produce. As consumers prioritize sustainability and food quality, there is a growing preference for onions and shallots that are sourced from local farms. This trend is driven by the desire for fresh, flavorful, and environmentally friendly ingredients that support local economies and reduce carbon footprints.
Fresh Onions and Shallots Market Driver: Growth in Home Cooking and Culinary Exploration
The key driver of the Fresh Onions and Shallots Market is the growth in home cooking and culinary exploration. As more people spend time at home and experiment with new recipes, there is a higher demand for fresh ingredients that enhance the flavor and aroma of dishes. Onions and shallots, known for their versatility and essential role in various cuisines, are increasingly used by home cooks and professional chefs alike, driving market growth.
Fresh Onions and Shallots Market Opportunity: Innovation in Packaging and Preservation
A significant opportunity in the Fresh Onions and Shallots Market lies in innovation in packaging and preservation. By developing packaging solutions that extend the shelf life and maintain the freshness of onions and shallots, companies can reduce food waste and improve product quality. Offering convenient packaging options, such as pre-cut or vacuum-sealed onions and shallots, can also attract busy consumers looking for time-saving solutions in the kitchen, driving market expansion.
Fresh Onions and Shallots Market Share Analysis: Yellow Onions segment generated the highest revenue share in the industry
Yellow onions are the largest segment in the Fresh Onions and Shallots Market by product type. This dominance is driven by their widespread use and versatility in various culinary applications across different cuisines globally. Yellow onions are favored for their balance of sweetness and acidity, making them an essential ingredient in numerous dishes, from soups and stews to sauces and salads. They are also the preferred choice for caramelizing, a process that enhances their natural sweetness and adds depth to many recipes. The high yield and longer shelf life of yellow onions compared to other varieties make them a staple in both commercial and home kitchens. Furthermore, their availability throughout the year ensures a consistent supply, catering to the constant demand from both consumers and the food service industry. The popularity of yellow onions is further boosted by their nutritional benefits, including being a good source of vitamins, minerals, and antioxidants, which align with the growing consumer trend towards healthy eating. As a result, yellow onions continue to lead the market in terms of volume and value, reinforcing their position as the largest segment in the Fresh Onions and Shallots Market.
Fresh Onions and Shallots Market Share Analysis: Chopped is the fastest growing segment over the forecast period to 2032
The chopped segment is the fastest-growing segment in the Fresh Onions and Shallots Market by form, projected to experience significant growth by 2032. This surge is primarily driven by the increasing demand for convenience among consumers and foodservice providers. Chopped onions and shallots save considerable preparation time, making them highly attractive to busy households and professional kitchens alike. The growth of ready-to-eat and meal kit services, which often include pre-chopped ingredients to streamline the cooking process, further fuels this demand. Additionally, the rise of health-conscious consumers seeking to incorporate more fresh produce into their diets without the hassle of extensive preparation has bolstered the popularity of chopped onions and shallots. Retailers and food manufacturers are responding to this trend by expanding their offerings of pre-cut vegetables, ensuring a steady supply to meet the growing consumer base. The advancement in packaging technology that maintains the freshness and extends the shelf life of chopped products also contributes to their rising popularity. As lifestyles become increasingly fast-paced, the preference for pre-prepared ingredients like chopped onions and shallots is set to drive this segment's rapid growth, making it the standout performer in the Fresh Onions and Shallots Market.
Fresh Onions and Shallots Market Share Analysis: Culinary segment generated the highest revenue share in the industry
The culinary segment is the largest and fastest-growing segment in the Fresh Onions and Shallots Market by application. This dominance is attributed to the fundamental role that onions and shallots play in a wide array of culinary traditions worldwide. Used as a base ingredient in countless dishes, including soups, stews, stir-fries, and casseroles, onions and shallots are indispensable in creating depth of flavor and enhancing the overall taste profile of meals. The versatility of these alliums makes them a staple in both home kitchens and professional culinary environments. The increasing trend towards home cooking, spurred by a growing interest in healthy eating and cooking from scratch, has further boosted the demand for fresh onions and shallots. Additionally, the culinary segment benefits from the expanding global food culture, with consumers exploring and adopting diverse cuisines that heavily rely on these ingredients. The rise of cooking shows, food blogs, and recipe-sharing platforms has also played a significant role in promoting the use of fresh onions and shallots in everyday cooking. As consumers continue to seek high-quality, fresh ingredients to prepare flavorful and nutritious meals, the culinary segment is set to maintain its leading position in the Fresh Onions and Shallots Market.
Fresh Onions and Shallots Market Segmentation
By Product
Yellow Onions
Red Onions
White Onions
Spring Onions
Sweet Onions
Shallots
Others
By Form
Whole
Slices
Rings
Chopped
Minced
Others
By Application
Culinary
Soups, Sauces, and Dressings
Snacks & Convenience Foods
Bakery Products
Fast Food Restaurant Chains
Meat & Poultry Products
Others
Countries Analyzed
North America (US, Canada, Mexico)
Europe (Germany, UK, France, Spain, Italy, Russia, Rest of Europe)
Asia Pacific (China, India, Japan, South Korea, Australia, South East Asia, Rest of Asia)
South America (Brazil, Argentina, Rest of South America)
Middle East and Africa (Saudi Arabia, UAE, Rest of Middle East, South Africa, Egypt, Rest of Africa)
Fresh Onions and Shallots Companies Profiled in the Study
Avantha Holdings Ltd
Dixondale Farms
Gills Onions
GIY
JC Watson Company
Mammoth Onion
Murakami Produce Company LLC
Oldershaw Group
River Point Farms
Snake River Produce
T&G GLOBAL
Vladam
*- List Not Exhaustive
Chapter 1. TABLE OF CONTENTS
Chapter 2. Introduction to Fresh Onions and Shallots Market
2.1. Market Overview
2.2. Key Statistics and Report Highlights
2.3. Scope of the Comprehensive Study
2.3.1. Market Definition
2.3.2 Countries and Regions Covered
2.3.3 Research Objective
2.3.4 Units, Currency, and Conversions
2.3.5 Industry Value Chain
2.4. Key Market Segments
2.5. Key Companies
2.6. Study Period
Chapter 3. Strategic Analysis Review
3.1. Fresh Onions and Shallots Pricing Analysis and Forecast
3.2. Porter’s Five Forces
3.3. Market Ecosystem
3.4. SWOT Analysis
3.5. Regulatory Scenario
3.3. Effects of Inflation, Russia-Ukraine War, moderating economic growth, and other macroeconomic factors
Chapter 4. Competitive Landscape
4.1. Market Share Analysis
4.1.1. Global Fresh Onions and Shallots Market Share by Company, 2023
4.1.2. Product Offerings of Leading Fresh Onions and Shallots Companies
4.2. Market Entropy
4.2.1. New Product Launches in the Industry
4.2.2. Mergers, Acquisitions, Joint ventures, and Partnerships
4.3. Key Strategies and Best Practices
Chapter 5. Global Market Projections: Best, Reference, and Low Case Scenarios
5.1. Growth Analysis- Case Scenario Definitions
5.2. Low Growth Case Scenario Forecasts
5.3. Reference Growth Case Scenario Forecasts
5.4. High Growth Case Scenario Forecasts
Chapter 6. Market Dynamics
6.1. Fresh Onions and Shallots Market Drivers
6.2. Fresh Onions and Shallots Market Challenges
6.6. Fresh Onions and Shallots Market Opportunities
6.4. Fresh Onions and Shallots Market Trends
Chapter 7. Global Fresh Onions and Shallots Market Outlook Trends
7.1. Global Fresh Onions and Shallots Revenue (USD Million) and CAGR (%) by Type (2021-2032)
7.2. Global Fresh Onions and Shallots Revenue (USD Million) and CAGR (%) by Application (2021-2032)
7.3. Global Fresh Onions and Shallots Revenue (USD Million) and CAGR (%) by Product (2021-2032)
By Product
Yellow Onions
Red Onions
White Onions
Spring Onions
Sweet Onions
Shallots
Others
By Form
Whole
Slices
Rings
Chopped
Minced
Others
By Application
Culinary
Soups, Sauces, and Dressings
Snacks & Convenience Foods
Bakery Products
Fast Food Restaurant Chains
Meat & Poultry Products
Others
Chapter 8. Global Fresh Onions and Shallots Regional Analysis and Outlook
8.1. Global Fresh Onions and Shallots Revenue (USD Million) By Regions (2021- 2032)
8.2. North America Fresh Onions and Shallots Revenue (USD Million) by Country (2021-2032)
8.2.1. United States Fresh Onions and Shallots Regional Analysis and Outlook
8.2.2. Canada Fresh Onions and Shallots Regional Analysis and Outlook
8.2.3. Mexico Fresh Onions and Shallots Regional Analysis and Outlook
8.3. Europe Fresh Onions and Shallots Revenue (USD Million), by Country (2021-2032)
8.3.1. Germany Fresh Onions and Shallots Regional Analysis and Outlook
8.3.2. France Fresh Onions and Shallots Regional Analysis and Outlook
8.3.3. United Kingdom Fresh Onions and Shallots Regional Analysis and Outlook
8.3.4. Spain Fresh Onions and Shallots Regional Analysis and Outlook
8.3.5. Italy Fresh Onions and Shallots Regional Analysis and Outlook
8.3.6. Russia Fresh Onions and Shallots Regional Analysis and Outlook
8.3.7. Rest of Europe Fresh Onions and Shallots Regional Analysis and Outlook
8.4. Asia Pacific Fresh Onions and Shallots Revenue (USD Million) by Country (2021-2032)
8.4.1. China Fresh Onions and Shallots Regional Analysis and Outlook
8.4.2. Japan Fresh Onions and Shallots Regional Analysis and Outlook
8.4.3. India Fresh Onions and Shallots Regional Analysis and Outlook
8.4.4. South Korea Fresh Onions and Shallots Regional Analysis and Outlook
8.4.5. Australia Fresh Onions and Shallots Regional Analysis and Outlook
8.4.6. South East Asia Fresh Onions and Shallots Regional Analysis and Outlook
8.4.7. Rest of Asia Pacific Fresh Onions and Shallots Regional Analysis and Outlook
8.5. South America Fresh Onions and Shallots Revenue (USD Million), by Country (2021-2032)
8.5.1. Brazil Fresh Onions and Shallots Regional Analysis and Outlook
8.5.2. Argentina Fresh Onions and Shallots Regional Analysis and Outlook
8.5.3. Rest of South America Fresh Onions and Shallots Regional Analysis and Outlook
8.6. Middle East and Africa Fresh Onions and Shallots Revenue (USD Million) by Country (2021-2032)
8.6.1. Middle East Fresh Onions and Shallots Regional Analysis and Outlook
8.6.2. Africa Fresh Onions and Shallots Regional Analysis and Outlook
Chapter 9. North America Fresh Onions and Shallots Analysis and Outlook
9.1. North America Fresh Onions and Shallots Revenue (USD Million) by Segments (2021-2032)
9.1.1. North America Fresh Onions and Shallots Revenue (USD Million) by Type (2021-2032)
9.1.2. North America Fresh Onions and Shallots Revenue (USD Million) by Application (2021-2032)
9.1.3. North America Fresh Onions and Shallots Revenue (USD Million) by Product (2021-2032)
By Product
Yellow Onions
Red Onions
White Onions
Spring Onions
Sweet Onions
Shallots
Others
By Form
Whole
Slices
Rings
Chopped
Minced
Others
By Application
Culinary
Soups, Sauces, and Dressings
Snacks & Convenience Foods
Bakery Products
Fast Food Restaurant Chains
Meat & Poultry Products
Others
Chapter 10. Europe Fresh Onions and Shallots Analysis and Outlook
10.1. Europe Fresh Onions and Shallots Revenue (USD Million), by Segments (USD Million) (2021-2032)
10.1.1. Europe Fresh Onions and Shallots Revenue (USD Million) by Type (2021-2032)
10.1.2. Europe Fresh Onions and Shallots Revenue (USD Million) by Application (2021-2032)
10.1.3. Europe Fresh Onions and Shallots Revenue (USD Million) by Product (2021-2032)
By Product
Yellow Onions
Red Onions
White Onions
Spring Onions
Sweet Onions
Shallots
Others
By Form
Whole
Slices
Rings
Chopped
Minced
Others
By Application
Culinary
Soups, Sauces, and Dressings
Snacks & Convenience Foods
Bakery Products
Fast Food Restaurant Chains
Meat & Poultry Products
Others
Chapter 11. Asia Pacific Fresh Onions and Shallots Analysis and Outlook
11.1. Asia Pacific Fresh Onions and Shallots Revenue (USD Million), and Revenue (USD Million) by Segments (2021-2032)
11.1.1. Asia Pacific Fresh Onions and Shallots Revenue (USD Million) by Type (2021-2032)
11.1.2. Asia Pacific Fresh Onions and Shallots Revenue (USD Million) by Application (2021-2032)
11.1.3. Asia Pacific Fresh Onions and Shallots Revenue (USD Million) by Product (2021-2032)
By Product
Yellow Onions
Red Onions
White Onions
Spring Onions
Sweet Onions
Shallots
Others
By Form
Whole
Slices
Rings
Chopped
Minced
Others
By Application
Culinary
Soups, Sauces, and Dressings
Snacks & Convenience Foods
Bakery Products
Fast Food Restaurant Chains
Meat & Poultry Products
Others
Chapter 12. South America Fresh Onions and Shallots Analysis and Outlook
12.1. South America Fresh Onions and Shallots Revenue (USD Million), by Segments (2021-2032)
12.1.1. South America Fresh Onions and Shallots Revenue (USD Million) by Type (2021-2032)
12.1.2. South America Fresh Onions and Shallots Revenue (USD Million) by Application (2021-2032)
12.1.3. South America Fresh Onions and Shallots Revenue (USD Million) by Product (2021-2032)
By Product
Yellow Onions
Red Onions
White Onions
Spring Onions
Sweet Onions
Shallots
Others
By Form
Whole
Slices
Rings
Chopped
Minced
Others
By Application
Culinary
Soups, Sauces, and Dressings
Snacks & Convenience Foods
Bakery Products
Fast Food Restaurant Chains
Meat & Poultry Products
Others
Chapter 13. Middle East and Africa Fresh Onions and Shallots Analysis and Outlook
13.1. Middle East and Africa Fresh Onions and Shallots Revenue (USD Million), by Segments (2021-2032)
13.1.1. Middle East and Africa Fresh Onions and Shallots Revenue (USD Million) by Type (2021-2032)
13.1.2. Middle East and Africa Fresh Onions and Shallots Revenue (USD Million) by Application (2021-2032)
13.1.3. Middle East and Africa Fresh Onions and Shallots Revenue (USD Million) by Product (2021-2032)
By Product
Yellow Onions
Red Onions
White Onions
Spring Onions
Sweet Onions
Shallots
Others
By Form
Whole
Slices
Rings
Chopped
Minced
Others
By Application
Culinary
Soups, Sauces, and Dressings
Snacks & Convenience Foods
Bakery Products
Fast Food Restaurant Chains
Meat & Poultry Products
Others
Chapter 14. Fresh Onions and Shallots Company Profiles
14.1 Business Overview
14.2 Product Profiles
14.3 SWOT Profiles
14.5 Recent Developments
14.6 Financial Profile
List of Companies
Avantha Holdings Ltd
Dixondale Farms
Gills Onions
GIY
JC Watson Company
Mammoth Onion
Murakami Produce Company LLC
Oldershaw Group
River Point Farms
Snake River Produce
T&G GLOBAL
Vladam
15. Methodology and Data Sources
15.1 Customization Offerings
15.2 Subscription Services
15.3 Related Reports
15.4 Publisher Expertise
LIST OF TABLES
Table 1 Market Segmentation Analysis
Table 2 Global Fresh Onions and Shallots Market Share of Leading Companies, 2023
Table 3 Product Offerings of Leading Companies
Table 4 Low Growth Scenario Forecasts
Table 5 Reference Case Growth Scenario
Table 6 High Growth Case Scenario
Table 7 Global Fresh Onions and Shallots Revenue (USD Million) And CAGR (%) By Type (2021-2032)
Table 8 Global Fresh Onions and Shallots Revenue (USD Million) And CAGR (%) By Application (2021-2032)
Table 9 Global Fresh Onions and Shallots Revenue (USD Million) And CAGR (%) By Product (2021-2032)
Table 10 Global Fresh Onions and Shallots Market Revenue (USD Million) By Regions (2021-2032)
Table 11 Global Fresh Onions and Shallots Market Share (%) By Regions (2021-2032)
Table 12 North America Fresh Onions and Shallots Revenue (USD Million) By Country (2021-2032)
Table 13 Europe Fresh Onions and Shallots Revenue (USD Million) By Country (2021-2032)
Table 14 Asia Pacific Fresh Onions and Shallots Revenue (USD Million) By Country (2021-2032)
Table 15 South America Fresh Onions and Shallots Revenue (USD Million) By Country (2021-2032)
Table 16 Middle East and Africa Fresh Onions and Shallots Revenue (USD Million) By Region (2021-2032)
Table 17 North America Fresh Onions and Shallots Revenue (USD Million) By Type (2021-2032)
Table 18 North America Fresh Onions and Shallots Revenue (USD Million) By Application (2021-2032)
Table 19 North America Fresh Onions and Shallots Revenue (USD Million) By Product (2021-2032)
Table 20 Europe Fresh Onions and Shallots Revenue (USD Million) By Type (2021-2032)
Table 21 Europe Fresh Onions and Shallots Revenue (USD Million) By Application (2021-2032)
Table 22 Europe Fresh Onions and Shallots Revenue (USD Million) By Product (2021-2032)
Table 23 Asia Pacific Fresh Onions and Shallots Revenue (USD Million) By Type (2021-2032)
Table 24 Asia Pacific Fresh Onions and Shallots Revenue (USD Million) By Application (2021-2032)
Table 25 Asia Pacific Fresh Onions and Shallots Revenue (USD Million) By Product (2021-2032)
Table 26 South America Fresh Onions and Shallots Revenue (USD Million) By Type (2021-2032)
Table 27 South America Fresh Onions and Shallots Revenue (USD Million) By Application (2021-2032)
Table 28 South America Fresh Onions and Shallots Revenue (USD Million) By Product (2021-2032)
Table 29 Middle East and Africa Fresh Onions and Shallots Revenue (USD Million) By Type (2021-2032)
Table 30 Middle East and Africa Fresh Onions and Shallots Revenue (USD Million) By Application (2021-2032)
Table 31 Middle East and Africa Fresh Onions and Shallots Revenue (USD Million) By Product (2021-2032)
LIST OF FIGURES
Figure 1. Market Scope
Figure 2. Pricing Forecasts Per Unit, 2023- 2032
Figure 3. Porter’s Five Forces
Figure 4. Global Fresh Onions and Shallots Market Revenue (USD Million) By Regions (2021-2032)
Figure 5. Global Fresh Onions and Shallots Market Share (%) By Regions (2023)
Figure 6. North America Fresh Onions and Shallots Revenue (USD Million) By Country (2021-2032)
Figure 7. United States Fresh Onions and Shallots Revenue (USD Million) By Country (2021-2032)
Figure 8. Canada Fresh Onions and Shallots Revenue (USD Million) By Country (2021-2032)
Figure 9. Mexico Fresh Onions and Shallots Revenue (USD Million) By Country (2021-2032)
Figure 10. Europe Fresh Onions and Shallots Revenue (USD Million) By Country (2021-2032)
Figure 11. Germany Fresh Onions and Shallots Revenue (USD Million) By Country (2021-2032)
Figure 12. France Fresh Onions and Shallots Revenue (USD Million) By Country (2021-2032)
Figure 13. United Kingdom Fresh Onions and Shallots Revenue (USD Million) By Country (2021-2032)
Figure 14. Spain Fresh Onions and Shallots Revenue (USD Million) By Country (2021-2032)
Figure 15. Italy Fresh Onions and Shallots Revenue (USD Million) By Country (2021-2032)
Figure 16. Russia Fresh Onions and Shallots Revenue (USD Million) By Country (2021-2032)
Figure 17. Rest of Europe Fresh Onions and Shallots Revenue (USD Million) By Country (2021-2032)
Figure 11. Asia Pacific Fresh Onions and Shallots Revenue (USD Million) By Country (2021-2032)
Figure 12. China Fresh Onions and Shallots Revenue (USD Million) By Country (2021-2032)
Figure 13. Japan Fresh Onions and Shallots Revenue (USD Million) By Country (2021-2032)
Figure 14. India Fresh Onions and Shallots Revenue (USD Million) By Country (2021-2032)
Figure 15. South Korea Fresh Onions and Shallots Revenue (USD Million) By Country (2021-2032)
Figure 16. Australia Fresh Onions and Shallots Revenue (USD Million) By Country (2021-2032)
Figure 17. South East Asia Fresh Onions and Shallots Revenue (USD Million) By Country (2021-2032)
Figure 18. South America Fresh Onions and Shallots Revenue (USD Million) By Country (2021-2032)
Figure 19. Brazil Fresh Onions and Shallots Revenue (USD Million) By Country (2021-2032)
Figure 20. Argentina Fresh Onions and Shallots Revenue (USD Million) By Country (2021-2032)
Figure 21. Rest of Asia Pacific Fresh Onions and Shallots Revenue (USD Million) By Country (2021-2032)
Figure 22. Middle East and Africa Fresh Onions and Shallots Revenue (USD Million) By Region (2021-2032)
Figure 23. Saudi Arabia Fresh Onions and Shallots Revenue (USD Million) By Region (2021-2032)
Figure 24. The UAE Fresh Onions and Shallots Revenue (USD Million) By Region (2021-2032)
Figure 25. Rest of Middle East Fresh Onions and Shallots Revenue (USD Million) By Region (2021-2032)
Figure 26. South Africa Fresh Onions and Shallots Revenue (USD Million) By Region (2021-2032)
Figure 27. Africa Fresh Onions and Shallots Revenue (USD Million) By Region (2021-2032)
Figure 28. North America Fresh Onions and Shallots Revenue (USD Million) By Type (2021-2032)
Figure 29. North America Fresh Onions and Shallots Revenue (USD Million) By Application (2021-2032)
Figure 30. North America Fresh Onions and Shallots Revenue (USD Million) By Product (2021-2032)
Figure 31. Europe Fresh Onions and Shallots Revenue (USD Million) By Type (2021-2032)
Figure 32. Europe Fresh Onions and Shallots Revenue (USD Million) By Application (2021-2032)
Figure 33. Europe Fresh Onions and Shallots Revenue (USD Million) By Product (2021-2032)
Figure 34. Asia Pacific Fresh Onions and Shallots Revenue (USD Million) By Type (2021-2032)
Figure 35. Asia Pacific Fresh Onions and Shallots Revenue (USD Million) By Application (2021-2032)
Figure 36. Asia Pacific Fresh Onions and Shallots Revenue (USD Million) By Product (2021-2032)
Figure 37. South America Fresh Onions and Shallots Revenue (USD Million) By Type (2021-2032)
Figure 38. South America Fresh Onions and Shallots Revenue (USD Million) By Application (2021-2032)
Figure 39. South America Fresh Onions and Shallots Revenue (USD Million) By Product (2021-2032)
Figure 40. Middle East and Africa Fresh Onions and Shallots Revenue (USD Million) By Type (2021-2032)
Figure 41. Middle East and Africa Fresh Onions and Shallots Revenue (USD Million) By Application (2021-2032)
Figure 42. Middle East and Africa Fresh Onions and Shallots Revenue (USD Million) By Product (2021-2032)
By Product
Yellow Onions
Red Onions
White Onions
Spring Onions
Sweet Onions
Shallots
Others
By Form
Whole
Slices
Rings
Chopped
Minced
Others
By Application
Culinary
Soups, Sauces, and Dressings
Snacks & Convenience Foods
Bakery Products
Fast Food Restaurant Chains
Meat & Poultry Products
Others
Countries Analyzed
North America (US, Canada, Mexico)
Europe (Germany, UK, France, Spain, Italy, Russia, Rest of Europe)
Asia Pacific (China, India, Japan, South Korea, Australia, South East Asia, Rest of Asia)
South America (Brazil, Argentina, Rest of South America)
Middle East and Africa (Saudi Arabia, UAE, Rest of Middle East, South Africa, Egypt, Rest of Africa)
