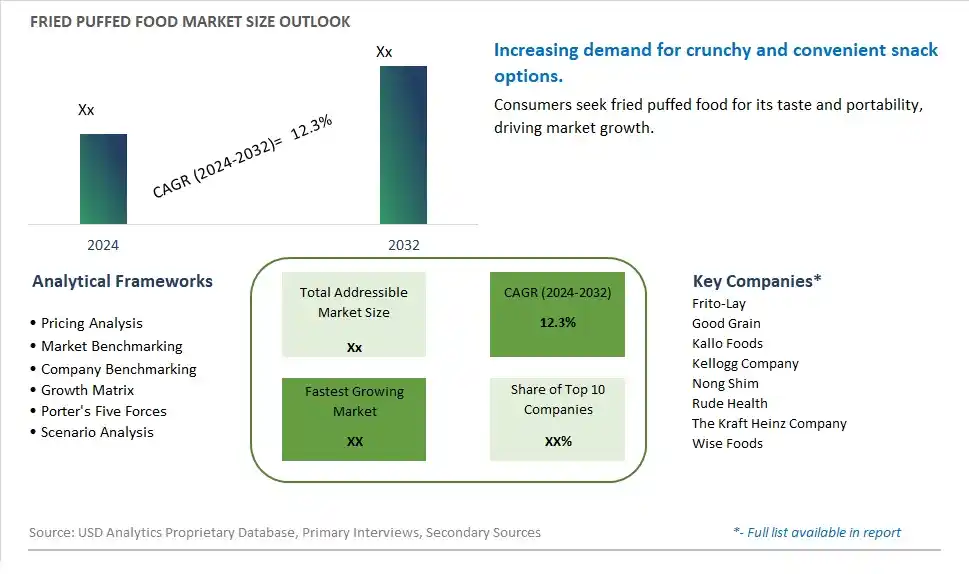
Global Fried Puffed Food Market Size is valued at $XX Million in 2024 and is forecast to register a growth rate (CAGR) of 12.3% to reach $XX Million by 2032.
The global Fried Puffed Food Market Comprehensive Study analyzes and forecasts the market size across 6 regions and 24 countries for diverse segments -By Type (Cereal, Yam, Beans, Others), By Distribution Channel (Hypermarkets/Supermarkets, Convenience Stores, Online, Others)
An Introduction to Fried Puffed Food Market
In 2024, the Fried Puffed Food market is thriving, fueled by the rising demand for crispy and convenient snack options. Fried puffed foods, including chips, snacks, and extruded products, are popular for their texture and flavor. The market benefits from advancements in frying and puffing technologies, the growing trend of convenience and on-the-go snacks, and the expansion of the global snack food sector. Additionally, the increasing focus on innovative flavors and healthier snack options is driving market growth.
Fried Puffed Food Competitive Landscape
The market report analyses the leading companies in the industry including Frito-Lay, Good Grain, Kallo Foods, Kellogg Company, Nong Shim, Rude Health, The Kraft Heinz Company, Wise Foods, and Others.
Fried Puffed Food Market Dynamics
Fried Puffed Food Market Trend: Rising Popularity of Snack Foods
The most prominent trend in the Fried Puffed Food Market is the rising popularity of snack foods. As consumers seek convenient and tasty snack options, fried puffed foods are gaining traction for their crispy texture and flavor variety. This trend is driven by the increasing demand for on-the-go snacks that provide quick satisfaction and indulgence, making fried puffed foods a popular choice among snack enthusiasts.
Fried Puffed Food Market Driver: Growth in Global Snack Industry
The key driver of the Fried Puffed Food Market is the growth in the global snack industry. As busy lifestyles and the trend towards snacking between meals drive higher consumption of snack foods, there is a corresponding increase in the demand for fried puffed products. This driver is supported by the expansion of snack food offerings and the introduction of new flavors and varieties, driving market growth for fried puffed foods.
Fried Puffed Food Market Opportunity: Development of Healthier Snack Options
A significant opportunity in the Fried Puffed Food Market lies in the development of healthier snack options. By creating fried puffed snacks with reduced fat and calorie content, using healthier oils, and incorporating natural ingredients, companies can attract health-conscious consumers. Offering snacks that combine great taste with better nutritional profiles can help expand market reach and increase consumer satisfaction, driving growth in the healthier snack segment.
Fried Puffed Food Market Share Analysis: Cereal segment generated the highest revenue share in the industry
Cereal is the largest and fastest-growing segment in the Fried Puffed Food Market by type. This segment's dominance is driven by the widespread popularity and consumption of cereal-based puffed snacks, which appeal to a broad demographic due to their taste, texture, and nutritional benefits. Cereal-based puffed foods, such as puffed rice, corn puffs, and wheat puffs, are favored for their light and crispy texture, making them a preferred choice for both children and adults. The versatility of cereal allows for the creation of a variety of flavored and seasoned puffed snacks, catering to diverse consumer preferences and dietary needs. Additionally, the growing trend towards healthy snacking has boosted the demand for cereal puffed foods, as they are often marketed as low-calorie, high-fiber, and whole-grain options. The convenience of ready-to-eat cereal puffed snacks also contributes to their popularity, fitting well into the busy lifestyles of modern consumers. Further, advancements in food processing technologies have improved the quality and shelf life of these products, further enhancing their appeal. As consumers continue to seek tasty and nutritious snack options, the cereal segment is expected to maintain its leading position and experience robust growth in the Fried Puffed Food Market.
Fried Puffed Food Market Share Analysis: Online is the fastest growing segment over the forecast period to 2032
The online segment is the fastest-growing distribution channel in the Fried Puffed Food Market, projected to experience substantial growth by 2032. This rapid expansion is primarily driven by the increasing consumer preference for the convenience and ease of online shopping. E-commerce platforms and online retailers offer a wide variety of fried puffed foods, providing consumers with numerous choices that may not be available in physical stores. The rise of digital grocery shopping, accelerated by the Past few years, has made it easier for consumers to purchase their favorite snacks from the comfort of their homes. Online platforms also provide detailed product information, customer reviews, and competitive pricing, which help consumers make informed decisions. Additionally, the use of targeted marketing and personalized recommendations through digital channels enhances the shopping experience, attracting a broader customer base. Subscription services and regular promotions further incentivize consumers to buy fried puffed foods online. As more consumers embrace the convenience of online shopping and digital technologies continue to evolve, the online distribution channel is set to lead the growth trajectory in the Fried Puffed Food Market.
Fried Puffed Food Market Segmentation
By Type
Cereal
Yam
Beans
Others
By Distribution Channel
Hypermarkets/Supermarkets
Convenience Stores
Online
Others
Countries Analyzed
North America (US, Canada, Mexico)
Europe (Germany, UK, France, Spain, Italy, Russia, Rest of Europe)
Asia Pacific (China, India, Japan, South Korea, Australia, South East Asia, Rest of Asia)
South America (Brazil, Argentina, Rest of South America)
Middle East and Africa (Saudi Arabia, UAE, Rest of Middle East, South Africa, Egypt, Rest of Africa)
Fried Puffed Food Companies Profiled in the Study
Frito-Lay
Good Grain
Kallo Foods
Kellogg Company
Nong Shim
Rude Health
The Kraft Heinz Company
Wise Foods
*- List Not Exhaustive
Chapter 1. TABLE OF CONTENTS
Chapter 2. Introduction to Fried Puffed Food Market
2.1. Market Overview
2.2. Key Statistics and Report Highlights
2.3. Scope of the Comprehensive Study
2.3.1. Market Definition
2.3.2 Countries and Regions Covered
2.3.3 Research Objective
2.3.4 Units, Currency, and Conversions
2.3.5 Industry Value Chain
2.4. Key Market Segments
2.5. Key Companies
2.6. Study Period
Chapter 3. Strategic Analysis Review
3.1. Fried Puffed Food Pricing Analysis and Forecast
3.2. Porter’s Five Forces
3.3. Market Ecosystem
3.4. SWOT Analysis
3.5. Regulatory Scenario
3.3. Effects of Inflation, Russia-Ukraine War, moderating economic growth, and other macroeconomic factors
Chapter 4. Competitive Landscape
4.1. Market Share Analysis
4.1.1. Global Fried Puffed Food Market Share by Company, 2023
4.1.2. Product Offerings of Leading Fried Puffed Food Companies
4.2. Market Entropy
4.2.1. New Product Launches in the Industry
4.2.2. Mergers, Acquisitions, Joint ventures, and Partnerships
4.3. Key Strategies and Best Practices
Chapter 5. Global Market Projections: Best, Reference, and Low Case Scenarios
5.1. Growth Analysis- Case Scenario Definitions
5.2. Low Growth Case Scenario Forecasts
5.3. Reference Growth Case Scenario Forecasts
5.4. High Growth Case Scenario Forecasts
Chapter 6. Market Dynamics
6.1. Fried Puffed Food Market Drivers
6.2. Fried Puffed Food Market Challenges
6.6. Fried Puffed Food Market Opportunities
6.4. Fried Puffed Food Market Trends
Chapter 7. Global Fried Puffed Food Market Outlook Trends
7.1. Global Fried Puffed Food Revenue (USD Million) and CAGR (%) by Type (2021-2032)
7.2. Global Fried Puffed Food Revenue (USD Million) and CAGR (%) by Application (2021-2032)
7.3. Global Fried Puffed Food Revenue (USD Million) and CAGR (%) by Product (2021-2032)
By Type
Cereal
Yam
Beans
Others
By Distribution Channel
Hypermarkets/Supermarkets
Convenience Stores
Online
Others
Chapter 8. Global Fried Puffed Food Regional Analysis and Outlook
8.1. Global Fried Puffed Food Revenue (USD Million) By Regions (2021- 2032)
8.2. North America Fried Puffed Food Revenue (USD Million) by Country (2021-2032)
8.2.1. United States Fried Puffed Food Regional Analysis and Outlook
8.2.2. Canada Fried Puffed Food Regional Analysis and Outlook
8.2.3. Mexico Fried Puffed Food Regional Analysis and Outlook
8.3. Europe Fried Puffed Food Revenue (USD Million), by Country (2021-2032)
8.3.1. Germany Fried Puffed Food Regional Analysis and Outlook
8.3.2. France Fried Puffed Food Regional Analysis and Outlook
8.3.3. United Kingdom Fried Puffed Food Regional Analysis and Outlook
8.3.4. Spain Fried Puffed Food Regional Analysis and Outlook
8.3.5. Italy Fried Puffed Food Regional Analysis and Outlook
8.3.6. Russia Fried Puffed Food Regional Analysis and Outlook
8.3.7. Rest of Europe Fried Puffed Food Regional Analysis and Outlook
8.4. Asia Pacific Fried Puffed Food Revenue (USD Million) by Country (2021-2032)
8.4.1. China Fried Puffed Food Regional Analysis and Outlook
8.4.2. Japan Fried Puffed Food Regional Analysis and Outlook
8.4.3. India Fried Puffed Food Regional Analysis and Outlook
8.4.4. South Korea Fried Puffed Food Regional Analysis and Outlook
8.4.5. Australia Fried Puffed Food Regional Analysis and Outlook
8.4.6. South East Asia Fried Puffed Food Regional Analysis and Outlook
8.4.7. Rest of Asia Pacific Fried Puffed Food Regional Analysis and Outlook
8.5. South America Fried Puffed Food Revenue (USD Million), by Country (2021-2032)
8.5.1. Brazil Fried Puffed Food Regional Analysis and Outlook
8.5.2. Argentina Fried Puffed Food Regional Analysis and Outlook
8.5.3. Rest of South America Fried Puffed Food Regional Analysis and Outlook
8.6. Middle East and Africa Fried Puffed Food Revenue (USD Million) by Country (2021-2032)
8.6.1. Middle East Fried Puffed Food Regional Analysis and Outlook
8.6.2. Africa Fried Puffed Food Regional Analysis and Outlook
Chapter 9. North America Fried Puffed Food Analysis and Outlook
9.1. North America Fried Puffed Food Revenue (USD Million) by Segments (2021-2032)
9.1.1. North America Fried Puffed Food Revenue (USD Million) by Type (2021-2032)
9.1.2. North America Fried Puffed Food Revenue (USD Million) by Application (2021-2032)
9.1.3. North America Fried Puffed Food Revenue (USD Million) by Product (2021-2032)
By Type
Cereal
Yam
Beans
Others
By Distribution Channel
Hypermarkets/Supermarkets
Convenience Stores
Online
Others
Chapter 10. Europe Fried Puffed Food Analysis and Outlook
10.1. Europe Fried Puffed Food Revenue (USD Million), by Segments (USD Million) (2021-2032)
10.1.1. Europe Fried Puffed Food Revenue (USD Million) by Type (2021-2032)
10.1.2. Europe Fried Puffed Food Revenue (USD Million) by Application (2021-2032)
10.1.3. Europe Fried Puffed Food Revenue (USD Million) by Product (2021-2032)
By Type
Cereal
Yam
Beans
Others
By Distribution Channel
Hypermarkets/Supermarkets
Convenience Stores
Online
Others
Chapter 11. Asia Pacific Fried Puffed Food Analysis and Outlook
11.1. Asia Pacific Fried Puffed Food Revenue (USD Million), and Revenue (USD Million) by Segments (2021-2032)
11.1.1. Asia Pacific Fried Puffed Food Revenue (USD Million) by Type (2021-2032)
11.1.2. Asia Pacific Fried Puffed Food Revenue (USD Million) by Application (2021-2032)
11.1.3. Asia Pacific Fried Puffed Food Revenue (USD Million) by Product (2021-2032)
By Type
Cereal
Yam
Beans
Others
By Distribution Channel
Hypermarkets/Supermarkets
Convenience Stores
Online
Others
Chapter 12. South America Fried Puffed Food Analysis and Outlook
12.1. South America Fried Puffed Food Revenue (USD Million), by Segments (2021-2032)
12.1.1. South America Fried Puffed Food Revenue (USD Million) by Type (2021-2032)
12.1.2. South America Fried Puffed Food Revenue (USD Million) by Application (2021-2032)
12.1.3. South America Fried Puffed Food Revenue (USD Million) by Product (2021-2032)
By Type
Cereal
Yam
Beans
Others
By Distribution Channel
Hypermarkets/Supermarkets
Convenience Stores
Online
Others
Chapter 13. Middle East and Africa Fried Puffed Food Analysis and Outlook
13.1. Middle East and Africa Fried Puffed Food Revenue (USD Million), by Segments (2021-2032)
13.1.1. Middle East and Africa Fried Puffed Food Revenue (USD Million) by Type (2021-2032)
13.1.2. Middle East and Africa Fried Puffed Food Revenue (USD Million) by Application (2021-2032)
13.1.3. Middle East and Africa Fried Puffed Food Revenue (USD Million) by Product (2021-2032)
By Type
Cereal
Yam
Beans
Others
By Distribution Channel
Hypermarkets/Supermarkets
Convenience Stores
Online
Others
Chapter 14. Fried Puffed Food Company Profiles
14.1 Business Overview
14.2 Product Profiles
14.3 SWOT Profiles
14.5 Recent Developments
14.6 Financial Profile
List of Companies
Frito-Lay
Good Grain
Kallo Foods
Kellogg Company
Nong Shim
Rude Health
The Kraft Heinz Company
Wise Foods
15. Methodology and Data Sources
15.1 Customization Offerings
15.2 Subscription Services
15.3 Related Reports
15.4 Publisher Expertise
LIST OF TABLES
Table 1 Market Segmentation Analysis
Table 2 Global Fried Puffed Food Market Share of Leading Companies, 2023
Table 3 Product Offerings of Leading Companies
Table 4 Low Growth Scenario Forecasts
Table 5 Reference Case Growth Scenario
Table 6 High Growth Case Scenario
Table 7 Global Fried Puffed Food Revenue (USD Million) And CAGR (%) By Type (2021-2032)
Table 8 Global Fried Puffed Food Revenue (USD Million) And CAGR (%) By Application (2021-2032)
Table 9 Global Fried Puffed Food Revenue (USD Million) And CAGR (%) By Product (2021-2032)
Table 10 Global Fried Puffed Food Market Revenue (USD Million) By Regions (2021-2032)
Table 11 Global Fried Puffed Food Market Share (%) By Regions (2021-2032)
Table 12 North America Fried Puffed Food Revenue (USD Million) By Country (2021-2032)
Table 13 Europe Fried Puffed Food Revenue (USD Million) By Country (2021-2032)
Table 14 Asia Pacific Fried Puffed Food Revenue (USD Million) By Country (2021-2032)
Table 15 South America Fried Puffed Food Revenue (USD Million) By Country (2021-2032)
Table 16 Middle East and Africa Fried Puffed Food Revenue (USD Million) By Region (2021-2032)
Table 17 North America Fried Puffed Food Revenue (USD Million) By Type (2021-2032)
Table 18 North America Fried Puffed Food Revenue (USD Million) By Application (2021-2032)
Table 19 North America Fried Puffed Food Revenue (USD Million) By Product (2021-2032)
Table 20 Europe Fried Puffed Food Revenue (USD Million) By Type (2021-2032)
Table 21 Europe Fried Puffed Food Revenue (USD Million) By Application (2021-2032)
Table 22 Europe Fried Puffed Food Revenue (USD Million) By Product (2021-2032)
Table 23 Asia Pacific Fried Puffed Food Revenue (USD Million) By Type (2021-2032)
Table 24 Asia Pacific Fried Puffed Food Revenue (USD Million) By Application (2021-2032)
Table 25 Asia Pacific Fried Puffed Food Revenue (USD Million) By Product (2021-2032)
Table 26 South America Fried Puffed Food Revenue (USD Million) By Type (2021-2032)
Table 27 South America Fried Puffed Food Revenue (USD Million) By Application (2021-2032)
Table 28 South America Fried Puffed Food Revenue (USD Million) By Product (2021-2032)
Table 29 Middle East and Africa Fried Puffed Food Revenue (USD Million) By Type (2021-2032)
Table 30 Middle East and Africa Fried Puffed Food Revenue (USD Million) By Application (2021-2032)
Table 31 Middle East and Africa Fried Puffed Food Revenue (USD Million) By Product (2021-2032)
LIST OF FIGURES
Figure 1. Market Scope
Figure 2. Pricing Forecasts Per Unit, 2023- 2032
Figure 3. Porter’s Five Forces
Figure 4. Global Fried Puffed Food Market Revenue (USD Million) By Regions (2021-2032)
Figure 5. Global Fried Puffed Food Market Share (%) By Regions (2023)
Figure 6. North America Fried Puffed Food Revenue (USD Million) By Country (2021-2032)
Figure 7. United States Fried Puffed Food Revenue (USD Million) By Country (2021-2032)
Figure 8. Canada Fried Puffed Food Revenue (USD Million) By Country (2021-2032)
Figure 9. Mexico Fried Puffed Food Revenue (USD Million) By Country (2021-2032)
Figure 10. Europe Fried Puffed Food Revenue (USD Million) By Country (2021-2032)
Figure 11. Germany Fried Puffed Food Revenue (USD Million) By Country (2021-2032)
Figure 12. France Fried Puffed Food Revenue (USD Million) By Country (2021-2032)
Figure 13. United Kingdom Fried Puffed Food Revenue (USD Million) By Country (2021-2032)
Figure 14. Spain Fried Puffed Food Revenue (USD Million) By Country (2021-2032)
Figure 15. Italy Fried Puffed Food Revenue (USD Million) By Country (2021-2032)
Figure 16. Russia Fried Puffed Food Revenue (USD Million) By Country (2021-2032)
Figure 17. Rest of Europe Fried Puffed Food Revenue (USD Million) By Country (2021-2032)
Figure 11. Asia Pacific Fried Puffed Food Revenue (USD Million) By Country (2021-2032)
Figure 12. China Fried Puffed Food Revenue (USD Million) By Country (2021-2032)
Figure 13. Japan Fried Puffed Food Revenue (USD Million) By Country (2021-2032)
Figure 14. India Fried Puffed Food Revenue (USD Million) By Country (2021-2032)
Figure 15. South Korea Fried Puffed Food Revenue (USD Million) By Country (2021-2032)
Figure 16. Australia Fried Puffed Food Revenue (USD Million) By Country (2021-2032)
Figure 17. South East Asia Fried Puffed Food Revenue (USD Million) By Country (2021-2032)
Figure 18. South America Fried Puffed Food Revenue (USD Million) By Country (2021-2032)
Figure 19. Brazil Fried Puffed Food Revenue (USD Million) By Country (2021-2032)
Figure 20. Argentina Fried Puffed Food Revenue (USD Million) By Country (2021-2032)
Figure 21. Rest of Asia Pacific Fried Puffed Food Revenue (USD Million) By Country (2021-2032)
Figure 22. Middle East and Africa Fried Puffed Food Revenue (USD Million) By Region (2021-2032)
Figure 23. Saudi Arabia Fried Puffed Food Revenue (USD Million) By Region (2021-2032)
Figure 24. The UAE Fried Puffed Food Revenue (USD Million) By Region (2021-2032)
Figure 25. Rest of Middle East Fried Puffed Food Revenue (USD Million) By Region (2021-2032)
Figure 26. South Africa Fried Puffed Food Revenue (USD Million) By Region (2021-2032)
Figure 27. Africa Fried Puffed Food Revenue (USD Million) By Region (2021-2032)
Figure 28. North America Fried Puffed Food Revenue (USD Million) By Type (2021-2032)
Figure 29. North America Fried Puffed Food Revenue (USD Million) By Application (2021-2032)
Figure 30. North America Fried Puffed Food Revenue (USD Million) By Product (2021-2032)
Figure 31. Europe Fried Puffed Food Revenue (USD Million) By Type (2021-2032)
Figure 32. Europe Fried Puffed Food Revenue (USD Million) By Application (2021-2032)
Figure 33. Europe Fried Puffed Food Revenue (USD Million) By Product (2021-2032)
Figure 34. Asia Pacific Fried Puffed Food Revenue (USD Million) By Type (2021-2032)
Figure 35. Asia Pacific Fried Puffed Food Revenue (USD Million) By Application (2021-2032)
Figure 36. Asia Pacific Fried Puffed Food Revenue (USD Million) By Product (2021-2032)
Figure 37. South America Fried Puffed Food Revenue (USD Million) By Type (2021-2032)
Figure 38. South America Fried Puffed Food Revenue (USD Million) By Application (2021-2032)
Figure 39. South America Fried Puffed Food Revenue (USD Million) By Product (2021-2032)
Figure 40. Middle East and Africa Fried Puffed Food Revenue (USD Million) By Type (2021-2032)
Figure 41. Middle East and Africa Fried Puffed Food Revenue (USD Million) By Application (2021-2032)
Figure 42. Middle East and Africa Fried Puffed Food Revenue (USD Million) By Product (2021-2032)
By Type
Cereal
Yam
Beans
Others
By Distribution Channel
Hypermarkets/Supermarkets
Convenience Stores
Online
Others
Countries Analyzed
North America (US, Canada, Mexico)
Europe (Germany, UK, France, Spain, Italy, Russia, Rest of Europe)
Asia Pacific (China, India, Japan, South Korea, Australia, South East Asia, Rest of Asia)
South America (Brazil, Argentina, Rest of South America)
Middle East and Africa (Saudi Arabia, UAE, Rest of Middle East, South Africa, Egypt, Rest of Africa)
