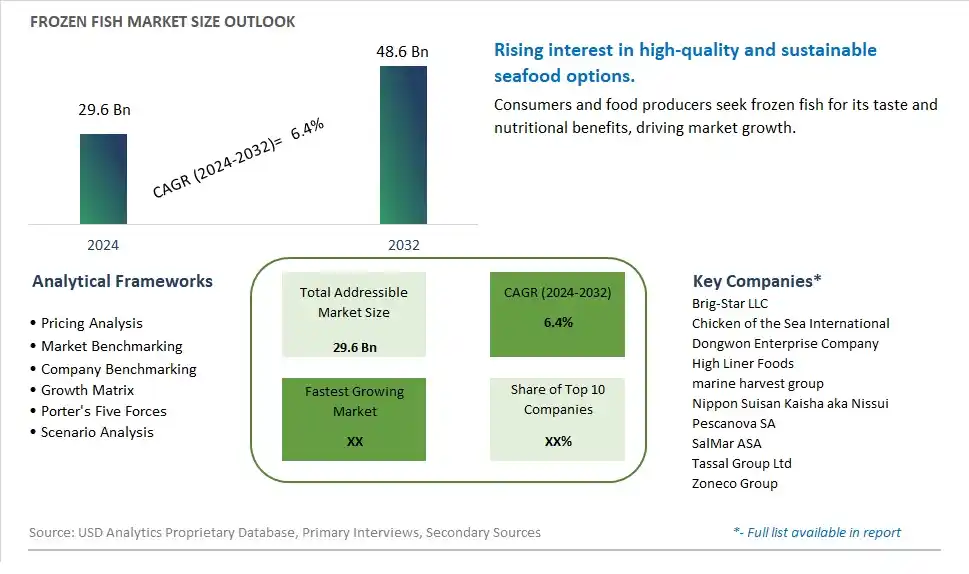
Global Frozen Fish Market Size is valued at $29.6 Billion in 2024 and is forecast to register a growth rate (CAGR) of 6.4% to reach $48.6 Billion by 2032.
The global Frozen Fish Market Comprehensive Study analyzes and forecasts the market size across 6 regions and 24 countries for diverse segments -By Type (Salmon, Tuna, Cod, Tilapia, Shrimp, Others), By Distribution Channel (Supermarkets/Hypermarkets, Convenience Stores, Specialty Stores, Online Retail, Others)
An Introduction to Frozen Fish Market
The Frozen Fish market in 2024 is experiencing significant growth, driven by the rising demand for convenient and high-quality seafood options. Frozen fish, available in various species and formats, is popular among health-conscious consumers and foodservice providers. The market benefits from advancements in freezing and packaging technologies, the growing trend of healthy eating, and the expansion of the global seafood sector. Additionally, the increasing focus on sustainability and traceability in the seafood supply chain is driving market growth.
Frozen Fish Competitive Landscape
The market report analyses the leading companies in the industry including Brig-Star LLC, Chicken of the Sea International, Dongwon Enterprise Company, High Liner Foods, marine harvest group, Nippon Suisan Kaisha aka Nissui, Pescanova SA, SalMar ASA, Tassal Group Ltd, Zoneco Group, and Others.
Frozen Fish Market Dynamics
Frozen Fish Market Trend: Increasing Demand for Convenient and Nutritious Seafood Options
The most prominent trend in the Frozen Fish Market is the increasing demand for convenient and nutritious seafood options. As consumers seek easy-to-prepare meal solutions that do not compromise on taste and quality, frozen fish is gaining popularity for its convenience and health benefits. This trend is driven by the busy lifestyles of modern consumers and the growing preference for seafood that offers high nutritional value and quick preparation times.
Frozen Fish Market Driver: Growth in Seafood Consumption
The key driver of the Frozen Fish Market is the growth in seafood consumption. As global populations increase and dietary guidelines emphasize the health benefits of seafood, there is a higher demand for frozen fish products. This driver is supported by the rising popularity of fish for its high protein content, omega-3 fatty acids, and versatility in various culinary applications, driving market growth for frozen fish.
Frozen Fish Market Opportunity: Development of Value-Added Frozen Fish Products
A significant opportunity in the Frozen Fish Market lies in the development of value-added frozen fish products. By creating innovative products, such as pre-seasoned, ready-to-cook fish fillets, and single-serve portions, companies can cater to the diverse needs of modern consumers. Offering convenient, flavorful, and health-oriented frozen fish options can help expand market reach and increase consumer satisfaction, driving growth in the seafood sector.
Frozen Fish Market Share Analysis: Shrimp segment generated the highest revenue share in the industry
Shrimp is the largest segment within the Frozen Fish Market by type. Its dominance is attributed to its high demand across various cuisines and its versatility in cooking methods, making it a staple in both home kitchens and restaurants worldwide. Shrimp is often preferred for its quick cooking time, rich flavor, and nutritional benefits, including being a good source of protein and omega-3 fatty acids. The growing trend towards healthy eating and the rising awareness of seafood's health benefits have further propelled the demand for frozen shrimp. Additionally, the expansion of the aquaculture industry has made shrimp more accessible and affordable, contributing to its large market share. The popularity of shrimp is also bolstered by its use in a variety of dishes, from appetizers and salads to main courses, making it a favorite among consumers and foodservice providers alike.
Frozen Fish Market Share Analysis: Online Retail is the fastest growing segment over the forecast period to 2032
The Online Retail segment is the fastest-growing within the Frozen Fish Market by distribution channel, projected to experience significant growth up to 2032. The surge in e-commerce platforms and the increasing adoption of online shopping by consumers are the primary drivers of this growth. The convenience of ordering frozen fish products online, coupled with the ability to access a wider variety of options compared to traditional brick-and-mortar stores, has made online retail a preferred choice for many. Advances in cold chain logistics and packaging technology have ensured that the quality and freshness of frozen fish are maintained during delivery, further boosting consumer confidence in online purchases. Additionally, the Past few yearshas accelerated the shift towards online shopping, as consumers seek to minimize physical store visits. Promotional offers, subscription services, and the availability of detailed product information and customer reviews have also contributed to the rising popularity of online retail for frozen fish products. This segment's rapid growth is expected to continue as digital shopping becomes increasingly ingrained in consumer behavior.
Frozen Fish Market Segmentation
By Type
Salmon
Tuna
Cod
Tilapia
Shrimp
Others
By Distribution Channel
Supermarkets/Hypermarkets
Convenience Stores
Specialty Stores
Online Retail
Others
Countries Analyzed
North America (US, Canada, Mexico)
Europe (Germany, UK, France, Spain, Italy, Russia, Rest of Europe)
Asia Pacific (China, India, Japan, South Korea, Australia, South East Asia, Rest of Asia)
South America (Brazil, Argentina, Rest of South America)
Middle East and Africa (Saudi Arabia, UAE, Rest of Middle East, South Africa, Egypt, Rest of Africa)
Frozen Fish Companies Profiled in the Study
Brig-Star LLC
Chicken of the Sea International
Dongwon Enterprise Company
High Liner Foods
marine harvest group
Nippon Suisan Kaisha aka Nissui
Pescanova SA
SalMar ASA
Tassal Group Ltd
Zoneco Group
*- List Not Exhaustive
Chapter 1. TABLE OF CONTENTS
Chapter 2. Introduction to Frozen Fish Market
2.1. Market Overview
2.2. Key Statistics and Report Highlights
2.3. Scope of the Comprehensive Study
2.3.1. Market Definition
2.3.2 Countries and Regions Covered
2.3.3 Research Objective
2.3.4 Units, Currency, and Conversions
2.3.5 Industry Value Chain
2.4. Key Market Segments
2.5. Key Companies
2.6. Study Period
Chapter 3. Strategic Analysis Review
3.1. Frozen Fish Pricing Analysis and Forecast
3.2. Porter’s Five Forces
3.3. Market Ecosystem
3.4. SWOT Analysis
3.5. Regulatory Scenario
3.3. Effects of Inflation, Russia-Ukraine War, moderating economic growth, and other macroeconomic factors
Chapter 4. Competitive Landscape
4.1. Market Share Analysis
4.1.1. Global Frozen Fish Market Share by Company, 2023
4.1.2. Product Offerings of Leading Frozen Fish Companies
4.2. Market Entropy
4.2.1. New Product Launches in the Industry
4.2.2. Mergers, Acquisitions, Joint ventures, and Partnerships
4.3. Key Strategies and Best Practices
Chapter 5. Global Market Projections: Best, Reference, and Low Case Scenarios
5.1. Growth Analysis- Case Scenario Definitions
5.2. Low Growth Case Scenario Forecasts
5.3. Reference Growth Case Scenario Forecasts
5.4. High Growth Case Scenario Forecasts
Chapter 6. Market Dynamics
6.1. Frozen Fish Market Drivers
6.2. Frozen Fish Market Challenges
6.6. Frozen Fish Market Opportunities
6.4. Frozen Fish Market Trends
Chapter 7. Global Frozen Fish Market Outlook Trends
7.1. Global Frozen Fish Revenue (USD Million) and CAGR (%) by Type (2021-2032)
7.2. Global Frozen Fish Revenue (USD Million) and CAGR (%) by Application (2021-2032)
7.3. Global Frozen Fish Revenue (USD Million) and CAGR (%) by Product (2021-2032)
By Type
Salmon
Tuna
Cod
Tilapia
Shrimp
Others
By Distribution Channel
Supermarkets/Hypermarkets
Convenience Stores
Specialty Stores
Online Retail
Others
Chapter 8. Global Frozen Fish Regional Analysis and Outlook
8.1. Global Frozen Fish Revenue (USD Million) By Regions (2021- 2032)
8.2. North America Frozen Fish Revenue (USD Million) by Country (2021-2032)
8.2.1. United States Frozen Fish Regional Analysis and Outlook
8.2.2. Canada Frozen Fish Regional Analysis and Outlook
8.2.3. Mexico Frozen Fish Regional Analysis and Outlook
8.3. Europe Frozen Fish Revenue (USD Million), by Country (2021-2032)
8.3.1. Germany Frozen Fish Regional Analysis and Outlook
8.3.2. France Frozen Fish Regional Analysis and Outlook
8.3.3. United Kingdom Frozen Fish Regional Analysis and Outlook
8.3.4. Spain Frozen Fish Regional Analysis and Outlook
8.3.5. Italy Frozen Fish Regional Analysis and Outlook
8.3.6. Russia Frozen Fish Regional Analysis and Outlook
8.3.7. Rest of Europe Frozen Fish Regional Analysis and Outlook
8.4. Asia Pacific Frozen Fish Revenue (USD Million) by Country (2021-2032)
8.4.1. China Frozen Fish Regional Analysis and Outlook
8.4.2. Japan Frozen Fish Regional Analysis and Outlook
8.4.3. India Frozen Fish Regional Analysis and Outlook
8.4.4. South Korea Frozen Fish Regional Analysis and Outlook
8.4.5. Australia Frozen Fish Regional Analysis and Outlook
8.4.6. South East Asia Frozen Fish Regional Analysis and Outlook
8.4.7. Rest of Asia Pacific Frozen Fish Regional Analysis and Outlook
8.5. South America Frozen Fish Revenue (USD Million), by Country (2021-2032)
8.5.1. Brazil Frozen Fish Regional Analysis and Outlook
8.5.2. Argentina Frozen Fish Regional Analysis and Outlook
8.5.3. Rest of South America Frozen Fish Regional Analysis and Outlook
8.6. Middle East and Africa Frozen Fish Revenue (USD Million) by Country (2021-2032)
8.6.1. Middle East Frozen Fish Regional Analysis and Outlook
8.6.2. Africa Frozen Fish Regional Analysis and Outlook
Chapter 9. North America Frozen Fish Analysis and Outlook
9.1. North America Frozen Fish Revenue (USD Million) by Segments (2021-2032)
9.1.1. North America Frozen Fish Revenue (USD Million) by Type (2021-2032)
9.1.2. North America Frozen Fish Revenue (USD Million) by Application (2021-2032)
9.1.3. North America Frozen Fish Revenue (USD Million) by Product (2021-2032)
By Type
Salmon
Tuna
Cod
Tilapia
Shrimp
Others
By Distribution Channel
Supermarkets/Hypermarkets
Convenience Stores
Specialty Stores
Online Retail
Others
Chapter 10. Europe Frozen Fish Analysis and Outlook
10.1. Europe Frozen Fish Revenue (USD Million), by Segments (USD Million) (2021-2032)
10.1.1. Europe Frozen Fish Revenue (USD Million) by Type (2021-2032)
10.1.2. Europe Frozen Fish Revenue (USD Million) by Application (2021-2032)
10.1.3. Europe Frozen Fish Revenue (USD Million) by Product (2021-2032)
By Type
Salmon
Tuna
Cod
Tilapia
Shrimp
Others
By Distribution Channel
Supermarkets/Hypermarkets
Convenience Stores
Specialty Stores
Online Retail
Others
Chapter 11. Asia Pacific Frozen Fish Analysis and Outlook
11.1. Asia Pacific Frozen Fish Revenue (USD Million), and Revenue (USD Million) by Segments (2021-2032)
11.1.1. Asia Pacific Frozen Fish Revenue (USD Million) by Type (2021-2032)
11.1.2. Asia Pacific Frozen Fish Revenue (USD Million) by Application (2021-2032)
11.1.3. Asia Pacific Frozen Fish Revenue (USD Million) by Product (2021-2032)
By Type
Salmon
Tuna
Cod
Tilapia
Shrimp
Others
By Distribution Channel
Supermarkets/Hypermarkets
Convenience Stores
Specialty Stores
Online Retail
Others
Chapter 12. South America Frozen Fish Analysis and Outlook
12.1. South America Frozen Fish Revenue (USD Million), by Segments (2021-2032)
12.1.1. South America Frozen Fish Revenue (USD Million) by Type (2021-2032)
12.1.2. South America Frozen Fish Revenue (USD Million) by Application (2021-2032)
12.1.3. South America Frozen Fish Revenue (USD Million) by Product (2021-2032)
By Type
Salmon
Tuna
Cod
Tilapia
Shrimp
Others
By Distribution Channel
Supermarkets/Hypermarkets
Convenience Stores
Specialty Stores
Online Retail
Others
Chapter 13. Middle East and Africa Frozen Fish Analysis and Outlook
13.1. Middle East and Africa Frozen Fish Revenue (USD Million), by Segments (2021-2032)
13.1.1. Middle East and Africa Frozen Fish Revenue (USD Million) by Type (2021-2032)
13.1.2. Middle East and Africa Frozen Fish Revenue (USD Million) by Application (2021-2032)
13.1.3. Middle East and Africa Frozen Fish Revenue (USD Million) by Product (2021-2032)
By Type
Salmon
Tuna
Cod
Tilapia
Shrimp
Others
By Distribution Channel
Supermarkets/Hypermarkets
Convenience Stores
Specialty Stores
Online Retail
Others
Chapter 14. Frozen Fish Company Profiles
14.1 Business Overview
14.2 Product Profiles
14.3 SWOT Profiles
14.5 Recent Developments
14.6 Financial Profile
List of Companies
Brig-Star LLC
Chicken of the Sea International
Dongwon Enterprise Company
High Liner Foods
marine harvest group
Nippon Suisan Kaisha aka Nissui
Pescanova SA
SalMar ASA
Tassal Group Ltd
Zoneco Group
15. Methodology and Data Sources
15.1 Customization Offerings
15.2 Subscription Services
15.3 Related Reports
15.4 Publisher Expertise
LIST OF TABLES
Table 1 Market Segmentation Analysis
Table 2 Global Frozen Fish Market Share of Leading Companies, 2023
Table 3 Product Offerings of Leading Companies
Table 4 Low Growth Scenario Forecasts
Table 5 Reference Case Growth Scenario
Table 6 High Growth Case Scenario
Table 7 Global Frozen Fish Revenue (USD Million) And CAGR (%) By Type (2021-2032)
Table 8 Global Frozen Fish Revenue (USD Million) And CAGR (%) By Application (2021-2032)
Table 9 Global Frozen Fish Revenue (USD Million) And CAGR (%) By Product (2021-2032)
Table 10 Global Frozen Fish Market Revenue (USD Million) By Regions (2021-2032)
Table 11 Global Frozen Fish Market Share (%) By Regions (2021-2032)
Table 12 North America Frozen Fish Revenue (USD Million) By Country (2021-2032)
Table 13 Europe Frozen Fish Revenue (USD Million) By Country (2021-2032)
Table 14 Asia Pacific Frozen Fish Revenue (USD Million) By Country (2021-2032)
Table 15 South America Frozen Fish Revenue (USD Million) By Country (2021-2032)
Table 16 Middle East and Africa Frozen Fish Revenue (USD Million) By Region (2021-2032)
Table 17 North America Frozen Fish Revenue (USD Million) By Type (2021-2032)
Table 18 North America Frozen Fish Revenue (USD Million) By Application (2021-2032)
Table 19 North America Frozen Fish Revenue (USD Million) By Product (2021-2032)
Table 20 Europe Frozen Fish Revenue (USD Million) By Type (2021-2032)
Table 21 Europe Frozen Fish Revenue (USD Million) By Application (2021-2032)
Table 22 Europe Frozen Fish Revenue (USD Million) By Product (2021-2032)
Table 23 Asia Pacific Frozen Fish Revenue (USD Million) By Type (2021-2032)
Table 24 Asia Pacific Frozen Fish Revenue (USD Million) By Application (2021-2032)
Table 25 Asia Pacific Frozen Fish Revenue (USD Million) By Product (2021-2032)
Table 26 South America Frozen Fish Revenue (USD Million) By Type (2021-2032)
Table 27 South America Frozen Fish Revenue (USD Million) By Application (2021-2032)
Table 28 South America Frozen Fish Revenue (USD Million) By Product (2021-2032)
Table 29 Middle East and Africa Frozen Fish Revenue (USD Million) By Type (2021-2032)
Table 30 Middle East and Africa Frozen Fish Revenue (USD Million) By Application (2021-2032)
Table 31 Middle East and Africa Frozen Fish Revenue (USD Million) By Product (2021-2032)
LIST OF FIGURES
Figure 1. Market Scope
Figure 2. Pricing Forecasts Per Unit, 2023- 2032
Figure 3. Porter’s Five Forces
Figure 4. Global Frozen Fish Market Revenue (USD Million) By Regions (2021-2032)
Figure 5. Global Frozen Fish Market Share (%) By Regions (2023)
Figure 6. North America Frozen Fish Revenue (USD Million) By Country (2021-2032)
Figure 7. United States Frozen Fish Revenue (USD Million) By Country (2021-2032)
Figure 8. Canada Frozen Fish Revenue (USD Million) By Country (2021-2032)
Figure 9. Mexico Frozen Fish Revenue (USD Million) By Country (2021-2032)
Figure 10. Europe Frozen Fish Revenue (USD Million) By Country (2021-2032)
Figure 11. Germany Frozen Fish Revenue (USD Million) By Country (2021-2032)
Figure 12. France Frozen Fish Revenue (USD Million) By Country (2021-2032)
Figure 13. United Kingdom Frozen Fish Revenue (USD Million) By Country (2021-2032)
Figure 14. Spain Frozen Fish Revenue (USD Million) By Country (2021-2032)
Figure 15. Italy Frozen Fish Revenue (USD Million) By Country (2021-2032)
Figure 16. Russia Frozen Fish Revenue (USD Million) By Country (2021-2032)
Figure 17. Rest of Europe Frozen Fish Revenue (USD Million) By Country (2021-2032)
Figure 11. Asia Pacific Frozen Fish Revenue (USD Million) By Country (2021-2032)
Figure 12. China Frozen Fish Revenue (USD Million) By Country (2021-2032)
Figure 13. Japan Frozen Fish Revenue (USD Million) By Country (2021-2032)
Figure 14. India Frozen Fish Revenue (USD Million) By Country (2021-2032)
Figure 15. South Korea Frozen Fish Revenue (USD Million) By Country (2021-2032)
Figure 16. Australia Frozen Fish Revenue (USD Million) By Country (2021-2032)
Figure 17. South East Asia Frozen Fish Revenue (USD Million) By Country (2021-2032)
Figure 18. South America Frozen Fish Revenue (USD Million) By Country (2021-2032)
Figure 19. Brazil Frozen Fish Revenue (USD Million) By Country (2021-2032)
Figure 20. Argentina Frozen Fish Revenue (USD Million) By Country (2021-2032)
Figure 21. Rest of Asia Pacific Frozen Fish Revenue (USD Million) By Country (2021-2032)
Figure 22. Middle East and Africa Frozen Fish Revenue (USD Million) By Region (2021-2032)
Figure 23. Saudi Arabia Frozen Fish Revenue (USD Million) By Region (2021-2032)
Figure 24. The UAE Frozen Fish Revenue (USD Million) By Region (2021-2032)
Figure 25. Rest of Middle East Frozen Fish Revenue (USD Million) By Region (2021-2032)
Figure 26. South Africa Frozen Fish Revenue (USD Million) By Region (2021-2032)
Figure 27. Africa Frozen Fish Revenue (USD Million) By Region (2021-2032)
Figure 28. North America Frozen Fish Revenue (USD Million) By Type (2021-2032)
Figure 29. North America Frozen Fish Revenue (USD Million) By Application (2021-2032)
Figure 30. North America Frozen Fish Revenue (USD Million) By Product (2021-2032)
Figure 31. Europe Frozen Fish Revenue (USD Million) By Type (2021-2032)
Figure 32. Europe Frozen Fish Revenue (USD Million) By Application (2021-2032)
Figure 33. Europe Frozen Fish Revenue (USD Million) By Product (2021-2032)
Figure 34. Asia Pacific Frozen Fish Revenue (USD Million) By Type (2021-2032)
Figure 35. Asia Pacific Frozen Fish Revenue (USD Million) By Application (2021-2032)
Figure 36. Asia Pacific Frozen Fish Revenue (USD Million) By Product (2021-2032)
Figure 37. South America Frozen Fish Revenue (USD Million) By Type (2021-2032)
Figure 38. South America Frozen Fish Revenue (USD Million) By Application (2021-2032)
Figure 39. South America Frozen Fish Revenue (USD Million) By Product (2021-2032)
Figure 40. Middle East and Africa Frozen Fish Revenue (USD Million) By Type (2021-2032)
Figure 41. Middle East and Africa Frozen Fish Revenue (USD Million) By Application (2021-2032)
Figure 42. Middle East and Africa Frozen Fish Revenue (USD Million) By Product (2021-2032)
By Type
Salmon
Tuna
Cod
Tilapia
Shrimp
Others
By Distribution Channel
Supermarkets/Hypermarkets
Convenience Stores
Specialty Stores
Online Retail
Others
Countries Analyzed
North America (US, Canada, Mexico)
Europe (Germany, UK, France, Spain, Italy, Russia, Rest of Europe)
Asia Pacific (China, India, Japan, South Korea, Australia, South East Asia, Rest of Asia)
South America (Brazil, Argentina, Rest of South America)
Middle East and Africa (Saudi Arabia, UAE, Rest of Middle East, South Africa, Egypt, Rest of Africa)
