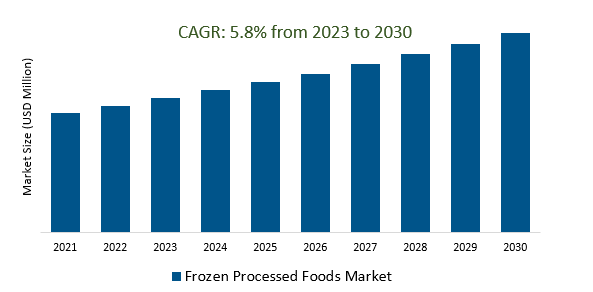
The Frozen Processed Foods Market Size is estimated to register 5.8% growth over the forecast period from 2023 to 2030.
Processed Foods Market Overview
Changing consumer lifestyles and preferences, particularly the rising demand for convenience and time-saving food options are fueling the market. Improved freezing techniques, maintaining the quality, taste, and nutritional value of frozen processed foods, reducing the risk of spoilage and ensuring product integrity are propelling the demand. The rise in plant-based diets and the popularity of alternative proteins are leading to an increasing number of frozen processed food options catering to vegetarian, vegan, or flexitarian consumers. Additionally, Innovative packaging designs, ensuring better preservation and ease of storage and enhancing consumer convenience are fueling the demand. Products featuring plant-based proteins, such as tofu, tempeh, and legume-based options are witnessing heightened demand. Convenient meal solutions, including single-serve frozen entrees, meal kits, and quick-prep frozen dishes are increasing the market growth.
Frozen Processed Foods Market Dynamics
Market Trends- Innovative convenience drives Frozen Processed Foods Market catering to modern lifestyles.
Evolving consumer lifestyles, characterized by busier schedules and a preference for convenience are driving the demand for quick and easy meal options.
Manufacturers are introducing a diverse array of frozen products, including single-serve meals, meal kits, and ready-to-cook options that cater to these preferences.
Further, Brands are increasingly focusing on creating quick-to-prepare frozen food options such as single-serve meals, pre-cut ingredients, and ready-to-cook selections to meet the demands of busy consumers seeking convenient meal solutions.
Market Driver- The Frozen Processed Foods Market prioritizes health and wellness concerns, driving companies to innovate for healthier product options.
Consumer demand for healthier options are propelling companies to reevaluate and reformulate their product offerings.
Businesses are investing in sourcing high-quality ingredients, adopting cleaner food labeling practices, and innovating packaging to align with health-conscious consumer preferences.
Additionally, extensive research and development efforts to create frozen processed foods with reduced additives, lower sodium content, natural ingredients, and enhanced nutritional profiles are driving the market.
Market Opportunity- E-commerce and Direct-to-Consumer (D2C) Sales are reshaping the Frozen Processed Foods Market, revolutionizing consumer purchasing patterns.
Online purchasing, especially through E-commerce platforms and D2C sales channels, are accelerated significantly, driving the market growth.
Companies are optimizing their online presence, enhancing digital marketing strategies, and improving logistics and delivery services to meet the increasing demand for frozen processed foods through online channels.
The growing digitalization of retail, where companies capitalize on E-commerce platforms and establish their D2C sales channels, allowing brands to bypass traditional retail distribution, directly engaging with consumers are propelling the market.
Market Share Analysis- Breakfast Cereals will register the fastest growth
The Frozen Processed Foods Market is analyzed across Breakfast Cereals, Cheese, Tinned Vegetables, Bread and Others. Breakfast Cereals is poised to register the fastest growth. These frozen cereals cater to busy lifestyles, providing an easy-to-prepare breakfast choice that eliminates the need for extensive cooking or preparation. Frozen breakfast cereals are available in various forms, including individually portioned servings or bulk packages, offering versatility in portion sizes to accommodate diverse consumer preferences. They are often fortified with vitamins, minerals, and fiber, catering to health-conscious consumers seeking nutritious options. Additionally, the market for frozen breakfast cereals continues to witness innovation, with manufacturers introducing a wide range of flavours, including classic options and those tailored to specific dietary needs or preferences such as gluten-free, whole grain, or low-sugar variants. Furthermore, the frozen breakfast cereal segment is experiencing growth due to evolving consumer habits, increased awareness of healthier breakfast choices, and a desire for convenient meal solutions.
Market Share Analysis- Zipper Pouch held a significant market share in 2023
The Frozen Processed Foods Market is analyzed across various packaging type including SMEs, Large Enterprises, and others. Of these, Zipper Pouch held a significant market share in 2023. These pouches offer practicality and convenience, especially in preserving the quality and freshness of frozen products. The resealable feature of the Zipper Pouch allows consumers to conveniently open, access, and seal the packaging after use, ensuring better preservation and preventing freezer burn. This functionality significantly extends the shelf life of frozen processed foods, maintaining their taste, texture, and nutritional value over time. Moreover, Zipper Pouches are designed to provide ease of handling and storage. Their user-friendly nature allows for portion control, enabling consumers to use only the desired amount and seal the pouch to retain the remaining contents for later use. Additionally, manufacturers are leveraging the Zipper Pouch packaging to showcase product visibility, enhancing the appeal of frozen processed foods on store shelves.
Frozen Processed Foods Market News
Impossible Foods, known for its plant-based meat substitutes, introduces an innovative line of frozen meals to its product range.
Fast-Growing Frozen Food Label Real Good Foods launches New Stuffed Chicken Bites Range across Kroger Stores Nationwide.
Frozen Processed Foods Market Segmentation
By Type
- Breakfast Cereals
- Cheese
- Tinned Vegetables
- Bread
- Others
By Application
- Household
- Restaurant
- Catering
- Others
By Distribution Channel
- Online
- Convenient Stores
- Supermarkets
- Hypermarkets
- Others
By Packaging Type
- Packet
- Polly Pack
- Zipper Pouch
- Others
By Region
- North America (United States, Canada, Mexico)
- Europe (Germany, France, United Kingdom, Spain, Italy, Others)
- Asia Pacific (China, India, Japan, South Korea, Australia, Others)
- Latin America (Brazil, Argentina, Others)
- Middle East and Africa (Saudi Arabia, UAE, Kuwait, Other Middle East, South Africa, Nigeria, Other Africa)
Frozen Processed Foods Market Companies
- Amy's Kitchen (United States)
- Birds Eye (Australia)
- Hot Pockets (United States)
- Lean Cuisine (United States)
- Healthy Choice (United States)
- STOUFFER'S (United States)
- Banquet Foods (United States)
- Marie Callender's (United States)
- Green Giant (United States)
- McCain (Canada)
*List not exhaustive
Frozen Processed Foods Market Outlook 2023
1 Market Overview
1.1 Introduction to the Frozen Processed Foods Market
1.2 Scope of the Study
1.3 Research Objective
1.3.1 Key Market Scope and Segments
1.3.2 Players Covered
1.3.3 Years Considered
2 Executive Summary
2.1 2023 Frozen Processed Foods Industry- Market Statistics
3 Market Dynamics
3.1 Market Drivers
3.2 Market Challenges
3.3 Market Opportunities
3.4 Market Trends
4 Market Factor Analysis
4.1 Porter’s Five Forces
4.2 Market Entropy
4.2.1 Global Frozen Processed Foods Market Companies with Area Served
4.2.2 Products Offerings Global Frozen Processed Foods Market
5 COVID-19 Impact Analysis and Outlook Scenarios
5.1.1 Covid-19 Impact Analysis
5.1.2 Post-COVID-19 Scenario- Low Growth Case
5.1.3 Post-COVID-19 Scenario- Reference Growth Case
5.1.4 Post-COVID-19 Scenario- Low Growth Case
6 Global Frozen Processed Foods Market Trends
6.1 Global Frozen Processed Foods Revenue (USD Million) and CAGR (%) by Type (2018-2030)
6.2 Global Frozen Processed Foods Revenue (USD Million) and CAGR (%) by Applications (2018-2030)
6.3 Global Frozen Processed Foods Revenue (USD Million) and CAGR (%) by Regions (2018-2030)
7 Global Frozen Processed Foods Market Revenue (USD Million) by Type, and Applications (2018-2022)
7.1 Global Frozen Processed Foods Revenue (USD Million) by Type (2018-2022)
7.1.1 Global Frozen Processed Foods Revenue (USD Million), Market Share (%) by Type (2018-2022)
7.2 Global Frozen Processed Foods Revenue (USD Million) by Applications (2018-2022)
7.2.1 Global Frozen Processed Foods Revenue (USD Million), Market Share (%) by Applications (2018-2022)
8 Global Frozen Processed Foods Development Regional Status and Outlook
8.1 Global Frozen Processed Foods Revenue (USD Million) By Regions (2018-2022)
8.2 North America Frozen Processed Foods Revenue (USD Million) by Type, and Application (2018-2022)
8.2.1 North America Frozen Processed Foods Revenue (USD Million) by Country (2018-2022)
8.2.2 North America Frozen Processed Foods Revenue (USD Million) by Type (2018-2022)
8.2.3 North America Frozen Processed Foods Revenue (USD Million) by Applications (2018-2022)
8.3 Europe Frozen Processed Foods Revenue (USD Million), by Type, and Applications (USD Million) (2018-2022)
8.3.1 Europe Frozen Processed Foods Revenue (USD Million), by Country (2018-2022)
8.3.2 Europe Frozen Processed Foods Revenue (USD Million) by Type (2018-2022)
8.3.3 Europe Frozen Processed Foods Revenue (USD Million) by Applications (2018-2022)
8.4 Asia Pacific Frozen Processed Foods Revenue (USD Million), and Revenue (USD Million) by Type, and Applications (2018-2022)
8.4.1 Asia Pacific Frozen Processed Foods Revenue (USD Million) by Country (2018-2022)
8.4.2 Asia Pacific Frozen Processed Foods Revenue (USD Million) by Type (2018-2022)
8.4.3 Asia Pacific Frozen Processed Foods Revenue (USD Million) by Applications (2018-2022)
8.5 South America Frozen Processed Foods Revenue (USD Million), by Type, and Applications (2018-2022)
8.5.1 South America Frozen Processed Foods Revenue (USD Million), by Country (2018-2022)
8.5.2 South America Frozen Processed Foods Revenue (USD Million) by Type (2018-2022)
8.5.3 South America Frozen Processed Foods Revenue (USD Million) by Applications (2018-2022)
8.6 Middle East and Africa Frozen Processed Foods Revenue (USD Million), by Type, Technology, Application, Thickness (2018-2022)
8.6.1 Middle East and Africa Frozen Processed Foods Revenue (USD Million) by Country (2018-2022)
8.6.2 Middle East and Africa Frozen Processed Foods Revenue (USD Million) by Type (2018-2022)
8.6.3 Middle East and Africa Frozen Processed Foods Revenue (USD Million) by Applications (2018-2022)
9 Company Profiles
10 Global Frozen Processed Foods Market Revenue (USD Million), by Type, and Applications (2023-2030)
10.1 Global Frozen Processed Foods Revenue (USD Million) and Market Share (%) by Type (2023-2030)
10.1.1 Global Frozen Processed Foods Revenue (USD Million), and Market Share (%) by Type (2023-2030)
10.2 Global Frozen Processed Foods Revenue (USD Million) and Market Share (%) by Applications (2023-2030)
10.2.1 Global Frozen Processed Foods Revenue (USD Million), and Market Share (%) by Applications (2023-2030)
11 Global Frozen Processed Foods Development Regional Status and Outlook Forecast
11.1 Global Frozen Processed Foods Revenue (USD Million) By Regions (2023-2030)
11.2 North America Frozen Processed Foods Revenue (USD Million) by Type, and Applications (2023-2030)
11.2.1 North America Frozen Processed Foods Revenue (USD) Million by Country (2023-2030)
11.2.2 North America Frozen Processed Foods Revenue (USD Million), by Type (2023-2030)
11.2.3 North America Frozen Processed Foods Revenue (USD Million), Market Share (%) by Applications (2023-2030)
11.3 Europe Frozen Processed Foods Revenue (USD Million), by Type, and Applications (2023-2030)
11.3.1 Europe Frozen Processed Foods Revenue (USD Million), by Country (2023-2030)
11.3.2 Europe Frozen Processed Foods Revenue (USD Million), by Type (2023-2030)
11.3.3 Europe Frozen Processed Foods Revenue (USD Million), by Applications (2023-2030)
11.4 Asia Pacific Frozen Processed Foods Revenue (USD Million) by Type, and Applications (2023-2030)
11.4.1 Asia Pacific Frozen Processed Foods Revenue (USD Million), by Country (2023-2030)
11.4.2 Asia Pacific Frozen Processed Foods Revenue (USD Million), by Type (2023-2030)
11.4.3 Asia Pacific Frozen Processed Foods Revenue (USD Million), by Applications (2023-2030)
11.5 South America Frozen Processed Foods Revenue (USD Million), by Type, and Applications (2023-2030)
11.5.1 South America Frozen Processed Foods Revenue (USD Million), by Country (2023-2030)
11.5.2 South America Frozen Processed Foods Revenue (USD Million), by Type (2023-2030)
11.5.3 South America Frozen Processed Foods Revenue (USD Million), by Applications (2023-2030)
11.6 Middle East and Africa Frozen Processed Foods Revenue (USD Million), by Type, and Applications (2023-2030)
11.6.1 Middle East and Africa Frozen Processed Foods Revenue (USD Million), by Region (2023-2030)
11.6.2 Middle East and Africa Frozen Processed Foods Revenue (USD Million), by Type (2023-2030)
11.6.3 Middle East and Africa Frozen Processed Foods Revenue (USD Million), by Applications (2023-2030)
12 Methodology and Data Sources
12.1 Methodology/Research Approach
12.1.1 Research Programs/Design
12.1.2 Market Size Estimation
12.1.3 Market Breakdown and Data Triangulation
12.2 Data Sources
12.2.1 Secondary Sources
12.2.2 Primary Sources
12.3 Disclaimer
List of Tables
Table 1 Market Segmentation Analysis
Table 2 Global Frozen Processed Foods Market Companies with Areas Served
Table 3 Products Offerings Global Frozen Processed Foods Market
Table 4 Low Growth Scenario Forecasts
Table 5 Reference Case Growth Scenario
Table 6 High Growth Case Scenario
Table 7 Global Frozen Processed Foods Revenue (USD Million) And CAGR (%) By Type (2018-2030)
Table 8 Global Frozen Processed Foods Revenue (USD Million) And CAGR (%) By Applications (2018-2030)
Table 9 Global Frozen Processed Foods Revenue (USD Million) And CAGR (%) By Regions (2018-2030)
Table 10 Global Frozen Processed Foods Revenue (USD Million) By Type (2018-2022)
Table 11 Global Frozen Processed Foods Revenue Market Share (%) By Type (2018-2022)
Table 12 Global Frozen Processed Foods Revenue (USD Million) By Applications (2018-2022)
Table 13 Global Frozen Processed Foods Revenue Market Share (%) By Applications (2018-2022)
Table 14 Global Frozen Processed Foods Market Revenue (USD Million) By Regions (2018-2022)
Table 15 Global Frozen Processed Foods Market Share (%) By Regions (2018-2022)
Table 16 North America Frozen Processed Foods Revenue (USD Million) By Country (2018-2022)
Table 17 North America Frozen Processed Foods Revenue (USD Million) By Type (2018-2022)
Table 18 North America Frozen Processed Foods Revenue (USD Million) By Applications (2018-2022)
Table 19 Europe Frozen Processed Foods Revenue (USD Million) By Country (2018-2022)
Table 20 Europe Frozen Processed Foods Revenue (USD Million) By Type (2018-2022)
Table 21 Europe Frozen Processed Foods Revenue (USD Million) By Applications (2018-2022)
Table 22 Asia Pacific Frozen Processed Foods Revenue (USD Million) By Country (2018-2022)
Table 23 Asia Pacific Frozen Processed Foods Revenue (USD Million) By Type (2018-2022)
Table 24 Asia Pacific Frozen Processed Foods Revenue (USD Million) By Applications (2018-2022)
Table 25 South America Frozen Processed Foods Revenue (USD Million) By Country (2018-2022)
Table 26 South America Frozen Processed Foods Revenue (USD Million) By Type (2018-2022)
Table 27 South America Frozen Processed Foods Revenue (USD Million) By Applications (2018-2022)
Table 28 Middle East and Africa Frozen Processed Foods Revenue (USD Million) By Region (2018-2022)
Table 29 Middle East and Africa Frozen Processed Foods Revenue (USD Million) By Type (2018-2022)
Table 30 Middle East and Africa Frozen Processed Foods Revenue (USD Million) By Applications (2018-2022)
Table 31 Financial Analysis
Table 32 Global Frozen Processed Foods Revenue (USD Million) By Type (2023-2030)
Table 33 Global Frozen Processed Foods Revenue Market Share (%) By Type (2023-2030)
Table 34 Global Frozen Processed Foods Revenue (USD Million) By Applications (2023-2030)
Table 35 Global Frozen Processed Foods Revenue Market Share (%) By Applications (2023-2030)
Table 36 Global Frozen Processed Foods Market Revenue (USD Million), And Revenue (USD Million) By Regions (2023-2030)
Table 37 North America Frozen Processed Foods Revenue (USD)By Country (2023-2030)
Table 38 North America Frozen Processed Foods Revenue (USD Million) By Type (2023-2030)
Table 39 North America Frozen Processed Foods Revenue (USD Million) By Applications (2023-2030)
Table 40 Europe Frozen Processed Foods Revenue (USD Million) By Country (2023-2030)
Table 41 Europe Frozen Processed Foods Revenue (USD Million) By Type (2023-2030)
Table 42 Europe Frozen Processed Foods Revenue (USD Million) By Applications (2023-2030)
Table 43 Asia Pacific Frozen Processed Foods Revenue (USD Million) By Country (2023-2030)
Table 44 Asia Pacific Frozen Processed Foods Revenue (USD Million) By Type (2023-2030)
Table 45 Asia Pacific Frozen Processed Foods Revenue (USD Million) By Applications (2023-2030)
Table 46 South America Frozen Processed Foods Revenue (USD Million) By Country (2023-2030)
Table 47 South America Frozen Processed Foods Revenue (USD Million) By Type (2023-2030)
Table 48 South America Frozen Processed Foods Revenue (USD Million) By Applications (2023-2030)
Table 49 Middle East and Africa Frozen Processed Foods Revenue (USD Million) By Region (2023-2030)
Table 50 Middle East and Africa Frozen Processed Foods Revenue (USD Million) By Region (2023-2030)
Table 51 Middle East and Africa Frozen Processed Foods Revenue (USD Million) By Type (2023-2030)
Table 52 Middle East and Africa Frozen Processed Foods Revenue (USD Million) By Applications (2023-2030)
Table 53 Research Programs/Design for This Report
Table 54 Key Data Information from Secondary Sources
Table 55 Key Data Information from Primary Sources
List of Figures
Figure 1 Market Scope
Figure 2 Porter’s Five Forces
Figure 3 Global Frozen Processed Foods Revenue (USD Million) By Type (2018-2022)
Figure 4 Global Frozen Processed Foods Revenue Market Share (%) By Type (2022)
Figure 5 Global Frozen Processed Foods Revenue (USD Million) By Applications (2018-2022)
Figure 6 Global Frozen Processed Foods Revenue Market Share (%) By Applications (2022)
Figure 7 Global Frozen Processed Foods Market Revenue (USD Million) By Regions (2018-2022)
Figure 8 Global Frozen Processed Foods Market Share (%) By Regions (2022)
Figure 9 North America Frozen Processed Foods Revenue (USD Million) By Country (2018-2022)
Figure 10 North America Frozen Processed Foods Revenue (USD Million) By Type (2018-2022)
Figure 11 North America Frozen Processed Foods Revenue (USD Million) By Applications (2018-2022)
Figure 12 Europe Frozen Processed Foods Revenue (USD Million) By Country (2018-2022)
Figure 13 Europe Frozen Processed Foods Revenue (USD Million) By Type (2018-2022)
Figure 14 Europe Frozen Processed Foods Revenue (USD Million) By Applications (2018-2022)
Figure 15 Asia Pacific Frozen Processed Foods Revenue (USD Million) By Country (2018-2022)
Figure 16 Asia Pacific Frozen Processed Foods Revenue (USD Million) By Type (2018-2022)
Figure 17 Asia Pacific Frozen Processed Foods Revenue (USD Million) By Applications (2018-2022)
Figure 18 South America Frozen Processed Foods Revenue (USD Million) By Country (2018-2022)
Figure 19 South America Frozen Processed Foods Revenue (USD Million) By Type (2018-2022)
Figure 20 South America Frozen Processed Foods Revenue (USD Million) By Applications (2018-2022)
Figure 21 Middle East and Africa Frozen Processed Foods Revenue (USD Million) By Region (2018-2022)
Figure 22 Middle East and Africa Frozen Processed Foods Revenue (USD Million) By Type (2018-2022)
Figure 23 Middle East and Africa Frozen Processed Foods Revenue (USD Million) By Applications (2018-2022)
Figure 24 Global Frozen Processed Foods Revenue (USD Million) By Type (2023-2030)
Figure 25 Global Frozen Processed Foods Revenue Market Share (%) By Type (2030)
Figure 26 Global Frozen Processed Foods Revenue (USD Million) By Applications (2023-2030)
Figure 27 Global Frozen Processed Foods Revenue Market Share (%) By Applications (2030)
Figure 28 Global Frozen Processed Foods Market Revenue (USD Million) By Regions (2023-2030)
Figure 29 North America Frozen Processed Foods Revenue (USD Million) By Country (2023-2030)
Figure 30 North America Frozen Processed Foods Revenue (USD Million) By Type (2023-2030)
Figure 31 North America Frozen Processed Foods Revenue (USD Million) By Applications (2023-2030)
Figure 32 Europe Frozen Processed Foods Revenue (USD Million) By Country (2023-2030)
Figure 33 Europe Frozen Processed Foods Revenue (USD Million) By Type (2023-2030)
Figure 34 Europe Frozen Processed Foods Revenue (USD Million) By Applications (2023-2030)
Figure 35 Asia Pacific Frozen Processed Foods Revenue (USD Million) By Country (2023-2030)
Figure 36 Asia Pacific Frozen Processed Foods Revenue (USD Million) By Type (2023-2030)
Figure 37 Asia Pacific Frozen Processed Foods Revenue (USD Million) By Applications (2023-2030)
Figure 38 South America Frozen Processed Foods Revenue (USD Million) By Country (2023-2030)
Figure 39 South America Frozen Processed Foods Revenue (USD Million) By Type (2023-2030)
Figure 40 South America Frozen Processed Foods Revenue (USD Million) By Applications (2023-2030)
Figure 41 Middle East and Africa Frozen Processed Foods Revenue (USD Million) By Region (2023-2030)
Figure 42 Middle East and Africa Frozen Processed Foods Revenue (USD Million) By Region (2023-2030)
Figure 43 Middle East and Africa Frozen Processed Foods Revenue (USD Million) By Type (2023-2030)
Figure 44 Middle East and Africa Frozen Processed Foods Revenue (USD Million) By Applications (2023-2030)
Figure 45 Bottom-Up and Top-Down Approaches For This Report
Figure 46 Data Triangulation
