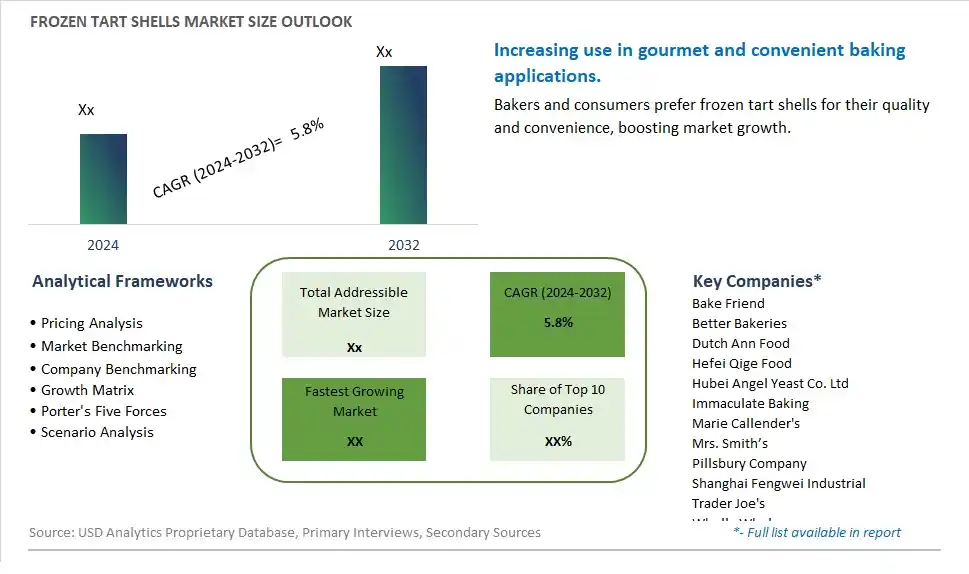
Global Frozen Tart Shells Market Size is valued at $XX Million in 2024 and is forecast to register a growth rate (CAGR) of 5.8% to reach $XX Million by 2032.
The global Frozen Tart Shells Market Comprehensive Study analyzes and forecasts the market size across 6 regions and 24 countries for diverse segments -By Type (Rolls, Flat, Shells, Others), By Application (Online, Retail, Others)
An Introduction to Frozen Tart Shells Market
The Frozen Tart Shells market in 2024 is experiencing significant growth, driven by the rising demand for convenient and high-quality baking ingredients. Frozen tart shells, known for their ease of use and consistent quality, are popular among home bakers and foodservice providers. The market benefits from advancements in freezing and packaging technologies, the growing trend of home baking and gourmet desserts, and the expansion of the global bakery sector. Additionally, the increasing focus on clean label and natural ingredients in tart shells is contributing to market growth.
Frozen Tart Shells Competitive Landscape
The market report analyses the leading companies in the industry including Bake Friend, Better Bakeries, Dutch Ann Food, Hefei Qige Food, Hubei Angel Yeast Co. Ltd, Immaculate Baking, Marie Callender's, Mrs. Smith’s, Pillsbury Company, Shanghai Fengwei Industrial, Trader Joe's, Wholly Wholesome, and Others.
Frozen Tart Shells Market Dynamics
Frozen Tart Shells Market Trend: Rising Demand for Convenient Baking Solutions
The most prominent trend in the Frozen Tart Shells Market is the rising demand for convenient baking solutions. As consumers seek easy-to-use products for homemade desserts, frozen tart shells are gaining popularity for their convenience and consistent quality. This trend is driven by the busy lifestyles of modern consumers who want to prepare impressive desserts without the hassle of making tart shells from scratch.
Frozen Tart Shells Market Driver: Growth in Home Baking and Entertaining
The key driver of the Frozen Tart Shells Market is the growth in home baking and entertaining. As more people host gatherings and look for simple yet impressive desserts, there is a higher demand for frozen tart shells that can be easily filled and baked. This driver is supported by the trend towards cooking and baking at home, driving market growth for convenient baking solutions.
Frozen Tart Shells Market Opportunity: Innovation in Tart Shell Varieties and Formulations
A significant opportunity in the Frozen Tart Shells Market lies in innovation in tart shell varieties and formulations. By developing new types of tart shells, such as whole-grain, gluten-free, or flavored options, companies can cater to diverse consumer preferences. Offering innovative and high-quality frozen tart shells can help expand market reach and increase consumer satisfaction, driving growth in the baking sector.
Frozen Tart Shells Market Share Analysis: Online is the fastest growing segment over the forecast period to 2032
The Online segment is the fastest-growing within the Frozen Tart Shells Market by application, projected to experience significant growth up to 2032. The shift towards e-commerce and online shopping is a primary driver of this rapid growth. Consumers increasingly appreciate the convenience of ordering products from their homes, the ability to compare prices and read reviews, and the vast selection available online. The Past few yearsaccelerated this trend, making online shopping an integral part of consumer behavior. Online platforms offer detailed product descriptions, user reviews, and competitive pricing, which enhance the overall shopping experience and build consumer trust. Additionally, advancements in logistics and cold chain technology ensure that frozen tart shells are delivered fresh and in optimal condition. Online retailers often provide promotions, discounts, and subscription services, attracting a loyal customer base. As more consumers embrace digital shopping for their grocery needs, the online segment is expected to continue its robust growth, significantly impacting the frozen tart shells market.
Frozen Tart Shells Market Share Analysis: Shells segment generated the highest revenue share in the industry
Shells are the largest segment within the Frozen Tart Shells Market by type. This segment's dominance is driven by the versatility and convenience that tart shells offer to both consumers and food service providers. Frozen tart shells are pre-formed and ready to use, making them an ideal choice for creating a variety of desserts and savory dishes with minimal preparation time. Their consistent quality and size ensure reliable results, which is particularly important for commercial bakers and restaurants. The demand for tart shells is further boosted by the increasing popularity of homemade and artisanal baked goods, where consumers seek high-quality ingredients to recreate professional-level desserts at home. Additionally, the broad availability of tart shells in supermarkets, specialty stores, and online platforms makes them easily accessible to a wide customer base. The combination of convenience, versatility, and consistent quality secures tart shells as the largest segment in the frozen tart shells market.
Frozen Tart Shells Market Segmentation
By Type
Rolls
Flat
Shells
Others
By Application
Online
Retail
Others
Countries Analyzed
North America (US, Canada, Mexico)
Europe (Germany, UK, France, Spain, Italy, Russia, Rest of Europe)
Asia Pacific (China, India, Japan, South Korea, Australia, South East Asia, Rest of Asia)
South America (Brazil, Argentina, Rest of South America)
Middle East and Africa (Saudi Arabia, UAE, Rest of Middle East, South Africa, Egypt, Rest of Africa)
Frozen Tart Shells Companies Profiled in the Study
Bake Friend
Better Bakeries
Dutch Ann Food
Hefei Qige Food
Hubei Angel Yeast Co. Ltd
Immaculate Baking
Marie Callender's
Mrs. Smith’s
Pillsbury Company
Shanghai Fengwei Industrial
Trader Joe's
Wholly Wholesome
*- List Not Exhaustive
Chapter 1. TABLE OF CONTENTS
Chapter 2. Introduction to Frozen Tart Shells Market
2.1. Market Overview
2.2. Key Statistics and Report Highlights
2.3. Scope of the Comprehensive Study
2.3.1. Market Definition
2.3.2 Countries and Regions Covered
2.3.3 Research Objective
2.3.4 Units, Currency, and Conversions
2.3.5 Industry Value Chain
2.4. Key Market Segments
2.5. Key Companies
2.6. Study Period
Chapter 3. Strategic Analysis Review
3.1. Frozen Tart Shells Pricing Analysis and Forecast
3.2. Porter’s Five Forces
3.3. Market Ecosystem
3.4. SWOT Analysis
3.5. Regulatory Scenario
3.3. Effects of Inflation, Russia-Ukraine War, moderating economic growth, and other macroeconomic factors
Chapter 4. Competitive Landscape
4.1. Market Share Analysis
4.1.1. Global Frozen Tart Shells Market Share by Company, 2023
4.1.2. Product Offerings of Leading Frozen Tart Shells Companies
4.2. Market Entropy
4.2.1. New Product Launches in the Industry
4.2.2. Mergers, Acquisitions, Joint ventures, and Partnerships
4.3. Key Strategies and Best Practices
Chapter 5. Global Market Projections: Best, Reference, and Low Case Scenarios
5.1. Growth Analysis- Case Scenario Definitions
5.2. Low Growth Case Scenario Forecasts
5.3. Reference Growth Case Scenario Forecasts
5.4. High Growth Case Scenario Forecasts
Chapter 6. Market Dynamics
6.1. Frozen Tart Shells Market Drivers
6.2. Frozen Tart Shells Market Challenges
6.6. Frozen Tart Shells Market Opportunities
6.4. Frozen Tart Shells Market Trends
Chapter 7. Global Frozen Tart Shells Market Outlook Trends
7.1. Global Frozen Tart Shells Revenue (USD Million) and CAGR (%) by Type (2021-2032)
7.2. Global Frozen Tart Shells Revenue (USD Million) and CAGR (%) by Application (2021-2032)
7.3. Global Frozen Tart Shells Revenue (USD Million) and CAGR (%) by Product (2021-2032)
By Type
Rolls
Flat
Shells
Others
By Application
Online
Retail
Others
Chapter 8. Global Frozen Tart Shells Regional Analysis and Outlook
8.1. Global Frozen Tart Shells Revenue (USD Million) By Regions (2021- 2032)
8.2. North America Frozen Tart Shells Revenue (USD Million) by Country (2021-2032)
8.2.1. United States Frozen Tart Shells Regional Analysis and Outlook
8.2.2. Canada Frozen Tart Shells Regional Analysis and Outlook
8.2.3. Mexico Frozen Tart Shells Regional Analysis and Outlook
8.3. Europe Frozen Tart Shells Revenue (USD Million), by Country (2021-2032)
8.3.1. Germany Frozen Tart Shells Regional Analysis and Outlook
8.3.2. France Frozen Tart Shells Regional Analysis and Outlook
8.3.3. United Kingdom Frozen Tart Shells Regional Analysis and Outlook
8.3.4. Spain Frozen Tart Shells Regional Analysis and Outlook
8.3.5. Italy Frozen Tart Shells Regional Analysis and Outlook
8.3.6. Russia Frozen Tart Shells Regional Analysis and Outlook
8.3.7. Rest of Europe Frozen Tart Shells Regional Analysis and Outlook
8.4. Asia Pacific Frozen Tart Shells Revenue (USD Million) by Country (2021-2032)
8.4.1. China Frozen Tart Shells Regional Analysis and Outlook
8.4.2. Japan Frozen Tart Shells Regional Analysis and Outlook
8.4.3. India Frozen Tart Shells Regional Analysis and Outlook
8.4.4. South Korea Frozen Tart Shells Regional Analysis and Outlook
8.4.5. Australia Frozen Tart Shells Regional Analysis and Outlook
8.4.6. South East Asia Frozen Tart Shells Regional Analysis and Outlook
8.4.7. Rest of Asia Pacific Frozen Tart Shells Regional Analysis and Outlook
8.5. South America Frozen Tart Shells Revenue (USD Million), by Country (2021-2032)
8.5.1. Brazil Frozen Tart Shells Regional Analysis and Outlook
8.5.2. Argentina Frozen Tart Shells Regional Analysis and Outlook
8.5.3. Rest of South America Frozen Tart Shells Regional Analysis and Outlook
8.6. Middle East and Africa Frozen Tart Shells Revenue (USD Million) by Country (2021-2032)
8.6.1. Middle East Frozen Tart Shells Regional Analysis and Outlook
8.6.2. Africa Frozen Tart Shells Regional Analysis and Outlook
Chapter 9. North America Frozen Tart Shells Analysis and Outlook
9.1. North America Frozen Tart Shells Revenue (USD Million) by Segments (2021-2032)
9.1.1. North America Frozen Tart Shells Revenue (USD Million) by Type (2021-2032)
9.1.2. North America Frozen Tart Shells Revenue (USD Million) by Application (2021-2032)
9.1.3. North America Frozen Tart Shells Revenue (USD Million) by Product (2021-2032)
By Type
Rolls
Flat
Shells
Others
By Application
Online
Retail
Others
Chapter 10. Europe Frozen Tart Shells Analysis and Outlook
10.1. Europe Frozen Tart Shells Revenue (USD Million), by Segments (USD Million) (2021-2032)
10.1.1. Europe Frozen Tart Shells Revenue (USD Million) by Type (2021-2032)
10.1.2. Europe Frozen Tart Shells Revenue (USD Million) by Application (2021-2032)
10.1.3. Europe Frozen Tart Shells Revenue (USD Million) by Product (2021-2032)
By Type
Rolls
Flat
Shells
Others
By Application
Online
Retail
Others
Chapter 11. Asia Pacific Frozen Tart Shells Analysis and Outlook
11.1. Asia Pacific Frozen Tart Shells Revenue (USD Million), and Revenue (USD Million) by Segments (2021-2032)
11.1.1. Asia Pacific Frozen Tart Shells Revenue (USD Million) by Type (2021-2032)
11.1.2. Asia Pacific Frozen Tart Shells Revenue (USD Million) by Application (2021-2032)
11.1.3. Asia Pacific Frozen Tart Shells Revenue (USD Million) by Product (2021-2032)
By Type
Rolls
Flat
Shells
Others
By Application
Online
Retail
Others
Chapter 12. South America Frozen Tart Shells Analysis and Outlook
12.1. South America Frozen Tart Shells Revenue (USD Million), by Segments (2021-2032)
12.1.1. South America Frozen Tart Shells Revenue (USD Million) by Type (2021-2032)
12.1.2. South America Frozen Tart Shells Revenue (USD Million) by Application (2021-2032)
12.1.3. South America Frozen Tart Shells Revenue (USD Million) by Product (2021-2032)
By Type
Rolls
Flat
Shells
Others
By Application
Online
Retail
Others
Chapter 13. Middle East and Africa Frozen Tart Shells Analysis and Outlook
13.1. Middle East and Africa Frozen Tart Shells Revenue (USD Million), by Segments (2021-2032)
13.1.1. Middle East and Africa Frozen Tart Shells Revenue (USD Million) by Type (2021-2032)
13.1.2. Middle East and Africa Frozen Tart Shells Revenue (USD Million) by Application (2021-2032)
13.1.3. Middle East and Africa Frozen Tart Shells Revenue (USD Million) by Product (2021-2032)
By Type
Rolls
Flat
Shells
Others
By Application
Online
Retail
Others
Chapter 14. Frozen Tart Shells Company Profiles
14.1 Business Overview
14.2 Product Profiles
14.3 SWOT Profiles
14.5 Recent Developments
14.6 Financial Profile
List of Companies
Bake Friend
Better Bakeries
Dutch Ann Food
Hefei Qige Food
Hubei Angel Yeast Co. Ltd
Immaculate Baking
Marie Callender's
Mrs. Smith’s
Pillsbury Company
Shanghai Fengwei Industrial
Trader Joe's
Wholly Wholesome
15. Methodology and Data Sources
15.1 Customization Offerings
15.2 Subscription Services
15.3 Related Reports
15.4 Publisher Expertise
LIST OF TABLES
Table 1 Market Segmentation Analysis
Table 2 Global Frozen Tart Shells Market Share of Leading Companies, 2023
Table 3 Product Offerings of Leading Companies
Table 4 Low Growth Scenario Forecasts
Table 5 Reference Case Growth Scenario
Table 6 High Growth Case Scenario
Table 7 Global Frozen Tart Shells Revenue (USD Million) And CAGR (%) By Type (2021-2032)
Table 8 Global Frozen Tart Shells Revenue (USD Million) And CAGR (%) By Application (2021-2032)
Table 9 Global Frozen Tart Shells Revenue (USD Million) And CAGR (%) By Product (2021-2032)
Table 10 Global Frozen Tart Shells Market Revenue (USD Million) By Regions (2021-2032)
Table 11 Global Frozen Tart Shells Market Share (%) By Regions (2021-2032)
Table 12 North America Frozen Tart Shells Revenue (USD Million) By Country (2021-2032)
Table 13 Europe Frozen Tart Shells Revenue (USD Million) By Country (2021-2032)
Table 14 Asia Pacific Frozen Tart Shells Revenue (USD Million) By Country (2021-2032)
Table 15 South America Frozen Tart Shells Revenue (USD Million) By Country (2021-2032)
Table 16 Middle East and Africa Frozen Tart Shells Revenue (USD Million) By Region (2021-2032)
Table 17 North America Frozen Tart Shells Revenue (USD Million) By Type (2021-2032)
Table 18 North America Frozen Tart Shells Revenue (USD Million) By Application (2021-2032)
Table 19 North America Frozen Tart Shells Revenue (USD Million) By Product (2021-2032)
Table 20 Europe Frozen Tart Shells Revenue (USD Million) By Type (2021-2032)
Table 21 Europe Frozen Tart Shells Revenue (USD Million) By Application (2021-2032)
Table 22 Europe Frozen Tart Shells Revenue (USD Million) By Product (2021-2032)
Table 23 Asia Pacific Frozen Tart Shells Revenue (USD Million) By Type (2021-2032)
Table 24 Asia Pacific Frozen Tart Shells Revenue (USD Million) By Application (2021-2032)
Table 25 Asia Pacific Frozen Tart Shells Revenue (USD Million) By Product (2021-2032)
Table 26 South America Frozen Tart Shells Revenue (USD Million) By Type (2021-2032)
Table 27 South America Frozen Tart Shells Revenue (USD Million) By Application (2021-2032)
Table 28 South America Frozen Tart Shells Revenue (USD Million) By Product (2021-2032)
Table 29 Middle East and Africa Frozen Tart Shells Revenue (USD Million) By Type (2021-2032)
Table 30 Middle East and Africa Frozen Tart Shells Revenue (USD Million) By Application (2021-2032)
Table 31 Middle East and Africa Frozen Tart Shells Revenue (USD Million) By Product (2021-2032)
LIST OF FIGURES
Figure 1. Market Scope
Figure 2. Pricing Forecasts Per Unit, 2023- 2032
Figure 3. Porter’s Five Forces
Figure 4. Global Frozen Tart Shells Market Revenue (USD Million) By Regions (2021-2032)
Figure 5. Global Frozen Tart Shells Market Share (%) By Regions (2023)
Figure 6. North America Frozen Tart Shells Revenue (USD Million) By Country (2021-2032)
Figure 7. United States Frozen Tart Shells Revenue (USD Million) By Country (2021-2032)
Figure 8. Canada Frozen Tart Shells Revenue (USD Million) By Country (2021-2032)
Figure 9. Mexico Frozen Tart Shells Revenue (USD Million) By Country (2021-2032)
Figure 10. Europe Frozen Tart Shells Revenue (USD Million) By Country (2021-2032)
Figure 11. Germany Frozen Tart Shells Revenue (USD Million) By Country (2021-2032)
Figure 12. France Frozen Tart Shells Revenue (USD Million) By Country (2021-2032)
Figure 13. United Kingdom Frozen Tart Shells Revenue (USD Million) By Country (2021-2032)
Figure 14. Spain Frozen Tart Shells Revenue (USD Million) By Country (2021-2032)
Figure 15. Italy Frozen Tart Shells Revenue (USD Million) By Country (2021-2032)
Figure 16. Russia Frozen Tart Shells Revenue (USD Million) By Country (2021-2032)
Figure 17. Rest of Europe Frozen Tart Shells Revenue (USD Million) By Country (2021-2032)
Figure 11. Asia Pacific Frozen Tart Shells Revenue (USD Million) By Country (2021-2032)
Figure 12. China Frozen Tart Shells Revenue (USD Million) By Country (2021-2032)
Figure 13. Japan Frozen Tart Shells Revenue (USD Million) By Country (2021-2032)
Figure 14. India Frozen Tart Shells Revenue (USD Million) By Country (2021-2032)
Figure 15. South Korea Frozen Tart Shells Revenue (USD Million) By Country (2021-2032)
Figure 16. Australia Frozen Tart Shells Revenue (USD Million) By Country (2021-2032)
Figure 17. South East Asia Frozen Tart Shells Revenue (USD Million) By Country (2021-2032)
Figure 18. South America Frozen Tart Shells Revenue (USD Million) By Country (2021-2032)
Figure 19. Brazil Frozen Tart Shells Revenue (USD Million) By Country (2021-2032)
Figure 20. Argentina Frozen Tart Shells Revenue (USD Million) By Country (2021-2032)
Figure 21. Rest of Asia Pacific Frozen Tart Shells Revenue (USD Million) By Country (2021-2032)
Figure 22. Middle East and Africa Frozen Tart Shells Revenue (USD Million) By Region (2021-2032)
Figure 23. Saudi Arabia Frozen Tart Shells Revenue (USD Million) By Region (2021-2032)
Figure 24. The UAE Frozen Tart Shells Revenue (USD Million) By Region (2021-2032)
Figure 25. Rest of Middle East Frozen Tart Shells Revenue (USD Million) By Region (2021-2032)
Figure 26. South Africa Frozen Tart Shells Revenue (USD Million) By Region (2021-2032)
Figure 27. Africa Frozen Tart Shells Revenue (USD Million) By Region (2021-2032)
Figure 28. North America Frozen Tart Shells Revenue (USD Million) By Type (2021-2032)
Figure 29. North America Frozen Tart Shells Revenue (USD Million) By Application (2021-2032)
Figure 30. North America Frozen Tart Shells Revenue (USD Million) By Product (2021-2032)
Figure 31. Europe Frozen Tart Shells Revenue (USD Million) By Type (2021-2032)
Figure 32. Europe Frozen Tart Shells Revenue (USD Million) By Application (2021-2032)
Figure 33. Europe Frozen Tart Shells Revenue (USD Million) By Product (2021-2032)
Figure 34. Asia Pacific Frozen Tart Shells Revenue (USD Million) By Type (2021-2032)
Figure 35. Asia Pacific Frozen Tart Shells Revenue (USD Million) By Application (2021-2032)
Figure 36. Asia Pacific Frozen Tart Shells Revenue (USD Million) By Product (2021-2032)
Figure 37. South America Frozen Tart Shells Revenue (USD Million) By Type (2021-2032)
Figure 38. South America Frozen Tart Shells Revenue (USD Million) By Application (2021-2032)
Figure 39. South America Frozen Tart Shells Revenue (USD Million) By Product (2021-2032)
Figure 40. Middle East and Africa Frozen Tart Shells Revenue (USD Million) By Type (2021-2032)
Figure 41. Middle East and Africa Frozen Tart Shells Revenue (USD Million) By Application (2021-2032)
Figure 42. Middle East and Africa Frozen Tart Shells Revenue (USD Million) By Product (2021-2032)
By Type
Rolls
Flat
Shells
Others
By Application
Online
Retail
Others
Countries Analyzed
North America (US, Canada, Mexico)
Europe (Germany, UK, France, Spain, Italy, Russia, Rest of Europe)
Asia Pacific (China, India, Japan, South Korea, Australia, South East Asia, Rest of Asia)
South America (Brazil, Argentina, Rest of South America)
Middle East and Africa (Saudi Arabia, UAE, Rest of Middle East, South Africa, Egypt, Rest of Africa)
