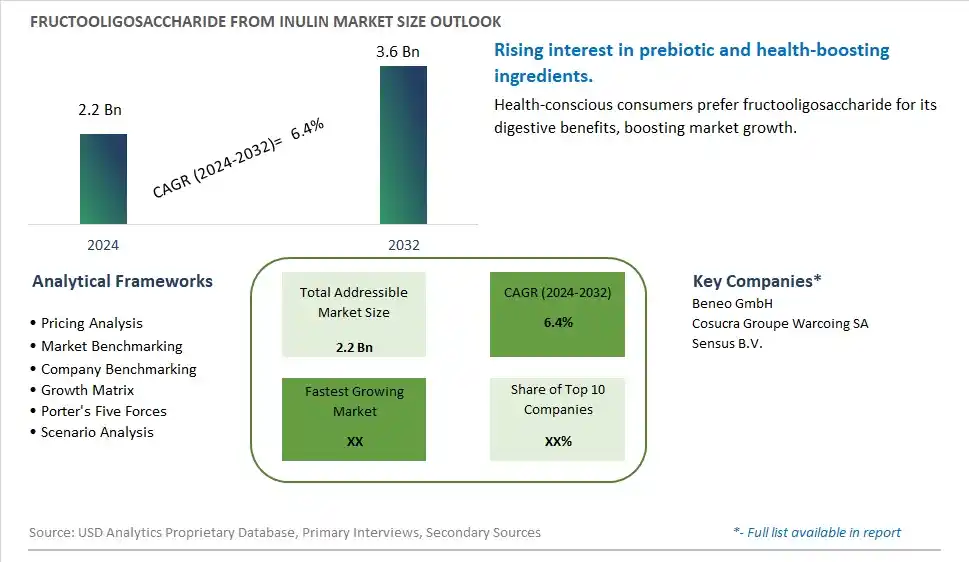
Global Fructooligosaccharide from Inulin Market Size is valued at $2.2 Billion in 2024 and is forecast to register a growth rate (CAGR) of 6.4% to reach $3.6 Billion by 2032.
The global Fructooligosaccharide from Inulin Market Comprehensive Study analyzes and forecasts the market size across 6 regions and 24 countries for diverse segments -By Type (Liquid FOS, Solid FOS), By Application (Bakery and Confectionary, Soft Drinks, Fruit Beverages, Dairy, Baby Foods, Animal Foods, Nutrition Supplements, Others)
An Introduction to Fructooligosaccharide from Inulin Market
The fructooligosaccharide from inulin market in 2024 is expanding rapidly, driven by the rising demand for prebiotic ingredients in functional foods and dietary supplements. Fructooligosaccharides (FOS), derived from inulin, are valued for their ability to promote gut health and enhance the growth of beneficial bacteria. The market is benefiting from increasing consumer awareness of the health benefits associated with prebiotics. Innovations in extraction and processing techniques are enhancing the purity and effectiveness of FOS products. The trend towards natural and clean label ingredients is also influencing market dynamics, supporting the growth of FOS from inulin in various applications.
Fructooligosaccharide from Inulin Competitive Landscape
The market report analyses the leading companies in the industry including Beneo GmbH, Cosucra Groupe Warcoing SA, Sensus B.V., and Others.
Fructooligosaccharide from Inulin Market Dynamics
Fructooligosaccharide from Inulin Market Trend: Growing Popularity of Prebiotic Ingredients
The most prominent trend in the Fructooligosaccharide from Inulin Market is the growing popularity of prebiotic ingredients. Fructooligosaccharides (FOS) derived from inulin are increasingly favored for their prebiotic properties, which promote gut health and overall well-being. This trend is driven by the rising consumer interest in digestive health and the benefits of prebiotics in supporting a healthy microbiome.
Fructooligosaccharide from Inulin Market Driver: Increasing Health Awareness
A key driver in the Fructooligosaccharide from Inulin Market is the increasing health awareness among consumers. As more individuals become educated about the importance of gut health, there is a growing demand for functional ingredients that support digestive health. FOS from inulin offers a natural and effective solution, making it a popular choice for food and supplement manufacturers looking to enhance the health benefits of their products.
Fructooligosaccharide from Inulin Market Opportunity: Expansion into Functional Food and Beverage Products
One significant opportunity in the Fructooligosaccharide from Inulin Market lies in the expansion into functional food and beverage products. There is potential for incorporating FOS into a wide range of applications, from dairy and bakery products to beverages and nutritional supplements. Companies that invest in research and development to create innovative formulations and product offerings can capitalize on this growing trend and drive market growth.
Fructooligosaccharide from Inulin Market Share Analysis: Solid FOS segment generated the highest revenue share in the industry
Solid FOS stands out as the largest segment within the Fructooligosaccharide (FOS) from Inulin Market. Solid FOS, derived from inulin, is characterized by its powdered or granulated form, offering versatility in food and beverage applications as a prebiotic ingredient. It is widely used in the food industry to enhance the nutritional profile of products by serving as a low-calorie sweetener and fiber source that promotes gut health. The growing consumer awareness of the health benefits associated with prebiotic fibers like FOS, such as improved digestion and immune function, is driving the demand for solid FOS across various food and beverage sectors. Additionally, solid FOS's stability and ease of incorporation into formulations make it a preferred choice among manufacturers looking to develop functional foods and dietary supplements that cater to the increasing demand for natural and health-promoting ingredients. As dietary trends continue to emphasize the importance of digestive health and reduced sugar intake, solid FOS is expected to maintain its dominant position and experience continued growth in the global FOS market.
Fructooligosaccharide from Inulin Market Share Analysis: Nutrition Supplements is the fastest growing segment over the forecast period to 2032
Nutrition supplements emerge as the fastest-growing segment within the Fructooligosaccharide (FOS) from Inulin Market through 2032. This growth is propelled by increasing consumer awareness of digestive health and the rising demand for functional ingredients in dietary supplements. FOS, derived from inulin, is valued in nutrition supplements for its prebiotic properties, which support gut health by promoting the growth of beneficial bacteria in the colon. As consumers seek natural and effective solutions to enhance their overall well-being, FOS in nutrition supplements offers a compelling option due to its ability to improve digestion, boost immune function, and potentially aid in weight management. Further, the versatility of FOS allows for easy integration into various supplement formats, including capsules, powders, and chewables, catering to diverse consumer preferences and lifestyle needs. With ongoing research highlighting the health benefits of FOS and expanding product offerings in the supplement market, the nutrition supplements segment is poised for significant growth, driving innovation and market expansion in the FOS from Inulin Market globally.
Fructooligosaccharide from Inulin Market Segmentation
By Type
Liquid FOS
Solid FOS
By Application
Bakery and Confectionary
Soft Drinks
Fruit Beverages
Dairy
Baby Foods
Animal Foods
Nutrition Supplements
Others
Countries Analyzed
North America (US, Canada, Mexico)
Europe (Germany, UK, France, Spain, Italy, Russia, Rest of Europe)
Asia Pacific (China, India, Japan, South Korea, Australia, South East Asia, Rest of Asia)
South America (Brazil, Argentina, Rest of South America)
Middle East and Africa (Saudi Arabia, UAE, Rest of Middle East, South Africa, Egypt, Rest of Africa)
Fructooligosaccharide from Inulin Companies Profiled in the Study
Beneo GmbH
Cosucra Groupe Warcoing SA
Sensus B.V.
*- List Not Exhaustive
Chapter 1. TABLE OF CONTENTS
Chapter 2. Introduction to Fructooligosaccharide from Inulin Market
2.1. Market Overview
2.2. Key Statistics and Report Highlights
2.3. Scope of the Comprehensive Study
2.3.1. Market Definition
2.3.2 Countries and Regions Covered
2.3.3 Research Objective
2.3.4 Units, Currency, and Conversions
2.3.5 Industry Value Chain
2.4. Key Market Segments
2.5. Key Companies
2.6. Study Period
Chapter 3. Strategic Analysis Review
3.1. Fructooligosaccharide from Inulin Pricing Analysis and Forecast
3.2. Porter’s Five Forces
3.3. Market Ecosystem
3.4. SWOT Analysis
3.5. Regulatory Scenario
3.3. Effects of Inflation, Russia-Ukraine War, moderating economic growth, and other macroeconomic factors
Chapter 4. Competitive Landscape
4.1. Market Share Analysis
4.1.1. Global Fructooligosaccharide from Inulin Market Share by Company, 2023
4.1.2. Product Offerings of Leading Fructooligosaccharide from Inulin Companies
4.2. Market Entropy
4.2.1. New Product Launches in the Industry
4.2.2. Mergers, Acquisitions, Joint ventures, and Partnerships
4.3. Key Strategies and Best Practices
Chapter 5. Global Market Projections: Best, Reference, and Low Case Scenarios
5.1. Growth Analysis- Case Scenario Definitions
5.2. Low Growth Case Scenario Forecasts
5.3. Reference Growth Case Scenario Forecasts
5.4. High Growth Case Scenario Forecasts
Chapter 6. Market Dynamics
6.1. Fructooligosaccharide from Inulin Market Drivers
6.2. Fructooligosaccharide from Inulin Market Challenges
6.6. Fructooligosaccharide from Inulin Market Opportunities
6.4. Fructooligosaccharide from Inulin Market Trends
Chapter 7. Global Fructooligosaccharide from Inulin Market Outlook Trends
7.1. Global Fructooligosaccharide from Inulin Revenue (USD Million) and CAGR (%) by Type (2021-2032)
7.2. Global Fructooligosaccharide from Inulin Revenue (USD Million) and CAGR (%) by Application (2021-2032)
7.3. Global Fructooligosaccharide from Inulin Revenue (USD Million) and CAGR (%) by Product (2021-2032)
By Type
Liquid FOS
Solid FOS
By Application
Bakery and Confectionary
Soft Drinks
Fruit Beverages
Dairy
Baby Foods
Animal Foods
Nutrition Supplements
Others
Chapter 8. Global Fructooligosaccharide from Inulin Regional Analysis and Outlook
8.1. Global Fructooligosaccharide from Inulin Revenue (USD Million) By Regions (2021- 2032)
8.2. North America Fructooligosaccharide from Inulin Revenue (USD Million) by Country (2021-2032)
8.2.1. United States Fructooligosaccharide from Inulin Regional Analysis and Outlook
8.2.2. Canada Fructooligosaccharide from Inulin Regional Analysis and Outlook
8.2.3. Mexico Fructooligosaccharide from Inulin Regional Analysis and Outlook
8.3. Europe Fructooligosaccharide from Inulin Revenue (USD Million), by Country (2021-2032)
8.3.1. Germany Fructooligosaccharide from Inulin Regional Analysis and Outlook
8.3.2. France Fructooligosaccharide from Inulin Regional Analysis and Outlook
8.3.3. United Kingdom Fructooligosaccharide from Inulin Regional Analysis and Outlook
8.3.4. Spain Fructooligosaccharide from Inulin Regional Analysis and Outlook
8.3.5. Italy Fructooligosaccharide from Inulin Regional Analysis and Outlook
8.3.6. Russia Fructooligosaccharide from Inulin Regional Analysis and Outlook
8.3.7. Rest of Europe Fructooligosaccharide from Inulin Regional Analysis and Outlook
8.4. Asia Pacific Fructooligosaccharide from Inulin Revenue (USD Million) by Country (2021-2032)
8.4.1. China Fructooligosaccharide from Inulin Regional Analysis and Outlook
8.4.2. Japan Fructooligosaccharide from Inulin Regional Analysis and Outlook
8.4.3. India Fructooligosaccharide from Inulin Regional Analysis and Outlook
8.4.4. South Korea Fructooligosaccharide from Inulin Regional Analysis and Outlook
8.4.5. Australia Fructooligosaccharide from Inulin Regional Analysis and Outlook
8.4.6. South East Asia Fructooligosaccharide from Inulin Regional Analysis and Outlook
8.4.7. Rest of Asia Pacific Fructooligosaccharide from Inulin Regional Analysis and Outlook
8.5. South America Fructooligosaccharide from Inulin Revenue (USD Million), by Country (2021-2032)
8.5.1. Brazil Fructooligosaccharide from Inulin Regional Analysis and Outlook
8.5.2. Argentina Fructooligosaccharide from Inulin Regional Analysis and Outlook
8.5.3. Rest of South America Fructooligosaccharide from Inulin Regional Analysis and Outlook
8.6. Middle East and Africa Fructooligosaccharide from Inulin Revenue (USD Million) by Country (2021-2032)
8.6.1. Middle East Fructooligosaccharide from Inulin Regional Analysis and Outlook
8.6.2. Africa Fructooligosaccharide from Inulin Regional Analysis and Outlook
Chapter 9. North America Fructooligosaccharide from Inulin Analysis and Outlook
9.1. North America Fructooligosaccharide from Inulin Revenue (USD Million) by Segments (2021-2032)
9.1.1. North America Fructooligosaccharide from Inulin Revenue (USD Million) by Type (2021-2032)
9.1.2. North America Fructooligosaccharide from Inulin Revenue (USD Million) by Application (2021-2032)
9.1.3. North America Fructooligosaccharide from Inulin Revenue (USD Million) by Product (2021-2032)
By Type
Liquid FOS
Solid FOS
By Application
Bakery and Confectionary
Soft Drinks
Fruit Beverages
Dairy
Baby Foods
Animal Foods
Nutrition Supplements
Others
Chapter 10. Europe Fructooligosaccharide from Inulin Analysis and Outlook
10.1. Europe Fructooligosaccharide from Inulin Revenue (USD Million), by Segments (USD Million) (2021-2032)
10.1.1. Europe Fructooligosaccharide from Inulin Revenue (USD Million) by Type (2021-2032)
10.1.2. Europe Fructooligosaccharide from Inulin Revenue (USD Million) by Application (2021-2032)
10.1.3. Europe Fructooligosaccharide from Inulin Revenue (USD Million) by Product (2021-2032)
By Type
Liquid FOS
Solid FOS
By Application
Bakery and Confectionary
Soft Drinks
Fruit Beverages
Dairy
Baby Foods
Animal Foods
Nutrition Supplements
Others
Chapter 11. Asia Pacific Fructooligosaccharide from Inulin Analysis and Outlook
11.1. Asia Pacific Fructooligosaccharide from Inulin Revenue (USD Million), and Revenue (USD Million) by Segments (2021-2032)
11.1.1. Asia Pacific Fructooligosaccharide from Inulin Revenue (USD Million) by Type (2021-2032)
11.1.2. Asia Pacific Fructooligosaccharide from Inulin Revenue (USD Million) by Application (2021-2032)
11.1.3. Asia Pacific Fructooligosaccharide from Inulin Revenue (USD Million) by Product (2021-2032)
By Type
Liquid FOS
Solid FOS
By Application
Bakery and Confectionary
Soft Drinks
Fruit Beverages
Dairy
Baby Foods
Animal Foods
Nutrition Supplements
Others
Chapter 12. South America Fructooligosaccharide from Inulin Analysis and Outlook
12.1. South America Fructooligosaccharide from Inulin Revenue (USD Million), by Segments (2021-2032)
12.1.1. South America Fructooligosaccharide from Inulin Revenue (USD Million) by Type (2021-2032)
12.1.2. South America Fructooligosaccharide from Inulin Revenue (USD Million) by Application (2021-2032)
12.1.3. South America Fructooligosaccharide from Inulin Revenue (USD Million) by Product (2021-2032)
By Type
Liquid FOS
Solid FOS
By Application
Bakery and Confectionary
Soft Drinks
Fruit Beverages
Dairy
Baby Foods
Animal Foods
Nutrition Supplements
Others
Chapter 13. Middle East and Africa Fructooligosaccharide from Inulin Analysis and Outlook
13.1. Middle East and Africa Fructooligosaccharide from Inulin Revenue (USD Million), by Segments (2021-2032)
13.1.1. Middle East and Africa Fructooligosaccharide from Inulin Revenue (USD Million) by Type (2021-2032)
13.1.2. Middle East and Africa Fructooligosaccharide from Inulin Revenue (USD Million) by Application (2021-2032)
13.1.3. Middle East and Africa Fructooligosaccharide from Inulin Revenue (USD Million) by Product (2021-2032)
By Type
Liquid FOS
Solid FOS
By Application
Bakery and Confectionary
Soft Drinks
Fruit Beverages
Dairy
Baby Foods
Animal Foods
Nutrition Supplements
Others
Chapter 14. Fructooligosaccharide from Inulin Company Profiles
14.1 Business Overview
14.2 Product Profiles
14.3 SWOT Profiles
14.5 Recent Developments
14.6 Financial Profile
List of Companies
Beneo GmbH
Cosucra Groupe Warcoing SA
Sensus B.V.
15. Methodology and Data Sources
15.1 Customization Offerings
15.2 Subscription Services
15.3 Related Reports
15.4 Publisher Expertise
LIST OF TABLES
Table 1 Market Segmentation Analysis
Table 2 Global Fructooligosaccharide from Inulin Market Share of Leading Companies, 2023
Table 3 Product Offerings of Leading Companies
Table 4 Low Growth Scenario Forecasts
Table 5 Reference Case Growth Scenario
Table 6 High Growth Case Scenario
Table 7 Global Fructooligosaccharide from Inulin Revenue (USD Million) And CAGR (%) By Type (2021-2032)
Table 8 Global Fructooligosaccharide from Inulin Revenue (USD Million) And CAGR (%) By Application (2021-2032)
Table 9 Global Fructooligosaccharide from Inulin Revenue (USD Million) And CAGR (%) By Product (2021-2032)
Table 10 Global Fructooligosaccharide from Inulin Market Revenue (USD Million) By Regions (2021-2032)
Table 11 Global Fructooligosaccharide from Inulin Market Share (%) By Regions (2021-2032)
Table 12 North America Fructooligosaccharide from Inulin Revenue (USD Million) By Country (2021-2032)
Table 13 Europe Fructooligosaccharide from Inulin Revenue (USD Million) By Country (2021-2032)
Table 14 Asia Pacific Fructooligosaccharide from Inulin Revenue (USD Million) By Country (2021-2032)
Table 15 South America Fructooligosaccharide from Inulin Revenue (USD Million) By Country (2021-2032)
Table 16 Middle East and Africa Fructooligosaccharide from Inulin Revenue (USD Million) By Region (2021-2032)
Table 17 North America Fructooligosaccharide from Inulin Revenue (USD Million) By Type (2021-2032)
Table 18 North America Fructooligosaccharide from Inulin Revenue (USD Million) By Application (2021-2032)
Table 19 North America Fructooligosaccharide from Inulin Revenue (USD Million) By Product (2021-2032)
Table 20 Europe Fructooligosaccharide from Inulin Revenue (USD Million) By Type (2021-2032)
Table 21 Europe Fructooligosaccharide from Inulin Revenue (USD Million) By Application (2021-2032)
Table 22 Europe Fructooligosaccharide from Inulin Revenue (USD Million) By Product (2021-2032)
Table 23 Asia Pacific Fructooligosaccharide from Inulin Revenue (USD Million) By Type (2021-2032)
Table 24 Asia Pacific Fructooligosaccharide from Inulin Revenue (USD Million) By Application (2021-2032)
Table 25 Asia Pacific Fructooligosaccharide from Inulin Revenue (USD Million) By Product (2021-2032)
Table 26 South America Fructooligosaccharide from Inulin Revenue (USD Million) By Type (2021-2032)
Table 27 South America Fructooligosaccharide from Inulin Revenue (USD Million) By Application (2021-2032)
Table 28 South America Fructooligosaccharide from Inulin Revenue (USD Million) By Product (2021-2032)
Table 29 Middle East and Africa Fructooligosaccharide from Inulin Revenue (USD Million) By Type (2021-2032)
Table 30 Middle East and Africa Fructooligosaccharide from Inulin Revenue (USD Million) By Application (2021-2032)
Table 31 Middle East and Africa Fructooligosaccharide from Inulin Revenue (USD Million) By Product (2021-2032)
LIST OF FIGURES
Figure 1. Market Scope
Figure 2. Pricing Forecasts Per Unit, 2023- 2032
Figure 3. Porter’s Five Forces
Figure 4. Global Fructooligosaccharide from Inulin Market Revenue (USD Million) By Regions (2021-2032)
Figure 5. Global Fructooligosaccharide from Inulin Market Share (%) By Regions (2023)
Figure 6. North America Fructooligosaccharide from Inulin Revenue (USD Million) By Country (2021-2032)
Figure 7. United States Fructooligosaccharide from Inulin Revenue (USD Million) By Country (2021-2032)
Figure 8. Canada Fructooligosaccharide from Inulin Revenue (USD Million) By Country (2021-2032)
Figure 9. Mexico Fructooligosaccharide from Inulin Revenue (USD Million) By Country (2021-2032)
Figure 10. Europe Fructooligosaccharide from Inulin Revenue (USD Million) By Country (2021-2032)
Figure 11. Germany Fructooligosaccharide from Inulin Revenue (USD Million) By Country (2021-2032)
Figure 12. France Fructooligosaccharide from Inulin Revenue (USD Million) By Country (2021-2032)
Figure 13. United Kingdom Fructooligosaccharide from Inulin Revenue (USD Million) By Country (2021-2032)
Figure 14. Spain Fructooligosaccharide from Inulin Revenue (USD Million) By Country (2021-2032)
Figure 15. Italy Fructooligosaccharide from Inulin Revenue (USD Million) By Country (2021-2032)
Figure 16. Russia Fructooligosaccharide from Inulin Revenue (USD Million) By Country (2021-2032)
Figure 17. Rest of Europe Fructooligosaccharide from Inulin Revenue (USD Million) By Country (2021-2032)
Figure 11. Asia Pacific Fructooligosaccharide from Inulin Revenue (USD Million) By Country (2021-2032)
Figure 12. China Fructooligosaccharide from Inulin Revenue (USD Million) By Country (2021-2032)
Figure 13. Japan Fructooligosaccharide from Inulin Revenue (USD Million) By Country (2021-2032)
Figure 14. India Fructooligosaccharide from Inulin Revenue (USD Million) By Country (2021-2032)
Figure 15. South Korea Fructooligosaccharide from Inulin Revenue (USD Million) By Country (2021-2032)
Figure 16. Australia Fructooligosaccharide from Inulin Revenue (USD Million) By Country (2021-2032)
Figure 17. South East Asia Fructooligosaccharide from Inulin Revenue (USD Million) By Country (2021-2032)
Figure 18. South America Fructooligosaccharide from Inulin Revenue (USD Million) By Country (2021-2032)
Figure 19. Brazil Fructooligosaccharide from Inulin Revenue (USD Million) By Country (2021-2032)
Figure 20. Argentina Fructooligosaccharide from Inulin Revenue (USD Million) By Country (2021-2032)
Figure 21. Rest of Asia Pacific Fructooligosaccharide from Inulin Revenue (USD Million) By Country (2021-2032)
Figure 22. Middle East and Africa Fructooligosaccharide from Inulin Revenue (USD Million) By Region (2021-2032)
Figure 23. Saudi Arabia Fructooligosaccharide from Inulin Revenue (USD Million) By Region (2021-2032)
Figure 24. The UAE Fructooligosaccharide from Inulin Revenue (USD Million) By Region (2021-2032)
Figure 25. Rest of Middle East Fructooligosaccharide from Inulin Revenue (USD Million) By Region (2021-2032)
Figure 26. South Africa Fructooligosaccharide from Inulin Revenue (USD Million) By Region (2021-2032)
Figure 27. Africa Fructooligosaccharide from Inulin Revenue (USD Million) By Region (2021-2032)
Figure 28. North America Fructooligosaccharide from Inulin Revenue (USD Million) By Type (2021-2032)
Figure 29. North America Fructooligosaccharide from Inulin Revenue (USD Million) By Application (2021-2032)
Figure 30. North America Fructooligosaccharide from Inulin Revenue (USD Million) By Product (2021-2032)
Figure 31. Europe Fructooligosaccharide from Inulin Revenue (USD Million) By Type (2021-2032)
Figure 32. Europe Fructooligosaccharide from Inulin Revenue (USD Million) By Application (2021-2032)
Figure 33. Europe Fructooligosaccharide from Inulin Revenue (USD Million) By Product (2021-2032)
Figure 34. Asia Pacific Fructooligosaccharide from Inulin Revenue (USD Million) By Type (2021-2032)
Figure 35. Asia Pacific Fructooligosaccharide from Inulin Revenue (USD Million) By Application (2021-2032)
Figure 36. Asia Pacific Fructooligosaccharide from Inulin Revenue (USD Million) By Product (2021-2032)
Figure 37. South America Fructooligosaccharide from Inulin Revenue (USD Million) By Type (2021-2032)
Figure 38. South America Fructooligosaccharide from Inulin Revenue (USD Million) By Application (2021-2032)
Figure 39. South America Fructooligosaccharide from Inulin Revenue (USD Million) By Product (2021-2032)
Figure 40. Middle East and Africa Fructooligosaccharide from Inulin Revenue (USD Million) By Type (2021-2032)
Figure 41. Middle East and Africa Fructooligosaccharide from Inulin Revenue (USD Million) By Application (2021-2032)
Figure 42. Middle East and Africa Fructooligosaccharide from Inulin Revenue (USD Million) By Product (2021-2032)
By Type
Liquid FOS
Solid FOS
By Application
Bakery and Confectionary
Soft Drinks
Fruit Beverages
Dairy
Baby Foods
Animal Foods
Nutrition Supplements
Others
Countries Analyzed
North America (US, Canada, Mexico)
Europe (Germany, UK, France, Spain, Italy, Russia, Rest of Europe)
Asia Pacific (China, India, Japan, South Korea, Australia, South East Asia, Rest of Asia)
South America (Brazil, Argentina, Rest of South America)
Middle East and Africa (Saudi Arabia, UAE, Rest of Middle East, South Africa, Egypt, Rest of Africa)
