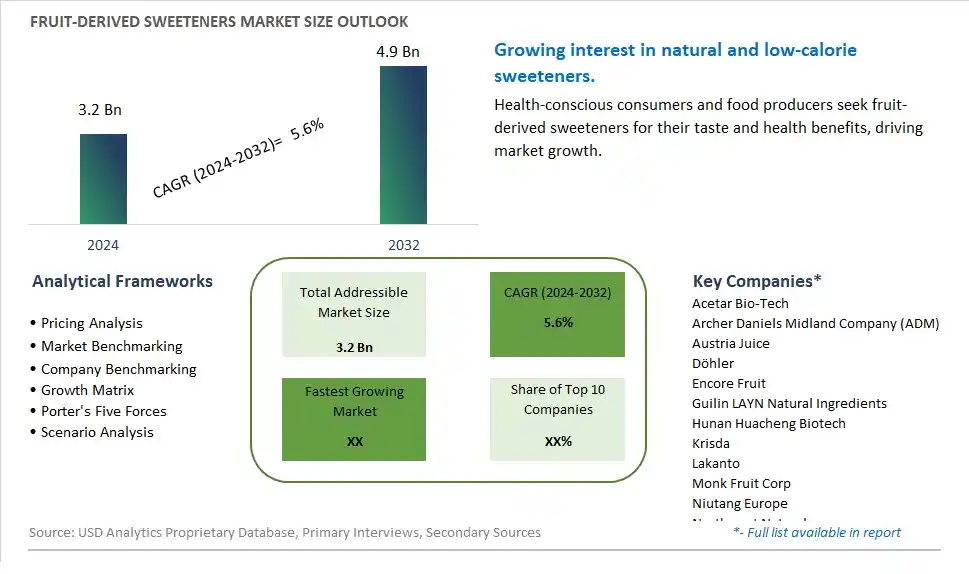
Global Fruit-derived Sweeteners Market Size is valued at $3.2 Billion in 2024 and is forecast to register a growth rate (CAGR) of 5.6% to reach $4.9 Billion by 2032.
The global Fruit-derived Sweeteners Market Comprehensive Study analyzes and forecasts the market size across 6 regions and 24 countries for diverse segments -By Type (Apple, Grape, Carob, Pineapple, Monk Fruit, Others), By Application (Beverages, Food, Pharmaceuticals, Others)
An Introduction to Fruit-derived Sweeteners Market
The Fruit-Derived Sweeteners Market focuses on the production and sale of natural sweeteners derived from fruits, such as monk fruit and stevia. These sweeteners cater to consumers seeking low-calorie and natural alternatives to sugar. The market is driven by rising health consciousness, increasing prevalence of diabetes and obesity, and growing demand for natural and clean label sweeteners. Additionally, advancements in sweetener extraction technologies and the expansion of product applications support market growth.
Fruit derived Sweeteners Competitive Landscape
The market report analyses the leading companies in the industry including Acetar Bio-Tech, Archer Daniels Midland Company (ADM), Austria Juice, Döhler, Encore Fruit, Guilin LAYN Natural Ingredients, Hunan Huacheng Biotech, Krisda, Lakanto, Monk Fruit Corp, Niutang Europe, Northwest Naturals, Organic Herb, Tate & Lyle Plc, Xian Tonking Biotech, and Others.
Fruit derived Sweeteners Market Dynamics
Fruit-Derived Sweeteners Market Trend: Rising Demand for Natural and Low-Calorie Sweeteners
The most prominent trend in the Fruit-Derived Sweeteners Market is the rising demand for natural and low-calorie sweeteners. As consumers seek to reduce sugar intake without compromising on taste, fruit-derived sweeteners are gaining popularity for their natural origin and lower calorie content. This trend is driven by the increasing prevalence of diabetes, obesity, and other lifestyle-related health issues, which are prompting consumers to opt for healthier alternatives to sugar.
Fruit-Derived Sweeteners Market Driver: Increase in Health and Wellness Products
The key driver of the Fruit-Derived Sweeteners Market is the increase in health and wellness products. As more consumers focus on managing their weight and improving their overall health, there is a higher demand for natural sweeteners that offer the sweetness of sugar without the associated health risks. Fruit-derived sweeteners, with their low-calorie content and natural properties, are widely used in the production of sugar-free, reduced-calorie, and functional food products, driving their market growth.
Fruit-Derived Sweeteners Market Opportunity: Expansion into Functional and Fortified Foods
A significant opportunity in the Fruit-Derived Sweeteners Market lies in the expansion into functional and fortified foods. By incorporating fruit-derived sweeteners into a variety of food products, such as protein bars, fortified snacks, and health drinks, companies can cater to the growing demand for functional foods that offer specific health benefits. This approach can help manufacturers capture a larger share of the health-conscious consumer market and drive market growth.
Fruit-derived Sweeteners Market Share Analysis- Largest Segment by Type
The Monk Fruit segment is the largest in the Fruit-derived Sweeteners Market by type. This dominance is driven by the increasing consumer demand for natural and low-calorie sweeteners that do not raise blood sugar levels. Monk fruit sweeteners, derived from the monk fruit, are known for their high sweetness intensity without the calories, making them an ideal choice for health-conscious consumers and those managing diabetes or weight. The continuous innovation in food and beverage formulations, including the introduction of monk fruit-sweetened products, enhances their appeal. Additionally, the growing trend of clean-label and natural ingredients supports the significant market share of monk fruit sweeteners. The extensive availability of monk fruit sweeteners in supermarkets, health food stores, and online platforms further boosts their accessibility to a broad consumer base. The strong consumer preference for natural and healthy sugar alternatives reinforces the dominant position of the monk fruit segment in the market.
Fruit-derived Sweeteners Market Share Analysis- Fastest Growing Segment by Application
The Beverages segment is poised to grow the fastest in the Fruit-derived Sweeteners Market by application over the next five years. This rapid growth is driven by the increasing consumer demand for low-calorie and naturally sweetened beverages, such as juices, flavored waters, and energy drinks. Fruit-derived sweeteners are widely used in beverages for their natural sweetness and health benefits, catering to the rising trend of health and wellness. The continuous innovation in beverage formulations, including the introduction of new flavors and functional ingredients, supports the demand for fruit-derived sweeteners in this segment. Additionally, the influence of health influencers and the growing awareness of the negative health impacts of artificial sweeteners further drive the adoption of natural sweeteners in beverages. The expanding market for healthy and functional beverages, along with the increasing availability of fruit-sweetened drinks in retail and online platforms, contributes to the fast growth of the beverages segment.
Fruit derived Sweeteners Market Segmentation
By Type
Apple
Grape
Carob
Pineapple
Monk Fruit
Others
By Application
Beverages
Food
Pharmaceuticals
Others
Countries Analyzed
North America (US, Canada, Mexico)
Europe (Germany, UK, France, Spain, Italy, Russia, Rest of Europe)
Asia Pacific (China, India, Japan, South Korea, Australia, South East Asia, Rest of Asia)
South America (Brazil, Argentina, Rest of South America)
Middle East and Africa (Saudi Arabia, UAE, Rest of Middle East, South Africa, Egypt, Rest of Africa)
Fruit derived Sweeteners Companies Profiled in the Study
Acetar Bio-Tech
Archer Daniels Midland Company (ADM)
Austria Juice
Döhler
Encore Fruit
Guilin LAYN Natural Ingredients
Hunan Huacheng Biotech
Krisda
Lakanto
Monk Fruit Corp
Niutang Europe
Northwest Naturals
Organic Herb
Tate & Lyle Plc
Xian Tonking Biotech
*- List Not Exhaustive
Chapter 1. TABLE OF CONTENTS
Chapter 2. Introduction to Fruit derived Sweeteners Market
2.1. Market Overview
2.2. Key Statistics and Report Highlights
2.3. Scope of the Comprehensive Study
2.3.1. Market Definition
2.3.2 Countries and Regions Covered
2.3.3 Research Objective
2.3.4 Units, Currency, and Conversions
2.3.5 Industry Value Chain
2.4. Key Market Segments
2.5. Key Companies
2.6. Study Period
Chapter 3. Strategic Analysis Review
3.1. Fruit derived Sweeteners Pricing Analysis and Forecast
3.2. Porter’s Five Forces
3.3. Market Ecosystem
3.4. SWOT Analysis
3.5. Regulatory Scenario
3.3. Effects of Inflation, Russia-Ukraine War, moderating economic growth, and other macroeconomic factors
Chapter 4. Competitive Landscape
4.1. Market Share Analysis
4.1.1. Global Fruit derived Sweeteners Market Share by Company, 2023
4.1.2. Product Offerings of Leading Fruit derived Sweeteners Companies
4.2. Market Entropy
4.2.1. New Product Launches in the Industry
4.2.2. Mergers, Acquisitions, Joint ventures, and Partnerships
4.3. Key Strategies and Best Practices
Chapter 5. Global Market Projections: Best, Reference, and Low Case Scenarios
5.1. Growth Analysis- Case Scenario Definitions
5.2. Low Growth Case Scenario Forecasts
5.3. Reference Growth Case Scenario Forecasts
5.4. High Growth Case Scenario Forecasts
Chapter 6. Market Dynamics
6.1. Fruit derived Sweeteners Market Drivers
6.2. Fruit derived Sweeteners Market Challenges
6.6. Fruit derived Sweeteners Market Opportunities
6.4. Fruit derived Sweeteners Market Trends
Chapter 7. Global Fruit derived Sweeteners Market Outlook Trends
7.1. Global Fruit derived Sweeteners Revenue (USD Million) and CAGR (%) by Type (2021-2032)
7.2. Global Fruit derived Sweeteners Revenue (USD Million) and CAGR (%) by Application (2021-2032)
7.3. Global Fruit derived Sweeteners Revenue (USD Million) and CAGR (%) by Product (2021-2032)
By Type
Apple
Grape
Carob
Pineapple
Monk Fruit
Others
By Application
Beverages
Food
Pharmaceuticals
Others
Chapter 8. Global Fruit derived Sweeteners Regional Analysis and Outlook
8.1. Global Fruit derived Sweeteners Revenue (USD Million) By Regions (2021- 2032)
8.2. North America Fruit derived Sweeteners Revenue (USD Million) by Country (2021-2032)
8.2.1. United States Fruit derived Sweeteners Regional Analysis and Outlook
8.2.2. Canada Fruit derived Sweeteners Regional Analysis and Outlook
8.2.3. Mexico Fruit derived Sweeteners Regional Analysis and Outlook
8.3. Europe Fruit derived Sweeteners Revenue (USD Million), by Country (2021-2032)
8.3.1. Germany Fruit derived Sweeteners Regional Analysis and Outlook
8.3.2. France Fruit derived Sweeteners Regional Analysis and Outlook
8.3.3. United Kingdom Fruit derived Sweeteners Regional Analysis and Outlook
8.3.4. Spain Fruit derived Sweeteners Regional Analysis and Outlook
8.3.5. Italy Fruit derived Sweeteners Regional Analysis and Outlook
8.3.6. Russia Fruit derived Sweeteners Regional Analysis and Outlook
8.3.7. Rest of Europe Fruit derived Sweeteners Regional Analysis and Outlook
8.4. Asia Pacific Fruit derived Sweeteners Revenue (USD Million) by Country (2021-2032)
8.4.1. China Fruit derived Sweeteners Regional Analysis and Outlook
8.4.2. Japan Fruit derived Sweeteners Regional Analysis and Outlook
8.4.3. India Fruit derived Sweeteners Regional Analysis and Outlook
8.4.4. South Korea Fruit derived Sweeteners Regional Analysis and Outlook
8.4.5. Australia Fruit derived Sweeteners Regional Analysis and Outlook
8.4.6. South East Asia Fruit derived Sweeteners Regional Analysis and Outlook
8.4.7. Rest of Asia Pacific Fruit derived Sweeteners Regional Analysis and Outlook
8.5. South America Fruit derived Sweeteners Revenue (USD Million), by Country (2021-2032)
8.5.1. Brazil Fruit derived Sweeteners Regional Analysis and Outlook
8.5.2. Argentina Fruit derived Sweeteners Regional Analysis and Outlook
8.5.3. Rest of South America Fruit derived Sweeteners Regional Analysis and Outlook
8.6. Middle East and Africa Fruit derived Sweeteners Revenue (USD Million) by Country (2021-2032)
8.6.1. Middle East Fruit derived Sweeteners Regional Analysis and Outlook
8.6.2. Africa Fruit derived Sweeteners Regional Analysis and Outlook
Chapter 9. North America Fruit derived Sweeteners Analysis and Outlook
9.1. North America Fruit derived Sweeteners Revenue (USD Million) by Segments (2021-2032)
9.1.1. North America Fruit derived Sweeteners Revenue (USD Million) by Type (2021-2032)
9.1.2. North America Fruit derived Sweeteners Revenue (USD Million) by Application (2021-2032)
9.1.3. North America Fruit derived Sweeteners Revenue (USD Million) by Product (2021-2032)
By Type
Apple
Grape
Carob
Pineapple
Monk Fruit
Others
By Application
Beverages
Food
Pharmaceuticals
Others
Chapter 10. Europe Fruit derived Sweeteners Analysis and Outlook
10.1. Europe Fruit derived Sweeteners Revenue (USD Million), by Segments (USD Million) (2021-2032)
10.1.1. Europe Fruit derived Sweeteners Revenue (USD Million) by Type (2021-2032)
10.1.2. Europe Fruit derived Sweeteners Revenue (USD Million) by Application (2021-2032)
10.1.3. Europe Fruit derived Sweeteners Revenue (USD Million) by Product (2021-2032)
By Type
Apple
Grape
Carob
Pineapple
Monk Fruit
Others
By Application
Beverages
Food
Pharmaceuticals
Others
Chapter 11. Asia Pacific Fruit derived Sweeteners Analysis and Outlook
11.1. Asia Pacific Fruit derived Sweeteners Revenue (USD Million), and Revenue (USD Million) by Segments (2021-2032)
11.1.1. Asia Pacific Fruit derived Sweeteners Revenue (USD Million) by Type (2021-2032)
11.1.2. Asia Pacific Fruit derived Sweeteners Revenue (USD Million) by Application (2021-2032)
11.1.3. Asia Pacific Fruit derived Sweeteners Revenue (USD Million) by Product (2021-2032)
By Type
Apple
Grape
Carob
Pineapple
Monk Fruit
Others
By Application
Beverages
Food
Pharmaceuticals
Others
Chapter 12. South America Fruit derived Sweeteners Analysis and Outlook
12.1. South America Fruit derived Sweeteners Revenue (USD Million), by Segments (2021-2032)
12.1.1. South America Fruit derived Sweeteners Revenue (USD Million) by Type (2021-2032)
12.1.2. South America Fruit derived Sweeteners Revenue (USD Million) by Application (2021-2032)
12.1.3. South America Fruit derived Sweeteners Revenue (USD Million) by Product (2021-2032)
By Type
Apple
Grape
Carob
Pineapple
Monk Fruit
Others
By Application
Beverages
Food
Pharmaceuticals
Others
Chapter 13. Middle East and Africa Fruit derived Sweeteners Analysis and Outlook
13.1. Middle East and Africa Fruit derived Sweeteners Revenue (USD Million), by Segments (2021-2032)
13.1.1. Middle East and Africa Fruit derived Sweeteners Revenue (USD Million) by Type (2021-2032)
13.1.2. Middle East and Africa Fruit derived Sweeteners Revenue (USD Million) by Application (2021-2032)
13.1.3. Middle East and Africa Fruit derived Sweeteners Revenue (USD Million) by Product (2021-2032)
By Type
Apple
Grape
Carob
Pineapple
Monk Fruit
Others
By Application
Beverages
Food
Pharmaceuticals
Others
Chapter 14. Fruit derived Sweeteners Company Profiles
14.1 Business Overview
14.2 Product Profiles
14.3 SWOT Profiles
14.5 Recent Developments
14.6 Financial Profile
List of Companies
Acetar Bio-Tech
Archer Daniels Midland Company (ADM)
Austria Juice
Döhler
Encore Fruit
Guilin LAYN Natural Ingredients
Hunan Huacheng Biotech
Krisda
Lakanto
Monk Fruit Corp
Niutang Europe
Northwest Naturals
Organic Herb
Tate & Lyle Plc
Xian Tonking Biotech
15. Methodology and Data Sources
15.1 Customization Offerings
15.2 Subscription Services
15.3 Related Reports
15.4 Publisher Expertise
LIST OF TABLES
Table 1 Market Segmentation Analysis
Table 2 Global Fruit derived Sweeteners Market Share of Leading Companies, 2023
Table 3 Product Offerings of Leading Companies
Table 4 Low Growth Scenario Forecasts
Table 5 Reference Case Growth Scenario
Table 6 High Growth Case Scenario
Table 7 Global Fruit derived Sweeteners Revenue (USD Million) And CAGR (%) By Type (2021-2032)
Table 8 Global Fruit derived Sweeteners Revenue (USD Million) And CAGR (%) By Application (2021-2032)
Table 9 Global Fruit derived Sweeteners Revenue (USD Million) And CAGR (%) By Product (2021-2032)
Table 10 Global Fruit derived Sweeteners Market Revenue (USD Million) By Regions (2021-2032)
Table 11 Global Fruit derived Sweeteners Market Share (%) By Regions (2021-2032)
Table 12 North America Fruit derived Sweeteners Revenue (USD Million) By Country (2021-2032)
Table 13 Europe Fruit derived Sweeteners Revenue (USD Million) By Country (2021-2032)
Table 14 Asia Pacific Fruit derived Sweeteners Revenue (USD Million) By Country (2021-2032)
Table 15 South America Fruit derived Sweeteners Revenue (USD Million) By Country (2021-2032)
Table 16 Middle East and Africa Fruit derived Sweeteners Revenue (USD Million) By Region (2021-2032)
Table 17 North America Fruit derived Sweeteners Revenue (USD Million) By Type (2021-2032)
Table 18 North America Fruit derived Sweeteners Revenue (USD Million) By Application (2021-2032)
Table 19 North America Fruit derived Sweeteners Revenue (USD Million) By Product (2021-2032)
Table 20 Europe Fruit derived Sweeteners Revenue (USD Million) By Type (2021-2032)
Table 21 Europe Fruit derived Sweeteners Revenue (USD Million) By Application (2021-2032)
Table 22 Europe Fruit derived Sweeteners Revenue (USD Million) By Product (2021-2032)
Table 23 Asia Pacific Fruit derived Sweeteners Revenue (USD Million) By Type (2021-2032)
Table 24 Asia Pacific Fruit derived Sweeteners Revenue (USD Million) By Application (2021-2032)
Table 25 Asia Pacific Fruit derived Sweeteners Revenue (USD Million) By Product (2021-2032)
Table 26 South America Fruit derived Sweeteners Revenue (USD Million) By Type (2021-2032)
Table 27 South America Fruit derived Sweeteners Revenue (USD Million) By Application (2021-2032)
Table 28 South America Fruit derived Sweeteners Revenue (USD Million) By Product (2021-2032)
Table 29 Middle East and Africa Fruit derived Sweeteners Revenue (USD Million) By Type (2021-2032)
Table 30 Middle East and Africa Fruit derived Sweeteners Revenue (USD Million) By Application (2021-2032)
Table 31 Middle East and Africa Fruit derived Sweeteners Revenue (USD Million) By Product (2021-2032)
LIST OF FIGURES
Figure 1. Market Scope
Figure 2. Pricing Forecasts Per Unit, 2023- 2032
Figure 3. Porter’s Five Forces
Figure 4. Global Fruit derived Sweeteners Market Revenue (USD Million) By Regions (2021-2032)
Figure 5. Global Fruit derived Sweeteners Market Share (%) By Regions (2023)
Figure 6. North America Fruit derived Sweeteners Revenue (USD Million) By Country (2021-2032)
Figure 7. United States Fruit derived Sweeteners Revenue (USD Million) By Country (2021-2032)
Figure 8. Canada Fruit derived Sweeteners Revenue (USD Million) By Country (2021-2032)
Figure 9. Mexico Fruit derived Sweeteners Revenue (USD Million) By Country (2021-2032)
Figure 10. Europe Fruit derived Sweeteners Revenue (USD Million) By Country (2021-2032)
Figure 11. Germany Fruit derived Sweeteners Revenue (USD Million) By Country (2021-2032)
Figure 12. France Fruit derived Sweeteners Revenue (USD Million) By Country (2021-2032)
Figure 13. United Kingdom Fruit derived Sweeteners Revenue (USD Million) By Country (2021-2032)
Figure 14. Spain Fruit derived Sweeteners Revenue (USD Million) By Country (2021-2032)
Figure 15. Italy Fruit derived Sweeteners Revenue (USD Million) By Country (2021-2032)
Figure 16. Russia Fruit derived Sweeteners Revenue (USD Million) By Country (2021-2032)
Figure 17. Rest of Europe Fruit derived Sweeteners Revenue (USD Million) By Country (2021-2032)
Figure 11. Asia Pacific Fruit derived Sweeteners Revenue (USD Million) By Country (2021-2032)
Figure 12. China Fruit derived Sweeteners Revenue (USD Million) By Country (2021-2032)
Figure 13. Japan Fruit derived Sweeteners Revenue (USD Million) By Country (2021-2032)
Figure 14. India Fruit derived Sweeteners Revenue (USD Million) By Country (2021-2032)
Figure 15. South Korea Fruit derived Sweeteners Revenue (USD Million) By Country (2021-2032)
Figure 16. Australia Fruit derived Sweeteners Revenue (USD Million) By Country (2021-2032)
Figure 17. South East Asia Fruit derived Sweeteners Revenue (USD Million) By Country (2021-2032)
Figure 18. South America Fruit derived Sweeteners Revenue (USD Million) By Country (2021-2032)
Figure 19. Brazil Fruit derived Sweeteners Revenue (USD Million) By Country (2021-2032)
Figure 20. Argentina Fruit derived Sweeteners Revenue (USD Million) By Country (2021-2032)
Figure 21. Rest of Asia Pacific Fruit derived Sweeteners Revenue (USD Million) By Country (2021-2032)
Figure 22. Middle East and Africa Fruit derived Sweeteners Revenue (USD Million) By Region (2021-2032)
Figure 23. Saudi Arabia Fruit derived Sweeteners Revenue (USD Million) By Region (2021-2032)
Figure 24. The UAE Fruit derived Sweeteners Revenue (USD Million) By Region (2021-2032)
Figure 25. Rest of Middle East Fruit derived Sweeteners Revenue (USD Million) By Region (2021-2032)
Figure 26. South Africa Fruit derived Sweeteners Revenue (USD Million) By Region (2021-2032)
Figure 27. Africa Fruit derived Sweeteners Revenue (USD Million) By Region (2021-2032)
Figure 28. North America Fruit derived Sweeteners Revenue (USD Million) By Type (2021-2032)
Figure 29. North America Fruit derived Sweeteners Revenue (USD Million) By Application (2021-2032)
Figure 30. North America Fruit derived Sweeteners Revenue (USD Million) By Product (2021-2032)
Figure 31. Europe Fruit derived Sweeteners Revenue (USD Million) By Type (2021-2032)
Figure 32. Europe Fruit derived Sweeteners Revenue (USD Million) By Application (2021-2032)
Figure 33. Europe Fruit derived Sweeteners Revenue (USD Million) By Product (2021-2032)
Figure 34. Asia Pacific Fruit derived Sweeteners Revenue (USD Million) By Type (2021-2032)
Figure 35. Asia Pacific Fruit derived Sweeteners Revenue (USD Million) By Application (2021-2032)
Figure 36. Asia Pacific Fruit derived Sweeteners Revenue (USD Million) By Product (2021-2032)
Figure 37. South America Fruit derived Sweeteners Revenue (USD Million) By Type (2021-2032)
Figure 38. South America Fruit derived Sweeteners Revenue (USD Million) By Application (2021-2032)
Figure 39. South America Fruit derived Sweeteners Revenue (USD Million) By Product (2021-2032)
Figure 40. Middle East and Africa Fruit derived Sweeteners Revenue (USD Million) By Type (2021-2032)
Figure 41. Middle East and Africa Fruit derived Sweeteners Revenue (USD Million) By Application (2021-2032)
Figure 42. Middle East and Africa Fruit derived Sweeteners Revenue (USD Million) By Product (2021-2032)
By Type
Apple
Grape
Carob
Pineapple
Monk Fruit
Others
By Application
Beverages
Food
Pharmaceuticals
Others
Countries Analyzed
North America (US, Canada, Mexico)
Europe (Germany, UK, France, Spain, Italy, Russia, Rest of Europe)
Asia Pacific (China, India, Japan, South Korea, Australia, South East Asia, Rest of Asia)
South America (Brazil, Argentina, Rest of South America)
Middle East and Africa (Saudi Arabia, UAE, Rest of Middle East, South Africa, Egypt, Rest of Africa)
